EGU Blogs

Matt Herod

Matt Herod is a Ph.D Candidate in the Department of Earth Sciences at the University of Ottawa in Ontario, Canada. His research focuses on the geochemistry of iodine and the radioactive isotope iodine-129. His work involves characterizing the cycle and sources of 129I in the Canadian Arctic and applying this to long term radioactive waste disposal and the effect of Fukushima fallout. His project includes field work and lab work at the André E. Lalonde 3MV AMS Laboratory. Matt blogs about any topic in geology that interests him, and attempts to make these topics understandable to everyone. Tweets as @GeoHerod.

Modelling the Vadose Zone…What fun!

Modelling the Vadose Zone…What fun!

Sometimes our projects take stage and unexpected turns down pathways that we have no experience in whatsoever. My project on the input of Fukushima iodine-129 into groundwater has taken one of those turns. This is not a bad thing, but it is a time consuming one, as these deviations often are. However, instead of bemoaning my new lot in life as modeller of the unsaturated (vadose) zone, I thought I’d share a bit of what I’m doing. By the way, if any of you reading this have any experience modelling the vadose zone I’d love to talk in greater detail with you.

Modelling is an interesting field. The basic idea behind modelling is to try and make a computer program predict what is happening in reality by putting in a bunch of experimental or estimated parameters in and letting the model work through calculations that predict what would happen in nature. This is terrific since it is impossible for me to actually observe what is happening in the vadose zone of my field site. Sure I can do a bunch of experiments to try and empirically measure what is happening over time in the field. However, the cost and time is simply too prohibitive and there is no guarantee that I could even sample in such a way as to get good data back. This is the sort of circumstance where the model really comes into its own.

Models are great, but it is important to remember they do not provide the final answer. It doesn’t matter what is being modelled, the real world is orders of magnitude more complex than the model. Therefore, drawing conclusions based solely on the results of modelling is risky and certainly provides and incomplete picture of reality. Furthermore, models provide such pretty pictures and simple explanations for complex phenomena that it is easy/tempting to fall into the trap of over concluding from the model results. Therefore, when using a model to try to simulate reality is it very important to take the conclusions and results with a grain of salt whether you are the modeller, reviewer or reader.

1

A picture from my model showing 129I transport in grams. The height of the column is proportional to depth.

The beautiful column of blue and green above shows a very preliminary attempt by me to model the transport of iodine-129 through the vadose (unsaturated) zone of an aquifer over a period of time in 2011. The way the model works is I input a bunch of data (educated or even not so educated guesses) on the soil conditions such as porosity, hydraulic conductivity, moisture content and much more. Then I add in the amount of rain that fell on my study area that has a known concentration of iodine. I then let the model run and watch the 129I infiltrate into the ground. When it gets to the bottom that means it has reached the water table. I can then look through the dataset that the model produces and see the number of grams of 129I that have travelled through the vadose zone and how long it took for them to do so.

Untitled

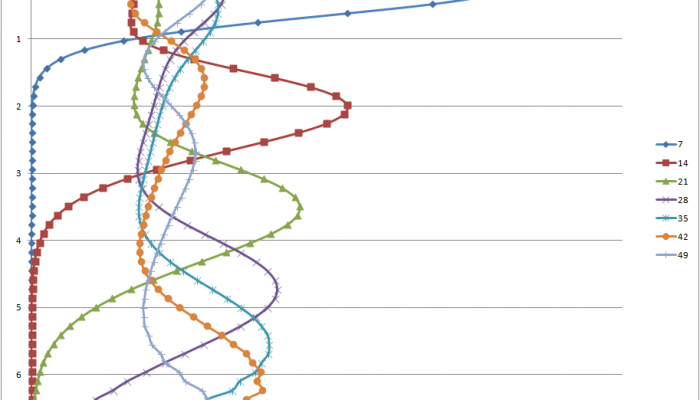
A graph of the model output showing concentration with depth. Each line represents a different snapshot in time. e.g. 7 represents 7 days.

The next step once the model produces a scarily large table of numbers is to try and make some sense of what happened. The blue-green thing is nice, but it doesn’t give a whole lot of information about what is happening over time at different depths. With this table I can then make graphs showing the movement of my iodine over time into the vadose zone. As you can see the “peak” migrates downwards pretty rapidly and within just over a month has moved 7 metres! Of course, this result makes us all think that iodine infiltrates into groundwater really rapidly. The actual truth is not nearly so black and white however. In fact, if I tweak the parameter that controls how iodine sticks to soil I can prevent it from ever getting past the ground surface. This is why all models should be taken with several grains of salt. The input control the outputs, however, a small change in the input can result in a radically different output. Which is the truth??? Only observation and more modelling can tell us!


[polldaddy poll=”7974309″]

#AESRC2014 Highlights

Well, AESRC is done for another year and with it my role as co-chair of the organizing committee! Thank goodness for that! Hopefully, I can finally get some actual thesis related work done in the coming months…and maybe get back to blogging a bit as well. However, as grateful as I am that AESRC is done, I have to say that it was a fantastic conference this year with a host of terrific talks from keynotes and grad students alike.

As I mentioned in my conference opening post AESRC is the only conference in Ontario, maybe Canada for all I know, that is organized by and for graduate students. The entire organizing committee is composed of graduate students and all of the talks, with the exception of keynotes, are given by graduate students. AESRC is meant to be a place where new and experienced grads alike can talk about their work in a less nerve-racking environment. We encourage in progress research or research that does not even have results yet. The idea is that every graduate student can feel comfortable, practice presenting to an educated audience and hopefully enjoy themselves and meet their colleagues from across the province.

Logo2

This AESRC was by far the most well attended in the past 10 years, with over 100 delegates attending from 8 different universities. The conference kicked off with the Icebreaker at a campus pub, where we all got meet each other or reconnect in many cases, while watching hockey and drinking beer. A nice relaxing end to the week and prelude to the science of the weekend. On a personal note, it is always worth attending the Icebreaker at every conference I have been to. More often than not there is free food and drink, but it is a great opportunity to meet new people, spot that keynote you want to talk with and introduce yourself. I try to make of point of meeting at least one new person at every Icebreaker I go to.

Saturday started with some great talk on Environmental Geoscience (my session) and Sedimentology and Petroleum Geology. We had two keynote speakers on Saturday: Paul Mackay from the Canadian Society of Petroleum Geologists and Dr. Jack Cornett from uOttawa. The video of Jack’s talk is below.

Click here to display content from YouTube.
Learn more in YouTube’s privacy policy.


To summarize, in case you didn’t watch the entire video, Jack discusses the incredible range of radionuclides that are found naturally occurring on Earth and the vast range of geologic problems these nuclides can be applied to. He also talks about how we can use accelerator mass spectrometry to measure these radionuclides at incredibly low levels, which is how we are able to apply them to geologic questions. To illustrate this point Jack discussed the case study of chlorine-36 in the Cigar Lake uranium mine in Saskatchewan, Canada.

Saturday concluded with a fantastic dinner at the nearby National Arts Centre and another terrific keynote by Dr. Becky Rogala on the challenges of extracting bitumen from the oil sands and the importance of having an accurate understanding of the sedimentology to ensure maximum efficiency of SAGD recovery. There was also quite a bit of beer.

Sunday started nice and early with the Geophysics session as well as the Paleontology and Tectonics sessions as well. Our keynote for the geophysics session was Dr. Glenn Milne from uOttawa, who was an author on the most recent IPCC report and is an expert on sea level change.

Click here to display content from YouTube.
Learn more in YouTube’s privacy policy.


We also had another great keynote from uOttawa in the tectonics session in Dr. Jon O’Neil. The video of his talk on the oldest rocks on Earth (4.4 billion years old) is coming soon! That pretty much wraps up AESRC2014! It was a great weekend, there was lots of great science and I am really glad its over. I likely won’t be around for next year’s AESRC at Queens University (fingers crossed), however, I am sure it will be great.

IMGP1447

Yours truly giving his talk on iodine-129 fallout from Fukushima. (Photo: Viktor Terlaky)


Opening of #AESRC2014

Today marks the opening of the 13th annual AESRC conference at uOttawa. The AESRC (Advances in Earth Science Research) is the geology conference in Canada that is organized by and for graduate students only. This year uOttawa is the host and March has been a ridiculously busy month preparing to host AESRC for over 120 delegates including faculty from uOttawa and other Canadian geology departments as well as industry representatives.

This year’s AESRC marks a number of significant milestones for the conference and we hope it will be the best ever. This will be the biggest AESRC ever with close to 50 oral presentations and 30 posters by graduate students from all over Ontario and Quebec. This is also the first time AESRC has had to run concurrent session rooms as well. One of the best things about AESRC is that it allows grad students a somewhat lower stress place to present research in progress to their peers without fear of being embarrassed at a large international conference where most talks are nearly ready for or already have been published. AESRC is considered and excellent place to present work that is in varying stages of completion from early conception and looking for suggestions and constructive feedback to practicing a talk for an upcoming Goldschmidt or AGU. This philosophy makes AESRC unique as far as I know and it is a truly valuable and rewarding experience to be a part of (plus there is a lot of prize money up for grabs)!

We are also fortunate enough to have several excellent keynotes whose talks will be videotaped and posted here and on the AESRC website for all to enjoy. I will also be live tweeting AESRC under the hashtag #AESRC2014 and posting a few blog posts here as well briefly summarizing some of the terrific science that Canadian geology grad students are working on.

Logo2


One thing I should also mention is that AESRC would not be possible without the generosity of the Canadian geology community, the department hosting and the host university. Numerous times all I had to do was say the words “grad student run conference” to get university departments to lower fees and help facilitate this weekend. There are also perennial AESRC sponsors that year after year contribute money to help the local organizing committee put on a fantastic conference and allow us to charge only a nominal registration fee.

UntitledStay tuned for lots more to come!

Matt


The Most Epic Unboxing Ever

The Most Epic Unboxing Ever

There is a strange phenomenon on the internet called unboxing. Unboxing is when a person receives a new package of something and takes a video or pictures of the process of opening it for the first time and posts it online.  Mostly, from what I can see, people “unbox” electronics or hockey cards or things of that nature. However, what I have today could be called the granddaddy of all unboxings; I have a series of photos of the unboxing and, initial stages of set-up of the University of Ottawa’s new, 3 million volt, accelerator mass spectrometer (AMS), which cost 5 million dollars. This takes opening your new laptop or that Sidney Crosby rookie card to a whole new level!!! The AMS will be housed in uOttawa’s new Advanced Research Complex.

The accelerator portion in its shipping container being transferred into our new building. (Photo: Dr. Liam Kieser)

The accelerator portion in its shipping container being transferred into our new building. (Photo: Dr. Liam Kieser)

P1030935r

Easy does it. Now pivot!!! (Photo: Dr. Liam Kieser

Since I am showing pictures of this incredible piece of equipment being installed I’ll explain a bit about what it is an how it is used as well. I use the AMS in my own work to analyze iodine-129, chlorine-36 and once or twice carbon-14. In short, tools that can be used for groundwater dating. However, the AMS is capable of analyzing for a huge range of isotopes and this allows its use a wide variety of disciplines from health science to homeland security.

The AMS works on the same principles and a regular mass spectrometer, but it has a few key differences that make it extremely powerful.

Untitled

P1030975a

Lots of boxes to open. (Photo: Dr. Liam Kieser)

P1040117a

Once the boxes have been unloaded the building begins. It is like building an IKEA desk, but somehow more… (Photo: Dr. Liam Kieser)

The process of AMS analysis begins with the preparation of the samples, which involves large amounts of lab time in extremely clean conditions. Contamination of samples with unwanted isotopes is a real problem in AMS so great care has to be taken to prepare good samples. The sample is then mixed with niobium powder and pressed into a steel cartridge. The cartridge then gets loaded into the ion source where cesium ions get fired at the sample like shooting a gun. The Cs ions physically break bits of the sample off the cartridge and these get negatively ionized and accelerated out of the ion source towards the first magnet. 

P1040128a

Xiao-lei carefully taking the glass rings that are in the accelerator. These are to kill any free electrons that could escape from the stripper canal as well as keep the ions on a stable flight path. X-rays charged to 3 million volts are very bad! (Photo: Dr. Liam Kieser)

P1040147a

The glass rings all put together with the stripper canal in the centre. The stripper canal is where electron get stripped off the negative ions turning them into positive ions as well as keeping the ions on a straight and even flight path. (Photo: Dr. Liam Kieser)

This is what the ion source looks like. Up to 200 samples sit in the big wheel waiting their turn. The AMS control room is those windows in the background.

2014-02-07 13.11.18

Our fancy new SO-110 ion source. (Photo: Matt Herod)

Once the samples leave the ion source they are accelerated to the first bending magnet which can bend an incredible range of masses. From tritium to plutonium tri-fluoride.

2014-02-07 13.11.43

The first magnet looking towards the accelerator. (Photo: Matt Herod)

The next step is firing the ion into the particle accelerator that carries a charge of 3 million volts! Inside the accelerator is a passage called a stripper canal that pulls electrons off the ions turning them from negative into positive ions. The reason for this is that this allows us to get rid of interferences that normal mass spectrometers face. For example, chlorine-36 has an interference with sulphur-36 making it impossible to analyse using normal mass specs. Actually, our AMS has another modification that makes 36Cl analysis possible on a 3MV machine, which is generally considered too small for this isotope. Usually, 36Cl needs a much larger accelerator however, our isobar separator for anions (ISA) allows this. Once the ion leaves the stripper canal it is accelerated at very great speed into the next magnet.

2014-02-07 13.10.31

Dunh, dunh, dunh. This is the A in AMS! (Photo: Matt Herod)

2014-02-07 13.10.57

This is the biggest magnet I have ever seen!! It is over 3m long and weighs 18 tonnes! This is why the room needs an overhead crane. (Photo: Matt Herod)

Once the ions are redirected and isotopes are further separated by the magnet they are ready to be analyzed in either the Faraday cups for the common isotopes or the gas ionization detector for rare isotopes.

2014-02-07 14.39.53

Me, touching the Faraday cups. (Photo: Laurianne Bouchard)

2014-02-07 13.10.39

The gas ionization detector. This bad boy literally counts atoms as they come around yet another magnet and through a silicon nitride window. Once they enter the detector which is filled with gas they ionize it which leads to pulses of electricity that are counted. This is the end of the AMS!!! (Photo: Matt Herod)

Once the atoms are counted in the gas ionization detector their trip around the AMS is over! It is quite a journey and full of positives and negatives (haha, a little pun there). Seriously, though this gigantic instrument is used to quantify the smallest of small quantities and can very literally count atoms. The AMS has a massive number of possible uses and I’ll likely be posting about these as this new facility starts to ramp up in the next few months. In addition to the AMS we also have an SEM, microprobe, stable isotope equipment, two noble gas mass spectrometers, ICP-MS, LA-ICP-MS, ICP-AES and a host of other MS’s as well. There will be very few types of isotopes that we cannot analyze for and this facility will be one of the best in the world for this type of geological research. Stay tuned for further developments as we start to move in soon!

Cheers,

Matt