Flo takes us on a photoblog-trip to Siwa Oasis in Egypt where epic sand seas meet freshwater springs, saline lakes and sulphurous hot pools!
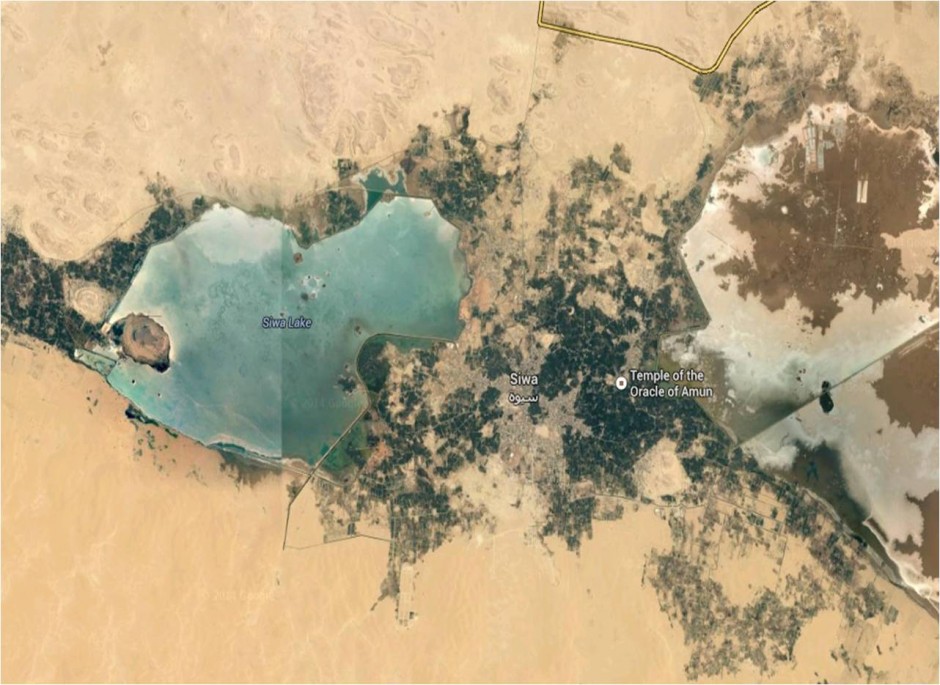
Siwa Oasis, adapted from Google Earth.
The blog’s going on holiday this week! I spent a week in Egypt on holiday last month and braved the 10 hour overnight bus journey from the capital city Cairo to visit the breathaking beauty of the Siwa Oasis in the Egyptian sand sea of the Libyan desert. I have to say that the shift from big-city Cairo to Siwa via a 10 hour bus drive added a real sense of remoteness when we pulled into the town, bleary-eyed the following morning.
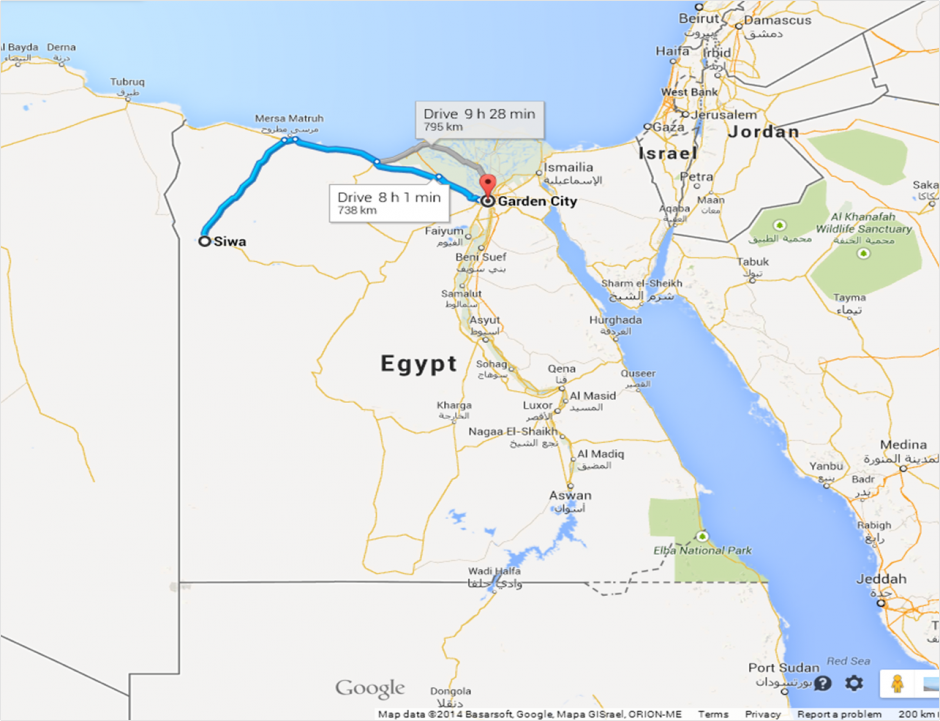
Map of Egypt with the route from Cairo-Siwa, adapted from Google Maps.
I really didn’t know anything about Siwa at all before arriving there apart from noticing the numerous and ubiquitous boxes of Siwan bottled water around Cairo, not an industry I had associated with a small town in the middle of the desert. I’ve always thought of oases as being on a small scale and having a fabled quality and so suffice to say I wasn’t ready for the numerous lakes, springs and hot pools that abound in Siwa.
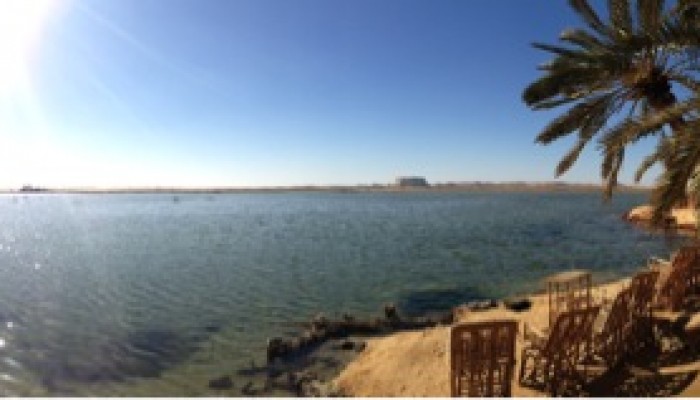
Siwa is an area of contrasts, the epic sand dunes visible to the west of town are juxtaposed with over a 1000 fizzing natural springs, sulphurous hot pools, and hypersaline lakes. It’s this unique collection of features that brought people to settle here over 12,000 years ago and continues to attract tourists, despite its remote location! And it is certainly bizarre to be in the middle of a desert and find that almost all the things to visit are water related.
History
Aside from the mind boggling landscape and geology, Siwa has an unusual and diverse history. It is one of Egypt’s most isolated settlements, both geographically and culturally with a population predominantly made up of ethnic Siwans who speak Siwi, a distinct language of the Berber family with a smaller proportion of Arabic-speaking Egyptians. Historically, Siwa is famous as the home of the Oracle of Amun and the ruins of this temple can still be visited today.
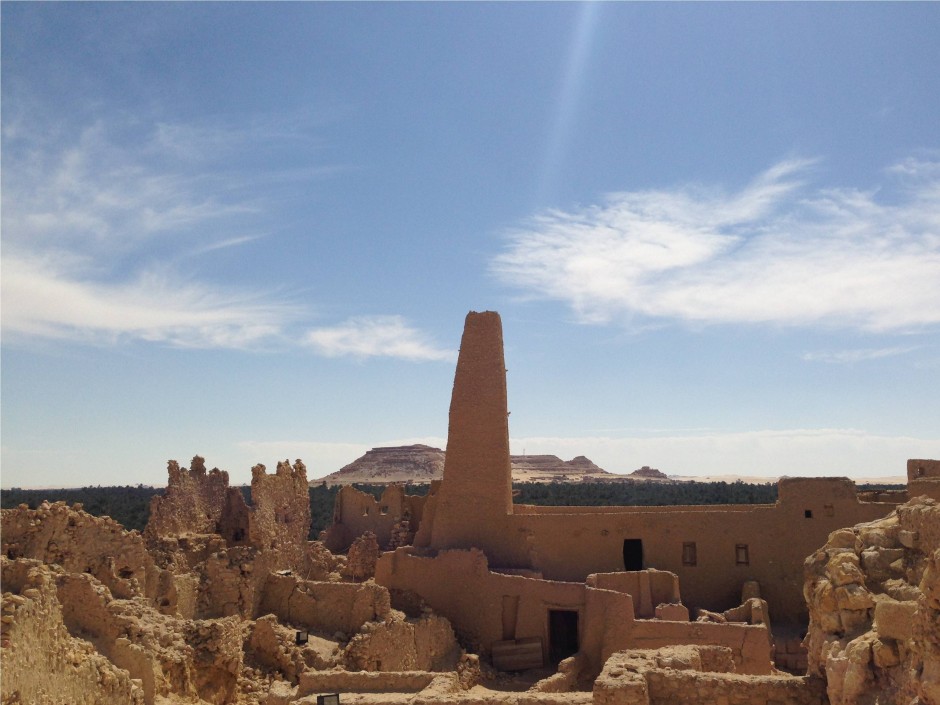
View of Siwa Landscape from the Temple of Amun – Authors own image.
It was here that Alexander the Great travelled (as well as founding Alexandria), during his campaign to conquer the Persian empire in 332 BC to consult the Oracle of Amun. There it is alleged the Oracle confirmed Alexander the Great as both a divine personage and the legitimate Pharoah of Egypt! The remoteness of the oasis meant that contact with the outside world was rare. The first record of a European visiting since roman times was the English traveler William George Browne who arrived in 1792 to see the ancient temple of the oracle. The oasis wasn’t even officially added to Egypt until 1819 and the first asphalt road to Siwa wasn’t built until the 1980’s! This isolation has served to preserve the delicate environmental and cultural balance of the Oasis. A small town of around ~23,000 people, Siwa’s economy is based on agriculture, largely olives and dates, some tourism and the water bottling plants dotted around the Oasis. But how did all this water come to be here? As with all things, we need to start with the geology!
Regional geology and geography
The area around Siwa is described as a ‘slightly undulating limestone plateau’ of Miocene age as the 1910 geological map of Egypt shows below and the vast areas of the map marked ‘Unexplored’ give you some insight as to how remote and difficult some of this terrain is.
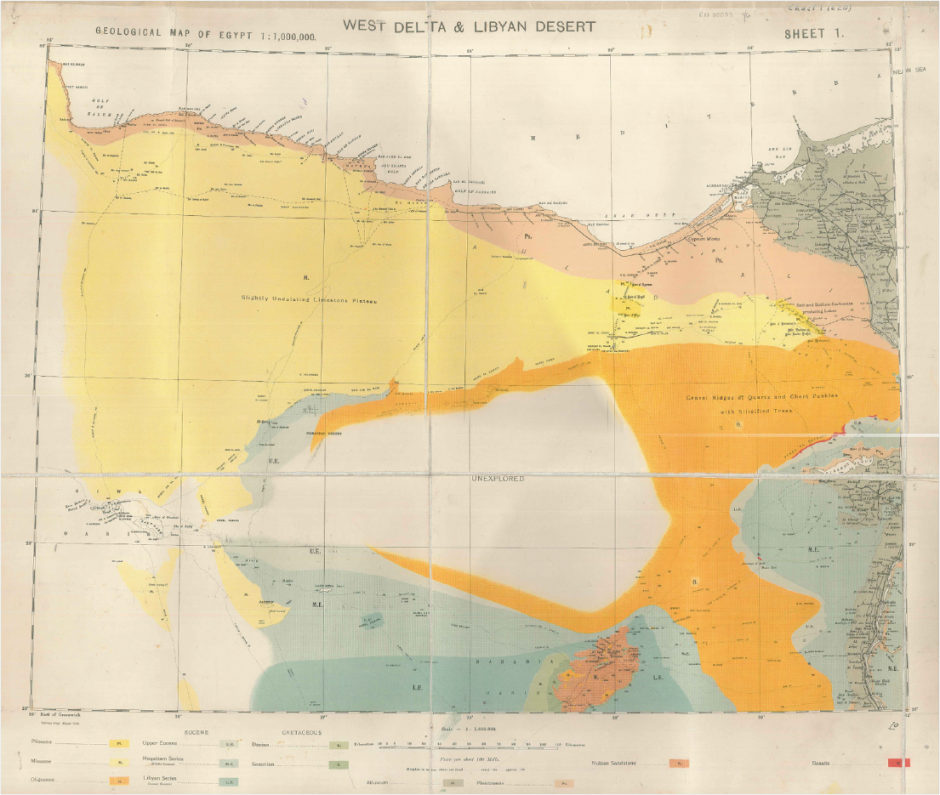
1910 Geological Map of Egypt by the Survey Department of Egypt. Image out of Copyright.
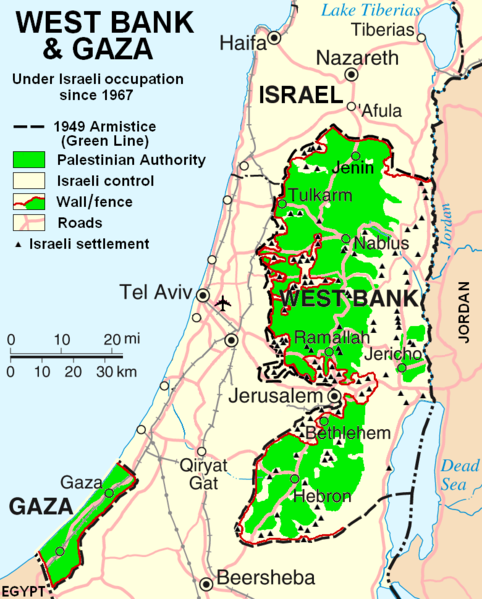
Siwa sits in the Qattara depression which spans the north west of Egypt. Much of the depression sits below sea level: at its deepest it sits at 133m below sea level making it the second lowest point in Africa. It is bounded by steep slopes to the North side and to the south and west it grades into the Great Sand Sea.
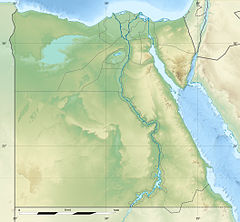
Map of Egypt showing the location of the Qattara depression in blue – Source – Eric Gaba, Wikimedia Commons.
The depression is thought to be formed by the processes of salt weathering and wind erosion working together. The intense aelioan weathering causes the salt to crumble the depression floor and then the wind blows away the resulting sands.

Souvenirs made from salt-rock for sale in Siwa. Image Author’s own.
Salt is an issue in Siwa (although it makes for a modest market in selling bottled salt and also salt-rock souvenirs such as lamps). A number of fresh water springs that occur naturally in the Oasis run into salt water lakes making a lot of the water useless. Often even the spring water has an elevated level of salt and so not good for agriculture. This limits agricultural production in the area to mostly hardy crops such as dates and olives.
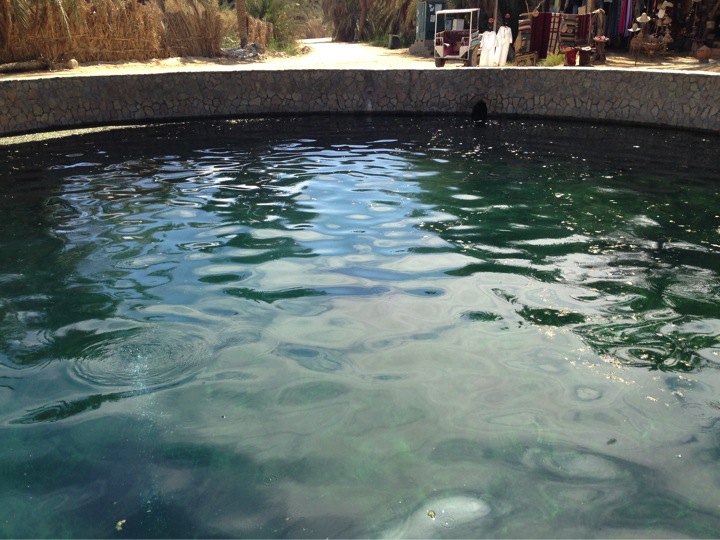
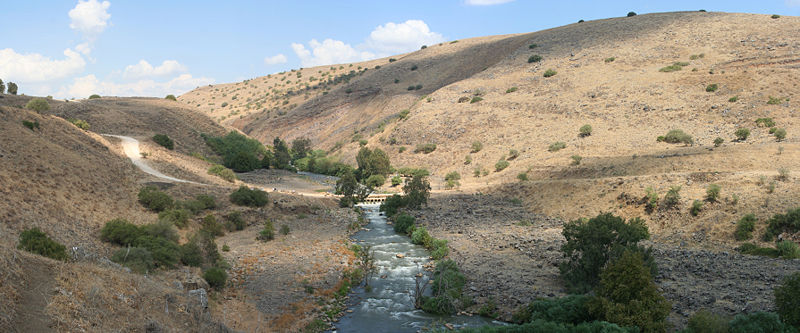
Just one of the 1000’s of springs in the Siwa area, this is ‘Cleopatra’s Pool’. The spring water here bubbles up from depth at pressure. Image Author’s own.
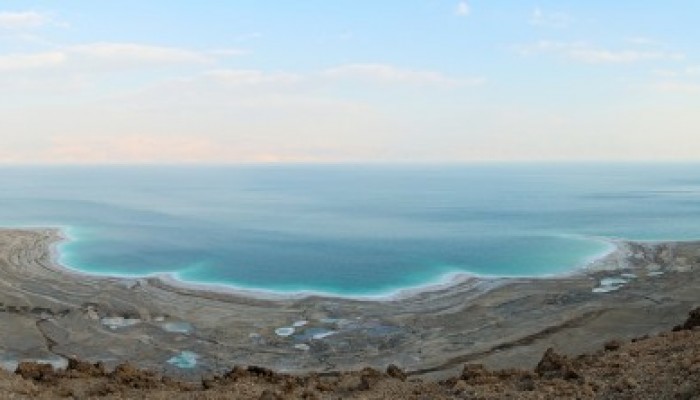
The main Oasis lakes Birket al-Maraqi and Birket Siwa are saline and no marine life survives. Indeed some of the water is so salty that you can see crystals growing in the water. The salty soil of the oasis continues to be used to build the traditional mudbrick houses which creates a problem. While the salt helps to strengthen the walls of the house, it also melts in the rain. And it doesn’t take much to destroy the houses, in 1928, a major storm resulted in the local inhabitants abandoning their ancient town including the ancient Shali Fort found in the centre of the town. These days new houses are prefabricated to remove the risk of rain melting the building materials!
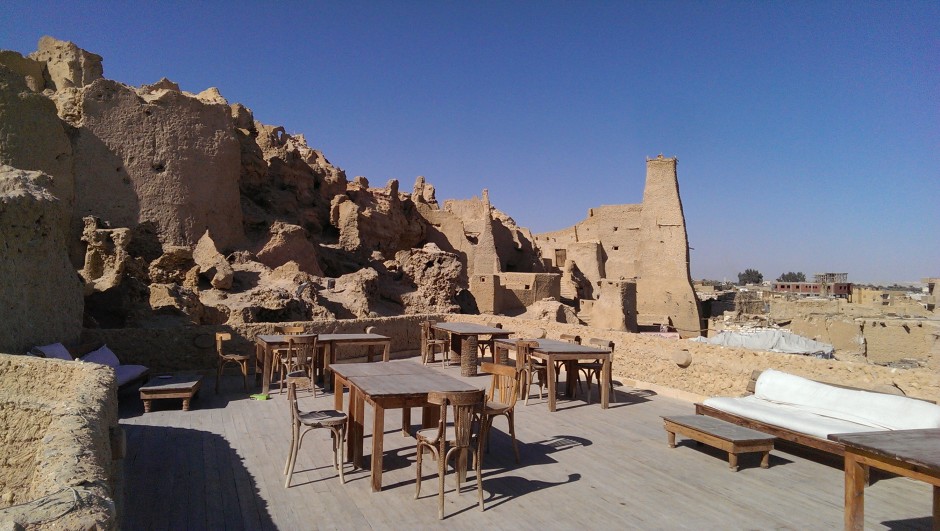
Shali Fort in the centre of Siwa made from salty mud sourced from the oasis. You can see the damage sustained y the 1928 storm in the collapsing walls. Image Author’s own.
The Wet with the Dry
The Wet
With a mean annual precipitation of 8mm and many rainless years, the vast lakes in the region have something other than the weather to thank for their existence. The wide spanning Qattara depression contains a number of small basins on the floor which hold lakes. It is thought that these lakes were much larger during the Pleistocene Ice Age. It is at the fossil shorelines of these lakes that you can find the bounty of fossils we saw on our trip. These days the levels of the lakes fluctuate seasonally with some lakes drying up completely during the summer seasons.
The numerous springs supply that supply water to the lakes is thought to have been underground for 30,000-50,000 years in the Nubian Sandstone Aquifer System which is considered to be a non-renewable source of water in the North Africa area. It covers parts of Libya, Egypt, Sudan and Chad having a huge storage capacity of ~200,000 bcm of fresh water.

Hot sulphurous springs at Bir Wahed. Image Author’s own.
Whilst the features of Siwa Oasis are broadly natural phenomena there are some other beautiful water-related sites in the area which had a bit of a helping hand in their formation. Around 15km South-West of Siwa you come to the hot and cold springs of Bir Wahed. Both public bathing spots, the first is a sulphurous hot pool where you can relax under the desert sun, and the second is a large cold spring water lake. These two formed when a Russian or American ( depending on who you speak to) oil company came to do some prospective drilling in the 80’s. They didn’t find any oil but they did find water and their activity created the two mini-oases found there today. Now they serve as blissful tourist stops amid the dunes of the Great Sand Sea.
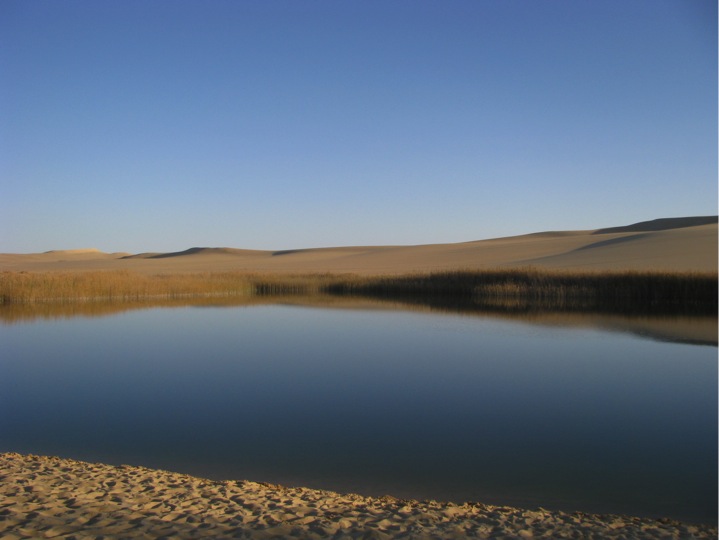
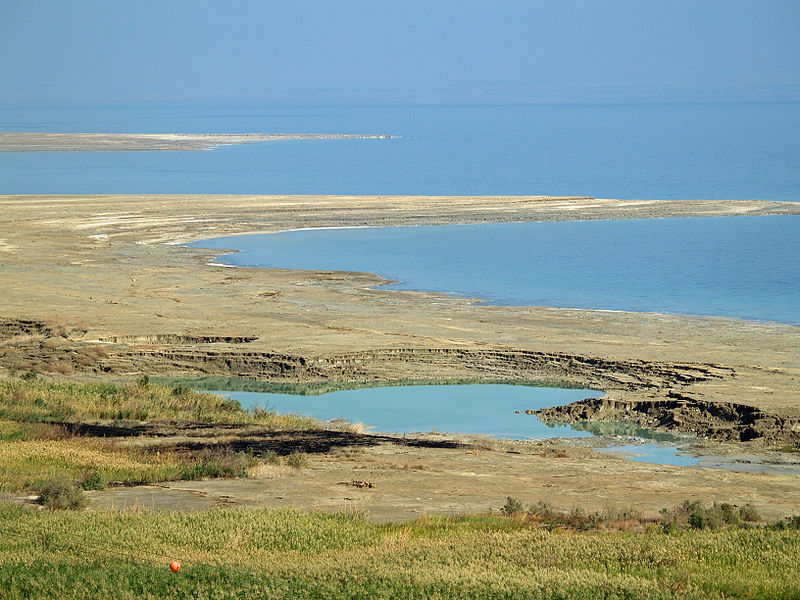
The cold spring lake at Bir Wahed, formed during prospective drilling for oil in the 80’s. Image Author’s own.
The Dry
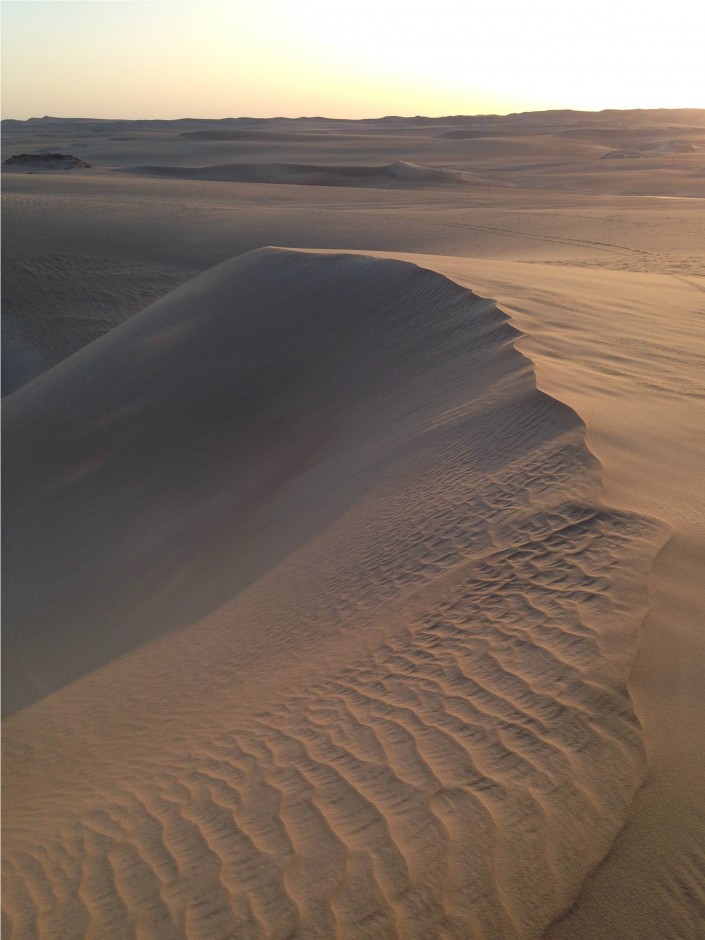
Sand dunes in the Great Sand Sea. Image Author’s Own.
The Great Sand Sea seen to the West of Siwa Oasis is a 72,000 sq km behemoth of a desert (about the size of Ireland) and is made up predominantly of parallel seif dunes some over 100m high and over 150km long. The area has a rather morbid and adventurous past dating back 2,500 years ago when a 50,000 strong Persian army led by the Persian King Cambyses II is thought to have drowned in the sands of the western Egypt desert during a sandstorm. It was reported in 2012 that the remains of the army may have finally been found and thus solving one of archaeology’s biggest outstanding mysteries. Having spent the afternoon in the dunes, it’s wasn’t hard to see how you could lose your bearings without the aid of modern technology.
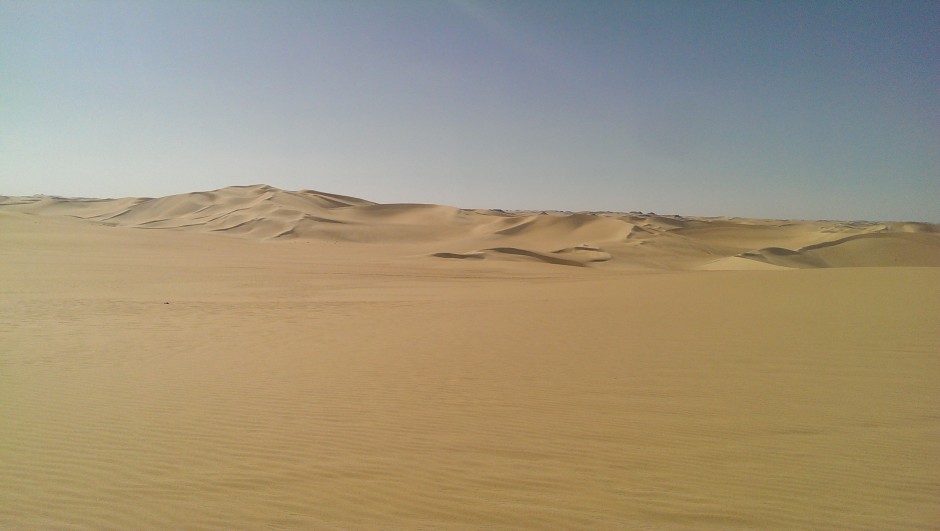
Great Sand Sea, Egypt. Image Author’s Own.
The landscape of the areas is mainly shaped by aeolian processes causing deflation hollows (where the force of the wind is concentrated on a particular spot in the landscape), erosion can carve out a pit knowns as a deflation hollow. They can range in size from a few metres to a hundred metres in diameter. Much larger, shallower depressions called pans can also form which cover thousands of square kilomeres. The Qattara depression is one of the largest pans in the world, while Siwa is a smaller pan. The Great Sand Sea wasn’t always a desert and large areas are thought to have been submerged underwater as attested to by the presense of rich fossil-bearing sediments outcropping in the desert. The fossil finds in this area include a whale skeleton, a human footprint, oysters and echinoids up to Miocene in age.
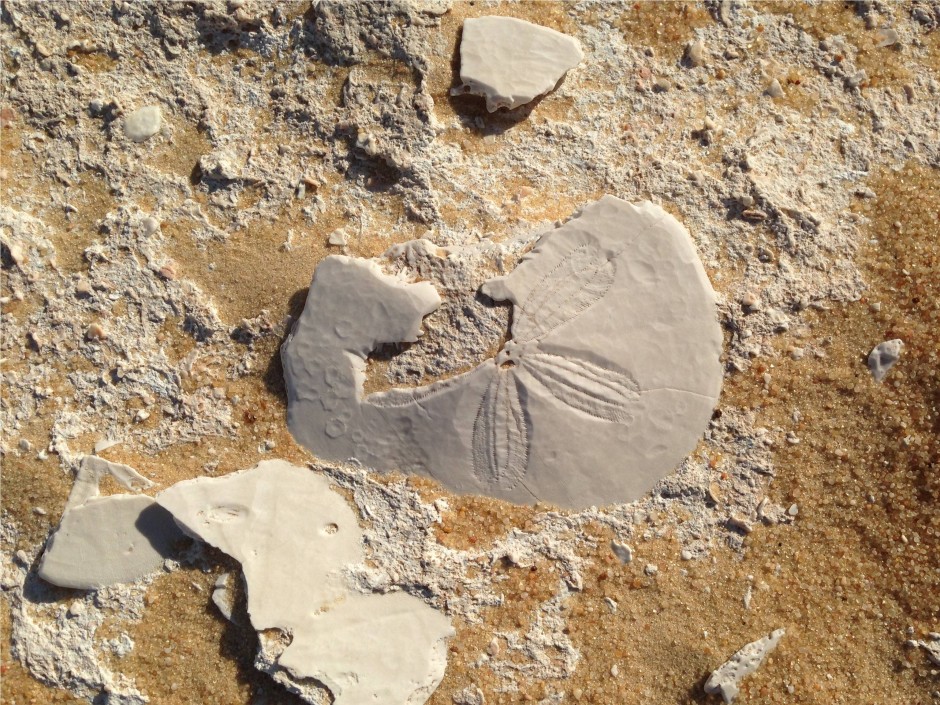
Fossils found exposed in the Great Sand Sea. Imasge Author’s Own.
Finding sea-living fossils in the desert reminded me of just how powerful geological understanding is. Standing looking out over the wind shaped dunes, it’s hard to imagine a thriving shallow sea existing here, but that it did and the deposits and fossils help us to observe and understand past environments, however different they may have been! Water Management
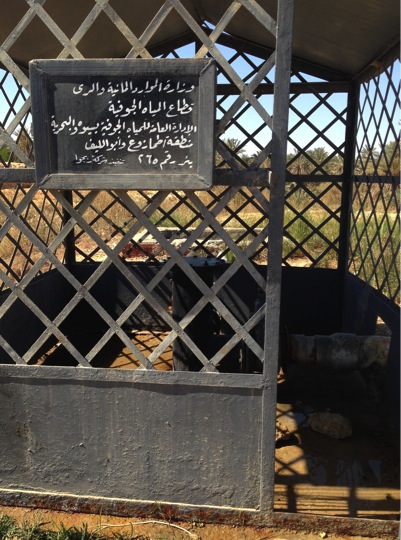
Groundwater Well in Siwa. Image Author’s Own.
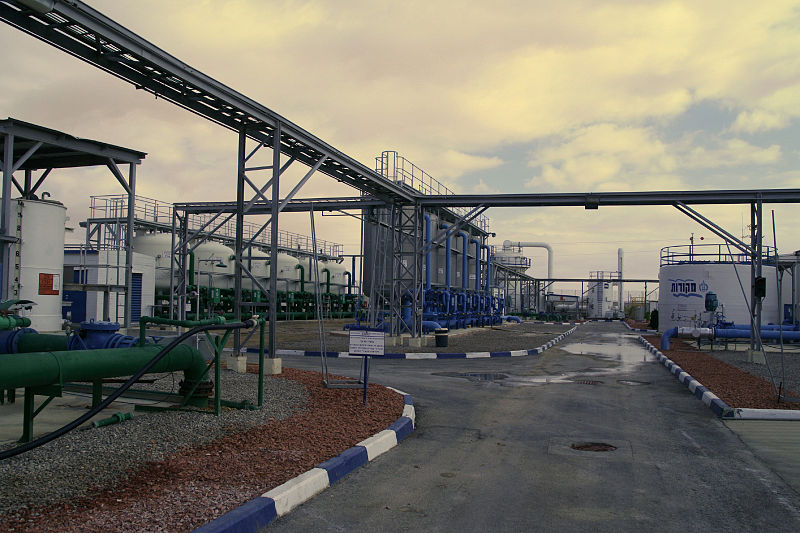
Groundwater is the only source of water in Siwa which is used for home use as well as for agriculture and the local economy including the four companies that now bottle water in Siwa. For 1000’s of years the natural system was sustainably preserved but emerging pressures from development, tourism and climate change could put this delicate water system and the ecosystems it supports at risk.
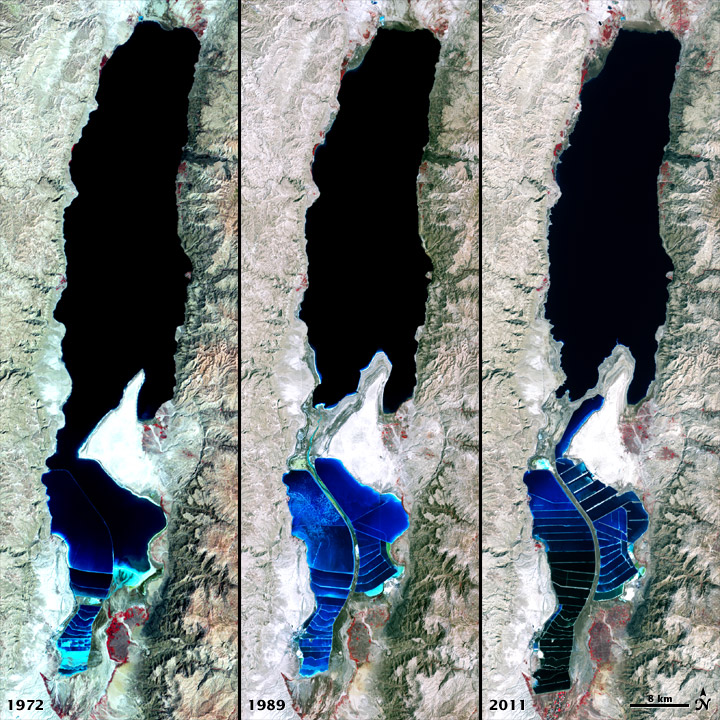
Since the 1960s the Oasis has experienced significant changes in activity patterns which have had an impact on land use and water management. These days in drier parts of the year the Oasis lake is often dry leaving only mud flats behind due to local government irrigation practices siphoning water away from the lake.
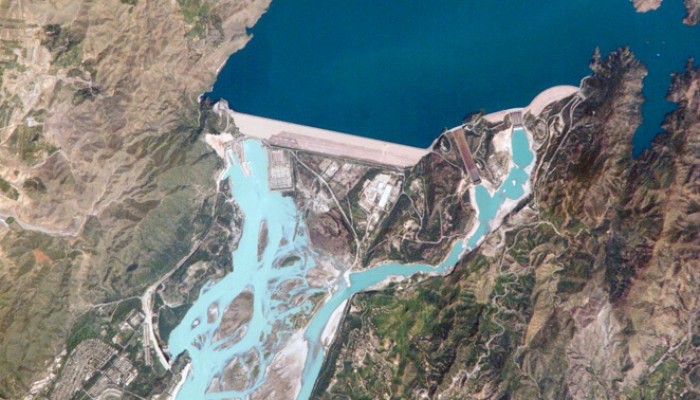
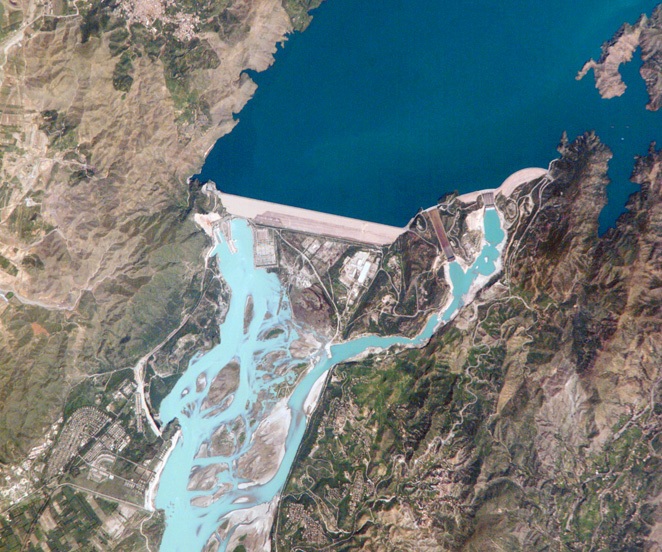
The large size of the Qattara depression and the fact that it’s at a very low altitude has led to several proposals to create a massive hydroelectric project in northern Egypt rivalling the Aswan high dam. Interest in this has waned slightly in recent years but future stability in the country could create the climate for development and this would have significant impacts on the Siwa region.