In this blog post we speak with Maheshwari Neelam, the primary author of this research presented at EGU25 on the impact of dessication of the Great Salt Lake on mental health, read on to learn more about her research!
The Great Salt Lake (GSL) is the fourth largest terminal lake in the world, located in Utah, United States. Over the years, water diversions for agriculture and other human activities have caused the lake to shrink, Figure 1. This shrinkage of the lake has led to dire environmental and health consequences in the region.
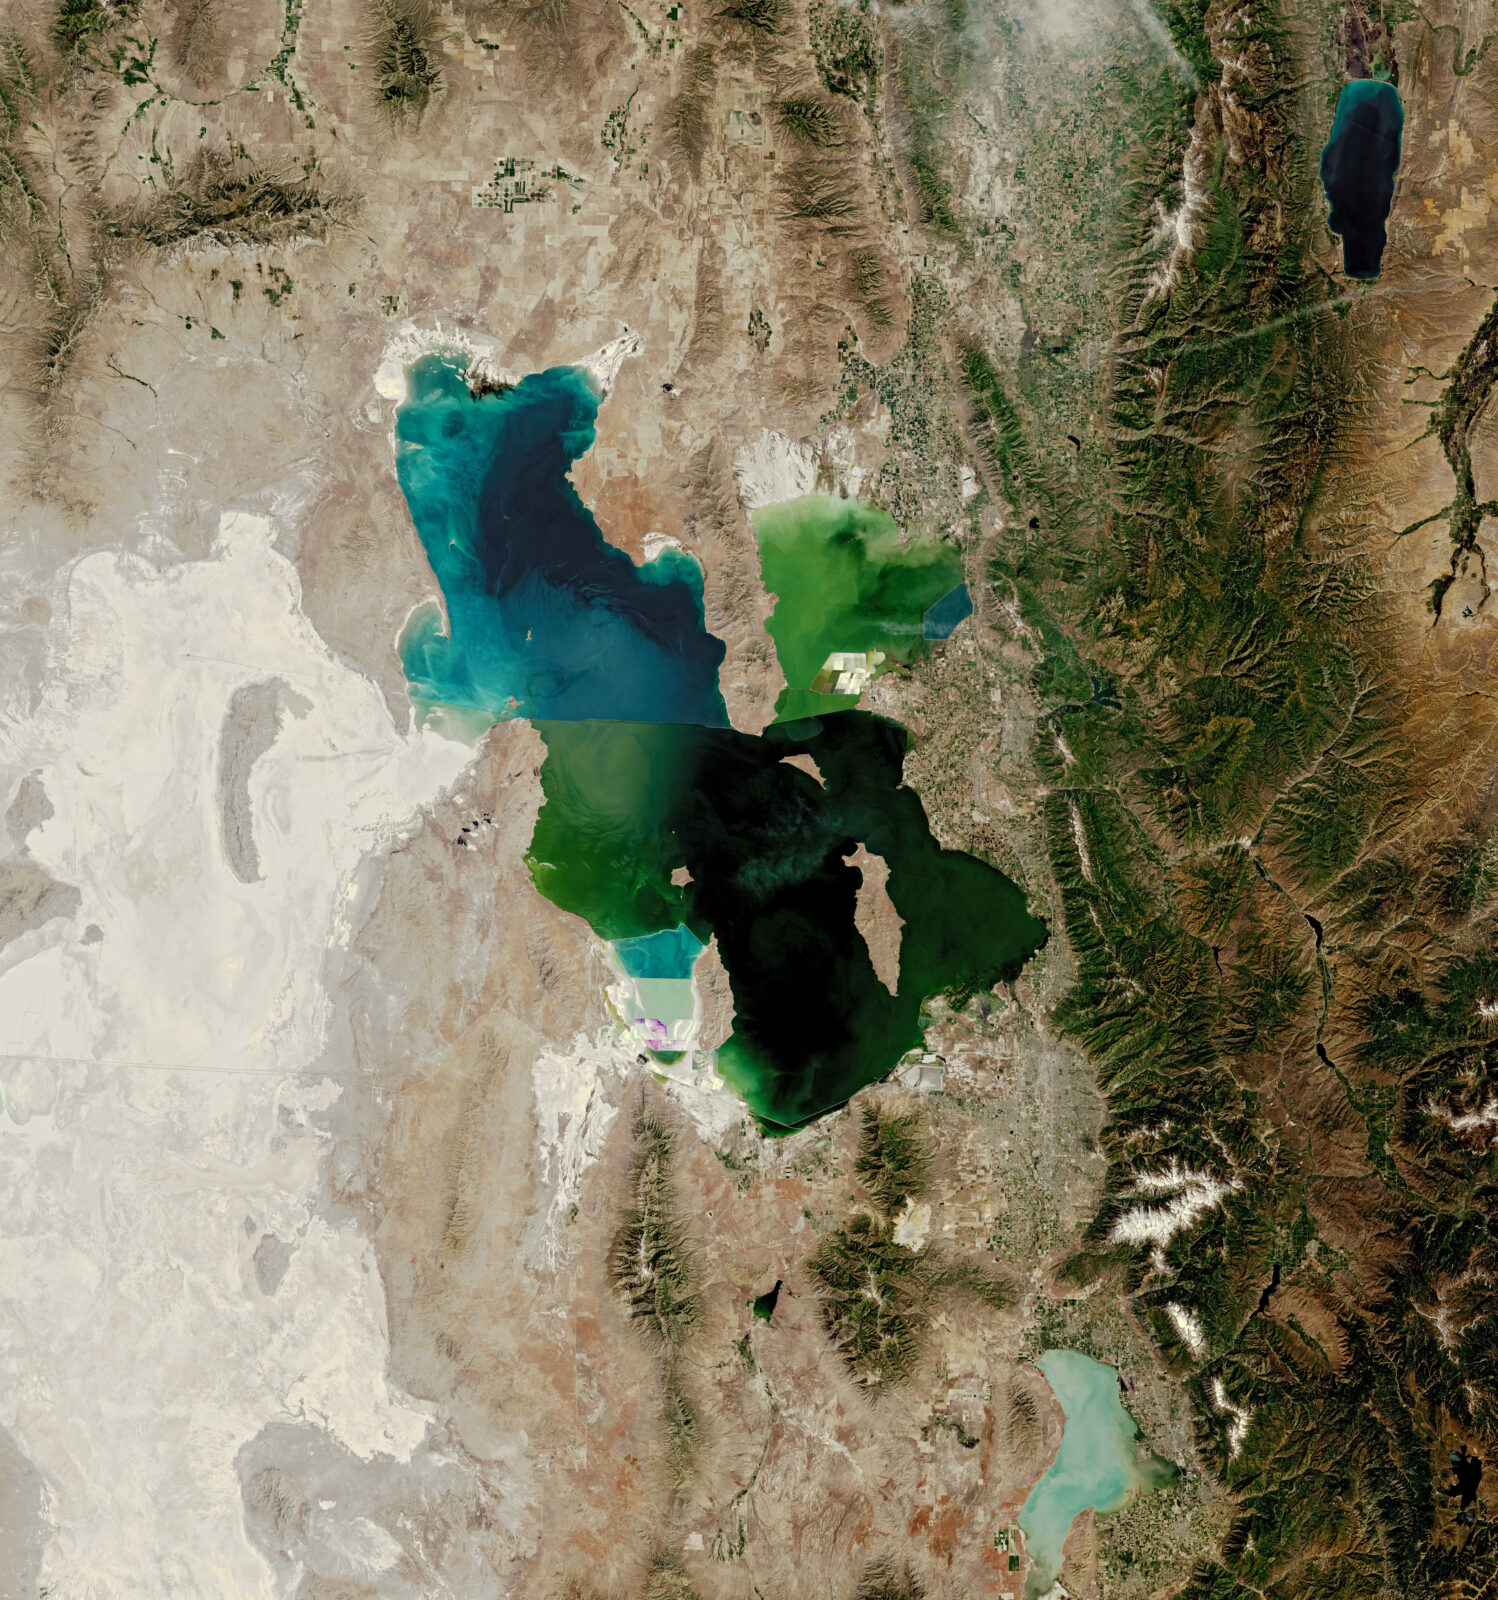
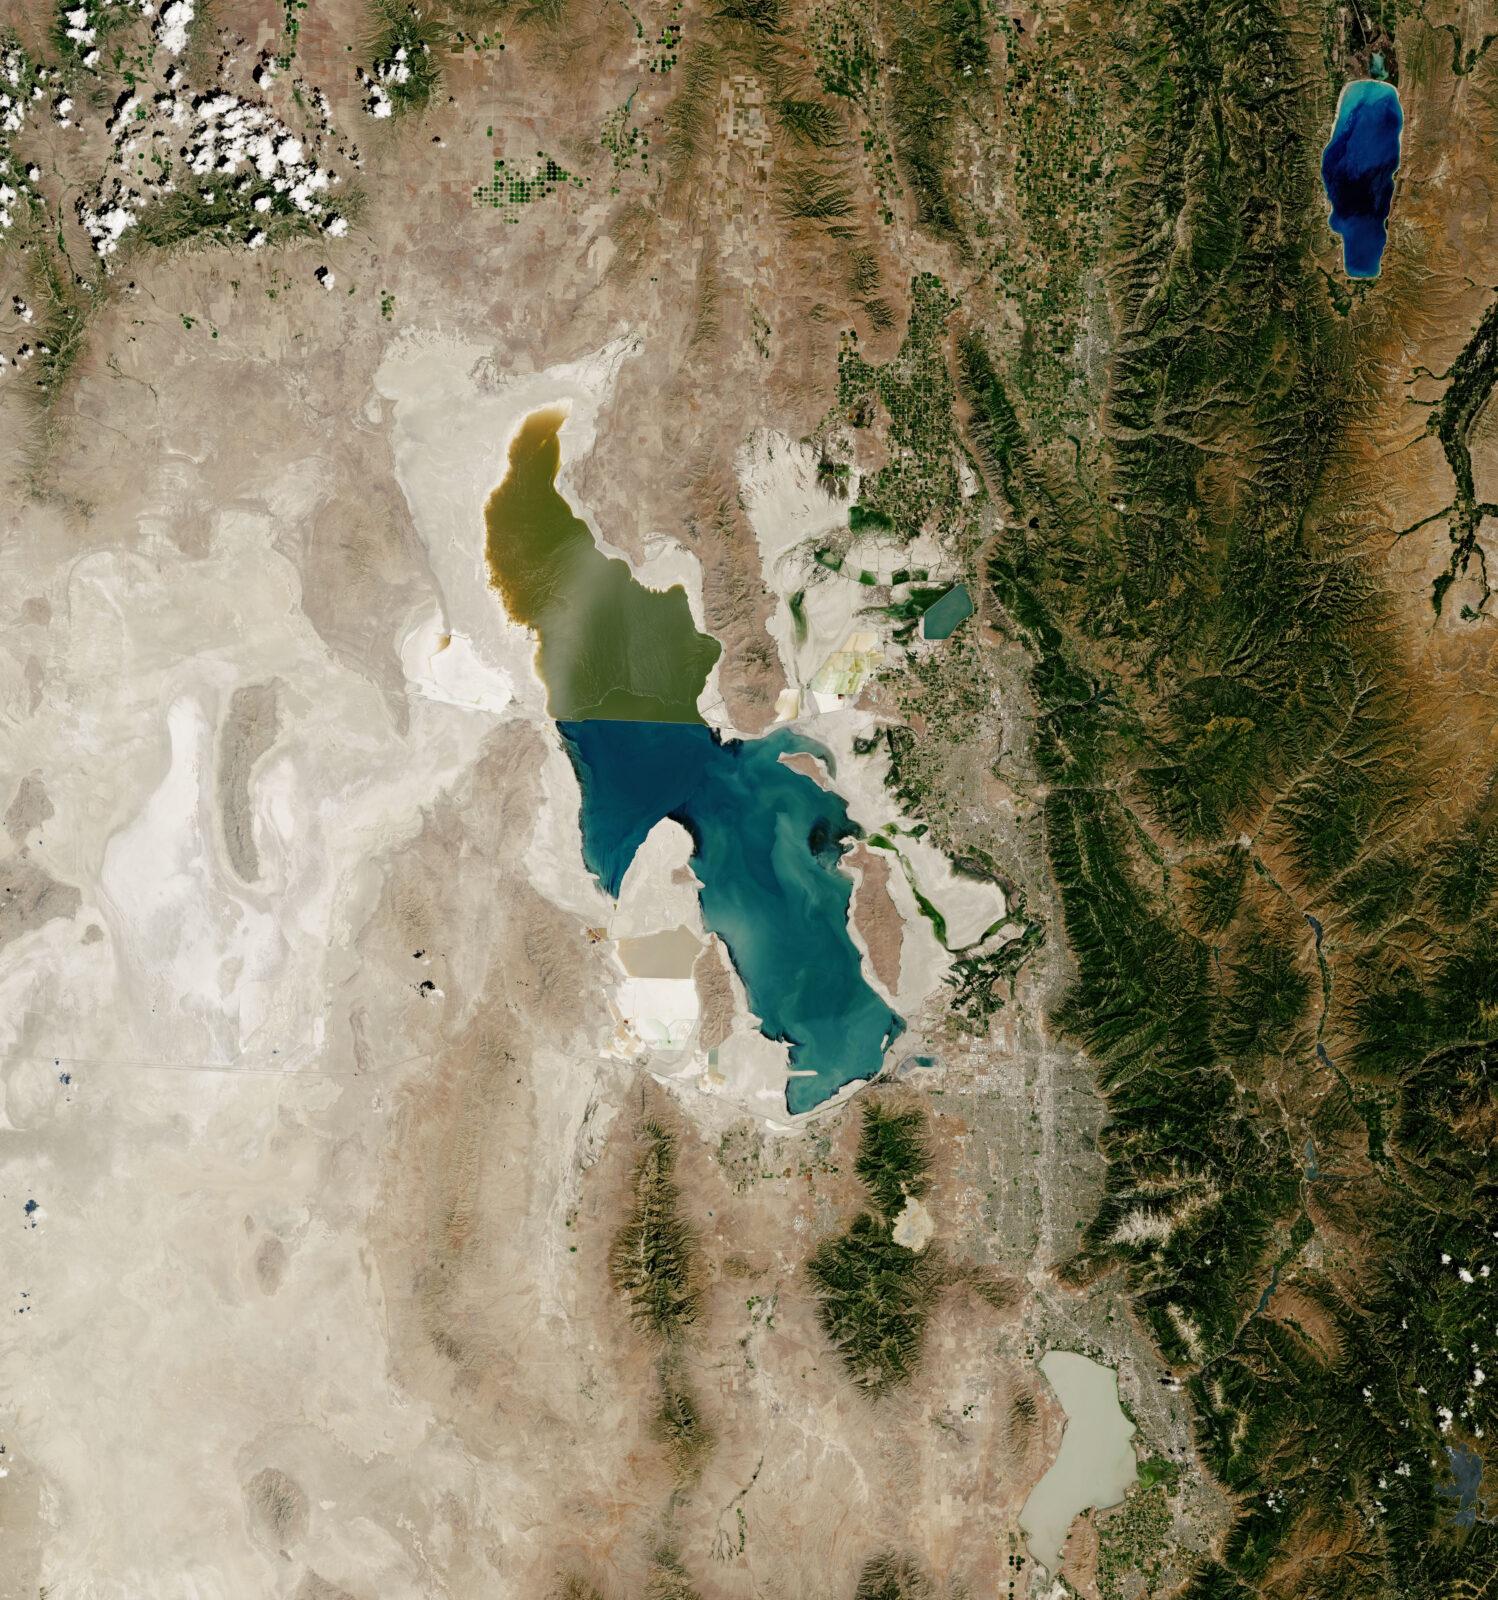
Figure 1: Comparison images from June 1985(Left) (US Landsat 5) and July 2022(Right) (Copernicus Sentinel-2). (https://earthobservatory.nasa.gov/images/150187/the-great-shrinking-lake)
What happens when the lake shrinks?
As the lake water recedes and vast portions of lakebed are exposed, the sediments including biological material, heavy mineral dust, sea salt are picked up by the winds and carried into the nearby communities. These dust particles like fine particulate matter (PM2.5) are incredibly small and can penetrate deep into our lungs and bloodstream. This deeper penetration, combined with longer exposure durations, increases the risk of adverse health effects. In addition to the well-known effects of PM2.5 on cardiovascular and respiratory health, there is emerging evidence that exposure to air pollutants may lead to neurocognitive disorders and affect mental health (directly and indirectly) through a range of potential causal pathways. The mechanisms behind these effects are complex, involving neuroinflammation and oxidative stress triggered by PM2.5 which can cross the blood-air barrier of the lungs affecting multiple brain regions. In this research, the exposure to PM2.5 is studied by defining a new term called “PM2.5 exceedance days”, which is basically the total number of days per month when PM2.5 levels exceed the 24-hour limit of 15 µg/m³, a threshold set by the World Health Organization (WHO). This threshold is based on extensive scientific evidence linking PM2.5 exposure to serious health risks, including heart attacks and premature death. Figure 2 illustrates the inverse relationship between the PM2.5 exceedance days and average lake area, where as lake area decreases, PM2.5 exceedance days increases.
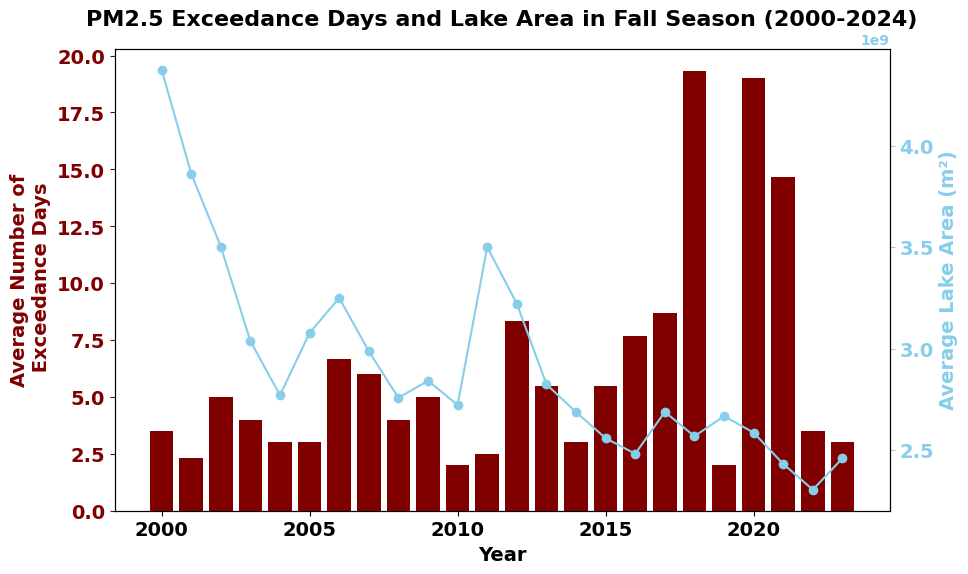
Figure 2: Relationship Between Great Salt Lake Area and PM2.5 Exceedance Days (2000-2024). Credits: Neelam, Maheshwari (maheshwari.neelam@nasa.gov)
Is PM2.5 exposure causing the depression?
The team has used major depressive episodes (MDE) to analyze the exposure of PM2.5 on mental health. This measure is used because there is a specific and clear set of symptoms that need to be satisfied for at least two weeks to be considered for MDE. Additionally, the DSM (Diagnostic and Statistical Manual of Mental Disorders) and ICD (International Classification of Diseases) are the two most widely used diagnostic systems globally which use similar criteria to ensure that there is consistency in diagnosis, research, and reporting. The research team found that there are statistically significant differences in the prevalence of MDE among different PM2.5 exposure groups. In other words, as the exposure to PM2.5 increases, the risk of developing MDE also increases. This is significantly higher in areas and periods with PM2.5 exposure is between ~12 and ~19.86 days per month.
Are certain populations more vulnerable?
People living in valleys have more reasons to dread other than winter blues. This is because valleys are surrounded by mountains, which can act like a bowl. In winter, because of cooler ground temperatures, snow cover, and clearer skies, temperature inversions occur, when the warmer air sits above cooler air near the ground. This acts like a lid and ends up trapping air pollutants like PM2.5 near the surface preventing its dispersion. This degrades the regional air quality further resulting in poor mental health. This research found that teenagers (12-17 years) and young adults (18-25 years) are more affected during the summer months, while adults (26 + years) show increased depression rates in winter when pollution levels are high, Figure 3. It is possible that the younger populations are more outdoors in the summer, exposing them to higher PM2.5, which makes them more susceptible to depression.
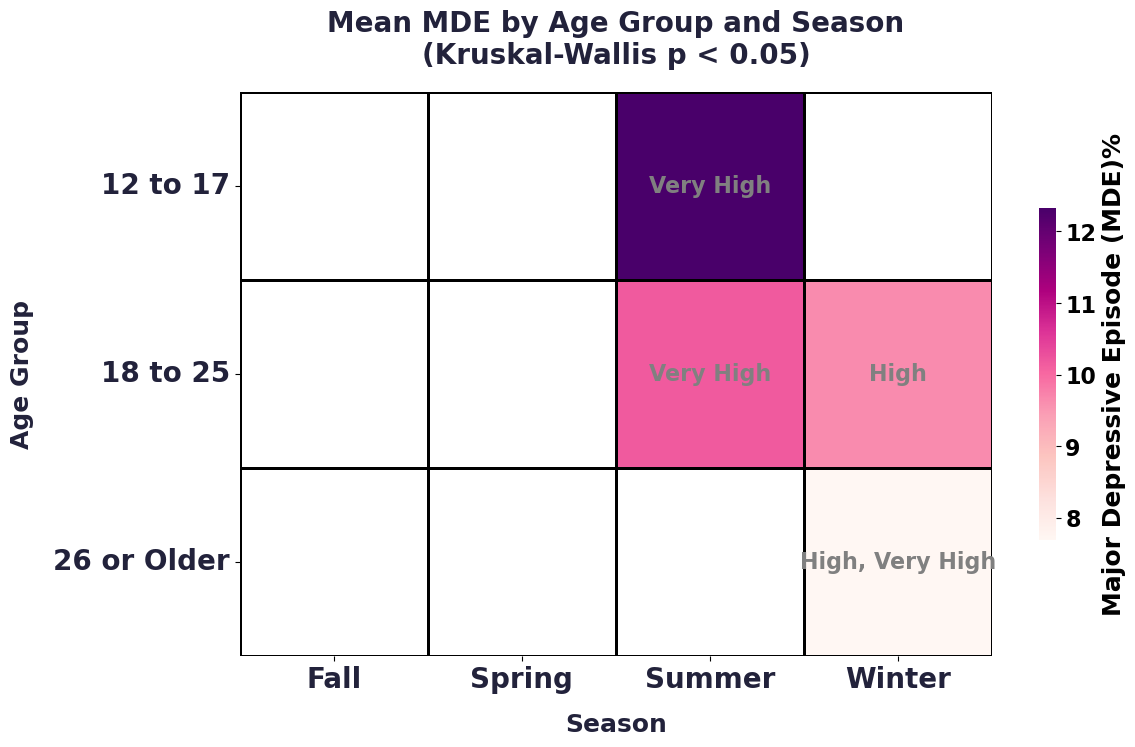
Figure 3: Heatmap showcasing the relationship between age group (left), season (bottom), and PM2.5 exposure groups (High: 12-16 days, Very High: 17-22 days) and the prevalence of Major Depressive Episode (MDE)(represented through colorbar). Credits: Neelam, Maheshwari (maheshwari.neelam@nasa.gov)
What can we do?
Targeted interventions are crucial, especially for areas and periods when PM2.5 levels are high. Seasonal preparedness is also essential specifically during winter when PM2.5 levels typically peak. Effective strategies may include issuing public health advisories, safeguarding vulnerable populations, enhancing air monitoring systems, and implementing temporary emission reduction measures during periods of high pollution.
Looking ahead: Final thoughts
This research is truly interdisciplinary bringing together different expertise and perspectives to address an urgent and complex issue. The authors highlight the the complexity of bridging the epidemiological and hydroclimatology studies with many compounding factors affecting mental health. Nevertheless, this quantitative study lays a foundational work upon which further research elements can be explored. Ultimately, the insights gained from this research should inform policies related to water management decisions while also considering the hidden economic costs associated with mental and physical health impacts from air pollution.