Imagine you’re standing on a rocky Mediterranean shore, early morning sun warming the air, the sea is calm and glassy. But away from sight and beneath that serene surface, there is a silent storm brewing. Marine heatwaves are sweeping across the basin, warming the water in ways that disrupt ecosystems, hit fisheries, and threaten everything from coral reefs to coastal livelihoods.
That’s where this story begins: on a mission led by Antonios Parasyris, Vassiliki Metheniti, Nikolaos Kampanis, and Sofia Darmaraki. Their 2025 study in EGU’s open access journal Ocean Science, titled Marine heatwaves in the Mediterranean Sea: a convolutional neural network study for extreme event prediction, tackles a burning question: can we forecast marine heatwaves days ahead using AI? Turns out, the answer is yes; and the method is as clever as it is promising.
A model that sees heatwaves coming
Picture a detective searching for clues. Instead of looking for fingerprints or footprints, the model this team built uses a specialized attention U‑Net Convolutional Neural Network (CNN), which hunts for temperature patterns invisible to the naked eye. The researchers fed it daily sea surface temperature anomaly maps and corresponding heatwave presence/absence grids from a state-of-the-art climate model, covering a period of over 30 years from 1982–2017.
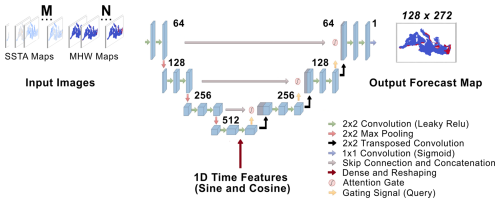
Attention U-Net CNN model architecture to forecast MHW presence/absence maps. N and M are the number of input frames containing spatiotemporal information on MHW presence/absence and SST anomaly, respectively. Each map corresponds to daily frequency of input data and has a matrix size of 128×272. The U-Net figure is adapted from Ibtehaz and Rahman (2020). Source: https://doi.org/10.5194/os-21-897-2025
But real data is messy. Heatwaves only account for about 7.7% days per year, so the team “downsampled” the maps and turned each group of four grid cells into one in order to simplify and rebalance the dataset. They boosted heatwave representation to around 14% and cut resolution to roughly 12–16 km across 128×72 grid points. Smart move? Absolutely! Less detail, but more signal, and far more efficient for a neural network to chew on.
Each input included not only a handful of recent days’ worth of temperature and heatwave data, but also seasonal context, encoded through sine and cosine signals (high school mathematics, I see you!) to tell summer from winter. Then the U-Net, enhanced with attention gates, dove in and extracted spatial patterns, filtered out noise and learned where a heatwave might emerge, 3 or 7 days from now.
The team trained the model on real-world data using a chronological split: they used the earliest years for validation, bulk of the middle years for training, and the latest ones (mid-2013 to 2017) for honest testing. By tuning hyperparameters like leaky ReLU activations (ReLU refers to Rectified Linear Unit, and it’s one of the most popular activation functions used in neural networks), dropout, focal loss, and early stopping the researchers were able to prevent overfitting, while ensuring the model learned real patterns where no memorizing is allowed.
When the water whispers, will the model listen?
Once the model was trained, it was time to see how well it could actually predict heatwaves. The model didn’t just say ‘yes’ or ‘no’ — instead, it gave a probability, a number between 0 and 1, showing how likely a heatwave was at each spot on each future day. But to make a clear decision, the researchers needed a cutoff point (think of it as a threshold) where they’d say, ‘Okay, if the probability is above this number, we’ll call it a heatwave.’
Parasyris and his team tested a bunch of different thresholds, from very low (0.05) to quite high (0.90), trying to find the best balance between two things: catching actual heatwaves (true positives) and not raising false alarms (false positives).
For predicting 3 days ahead, the scientists found the best cutoff was about 0.45. At that point, the model was right about 89% of the time. For predictions 7 days ahead, the best cutoff was around 0.40, with accuracy dropping to about 77% (which is still pretty good!). If they set the threshold too high, the model became too cautious: it avoided false alarms but missed many real heatwaves.
The next step was checking how different pieces of information affected the results. The model worked best when it had about 10 days of past temperature changes and 2 days of recent heatwave data to look back on. This gave it high scores for both catching heatwaves and avoiding false alarms. But if they left out the recent heatwave information, the model’s performance dropped significantly, which shows that knowing the recent ‘history’ really helps the prediction.
AI vs. yesterday’s weather
It might seem easy for the AI model to look good. After all, what if you just guessed that tomorrow’s conditions will be the same as yesterday’s? That’s called the ‘persistence benchmark’. It’s like saying, ‘No big changes, things will stay as they were’. For predicting heatwaves 3 days ahead, this simple guess was already pretty good, catching about 84% of actual heatwaves. But the AI model still did better as it caught about 88% of upcoming heatwaves. Not a huge leap, but definitely a clear improvement.
Where the model really shines is when you look further ahead: 7 days into the future. Here, the simple guess drops to about 65% accuracy, but the predictive model returns closer to 76%. That’s a meaningful difference; imagine getting several extra days of warning to prepare fishers, conservationists, and coastal communities for an upcoming marine heatwave. Those extra days could save ecosystems and livelihoods.
The researchers double-checked their results with something called a confusion matrix, which basically counts how often the model gets it right or wrong. For 3-day forecasts, the AI got it right about 88% of the time for actual heatwaves, and correctly said “no heatwave” about 89% of the time. For 7 days ahead, the numbers dropped (76% and 79%) but still beat the simple guess.
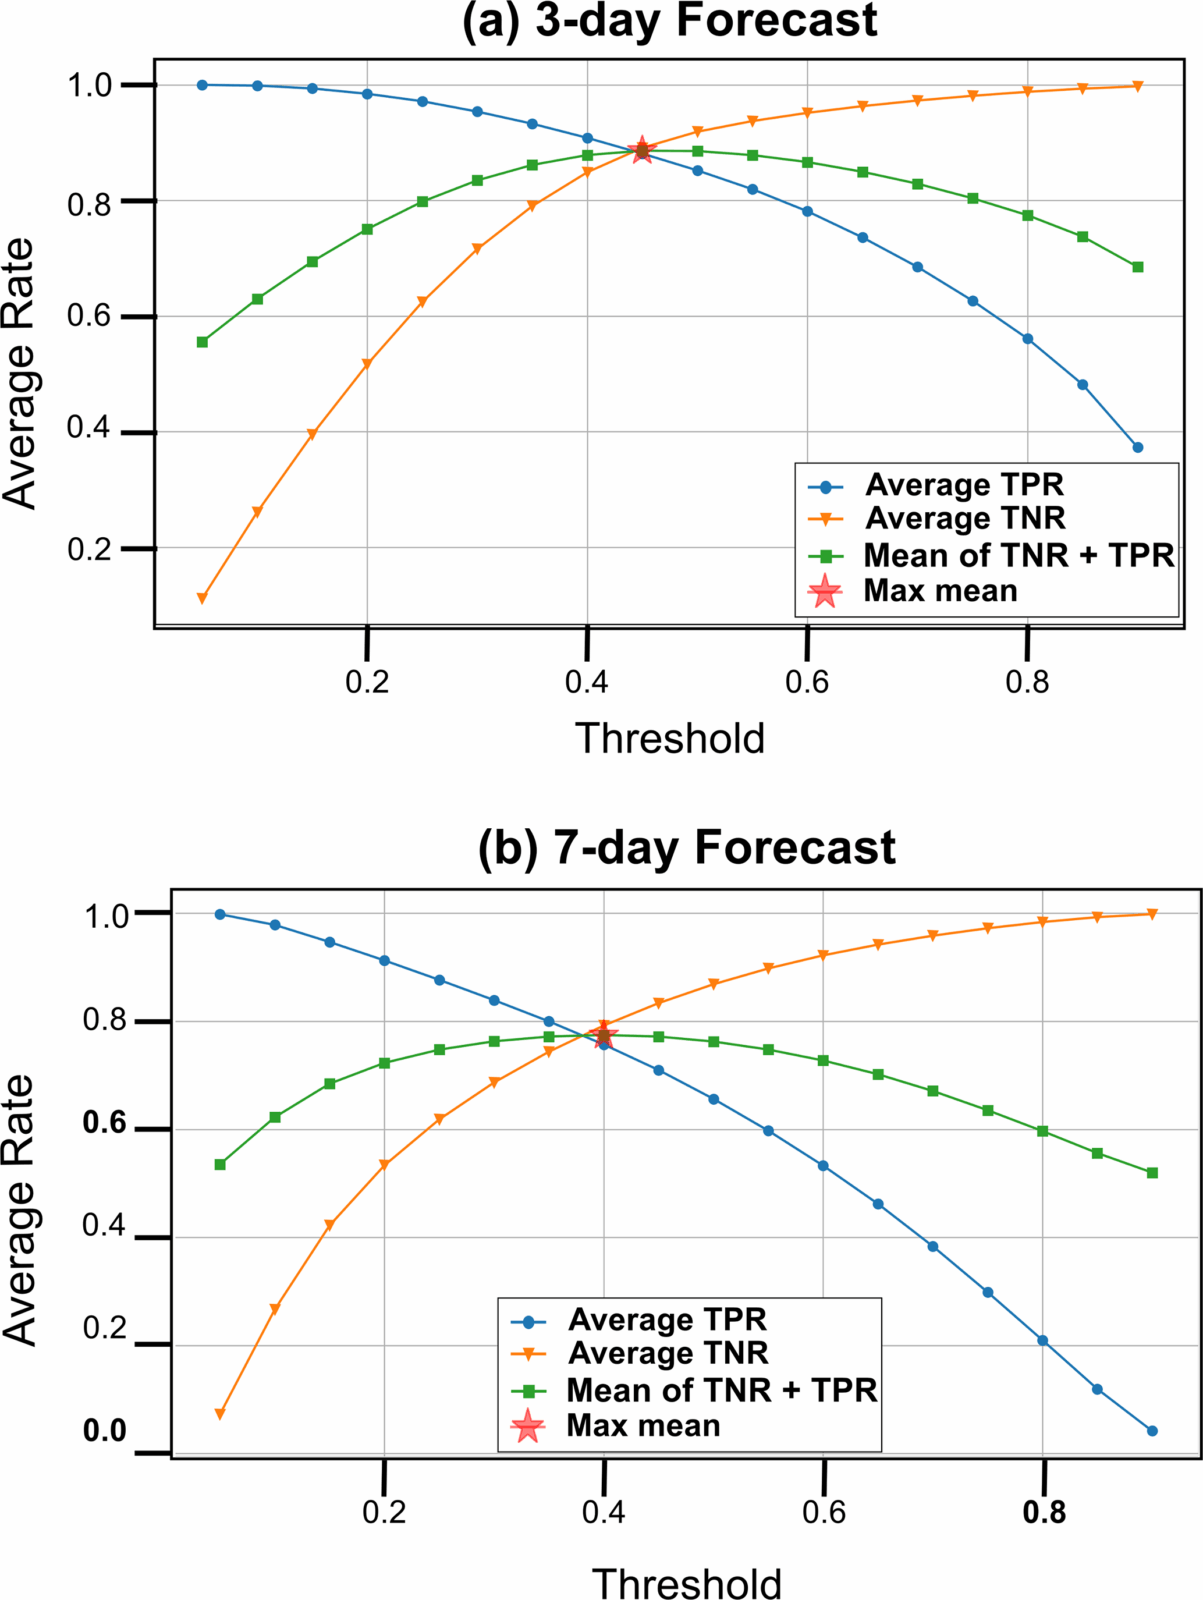
Threshold selection for the (a) 3 d and (b) 7 d forecast scenario based on the maximization of the combined mean (green line) of TPR (blue line) and TNR (orange line). The threshold increments range from 0.05 to 0.9, and the maximal point is indicated by a red star. Source: https://doi.org/10.5194/os-21-897-2025
Finally, the team looked at a graph comparing how much heatwave area the model predicted versus what actually happened. For 3 days, it matched almost perfectly: 99%! For 7 days, it was still very good (around 87%). This shows that the model isn’t just lucky; it’s reliably predicting where and when these heatwaves occur.
Coastal curveballs and cooling contemplations
Maps of forecast accuracy revealed a curious pattern. In open basins like the Ionian, Northwest Mediterranean, and Levantine, the model scored above 90% for 3-day forecasts, and even 80–92% at 7 days. But coastal hotspots like the Aegean, Balearic, and Alboran seas lagged behind. Why? These areas feature complex currents, uneven seafloor topography (yes! seafloors have variable terrain just like land does!), and abrupt temperature swings that get scrubbed out in downsampling.
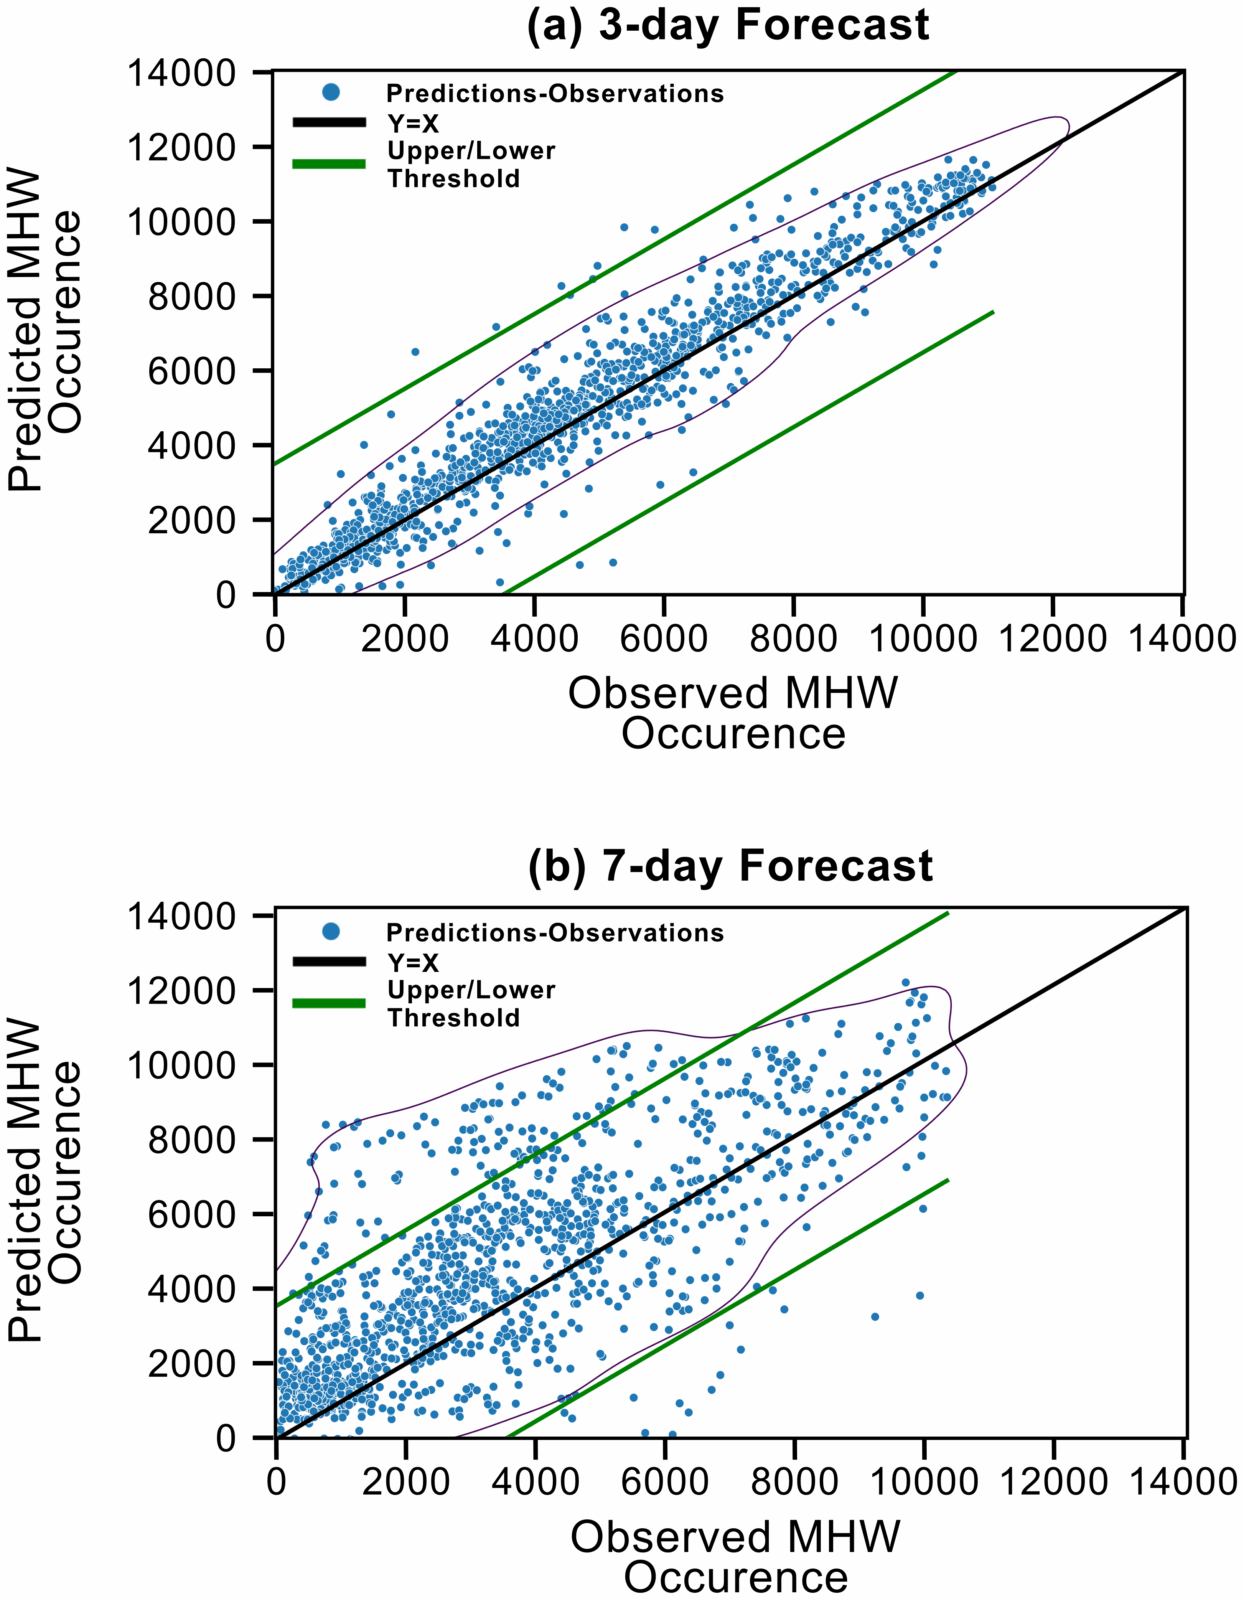
Scatter plots of the total number of observed (x axis) vs. predicted (y axis) points classified as MHW present (blue dots) per sample, for the (a) 3 d and (b) 7 d forecast throughout the entire testing dataset spanning mid-2013 to 2017. The upper and lower thresholds of 3500 points (green lines) are introduced for comparison purposes. Source: https://doi.org/10.5194/os-21-897-2025
Even if the model struggled, the results are promising. With better resolution, the inclusion of wind and other atmospheric variables, and perhaps a hybrid model tying machine learning to physics, those coastal wrinkles could be smoothed out.
The takeaway: this attention-U‑Net CNN is quickly becoming an ocean’s best friend. It’s a fast, efficient, and accurate forecaster of marine heatwaves. Just a few seconds of inference to analyze years of data and predict extreme events days in advance? That’s ocean science turned on its head. Much like a beach-goer with a surf forecast, this tool could alert fisheries, inform protected-area managers, and even help coastal businesses prepare for thermal shocks. And because it’s built on minimal seas (just past temperature anomalies and heatwave presence) it’s not only fast but also adaptable: train it on data from the Caribbean, the Pacific, or the Arctic, and off you go.
What lies beneath and beyond
Taking the study a step further, the authors had the courage to test it: training on older data vs. more recent data. For 7-day forecasts, training on the latest years improved skills, because recent patterns matter as heatwaves intensify. For 3-day forecasts, older data actually helped better, which reminds us that short-term memory spans long-ago events just as well as recent ones.
Computationally, they trained on eight NVIDIA A100 GPUs for four hours per experiment, but forecasting 1,300 days post-training took only a minute. That kind of efficiency is a game-changer, especially for real-world applications. Moving forward? Add wind, down-sample less, maybe include satellite feeds or ensemble and physical constraints. The architecture is flexible. A bit more data, a bit more power, and suddenly you’ve got global-scale ocean heatwave forecasts at your fingertips.
Why this matters (not just for tourists and beach lovers)
Marine heatwaves aren’t just about warmer water: they’re frontline climate change events, hitting fragile ecosystems and communities hardest. These extreme bursts of ocean heat destroy habitats, disrupt fisheries, and threaten the livelihoods of people who depend on the sea. Being able to predict these heatwaves even a week in advance means we can issue early warnings, protect vulnerable ecosystems, and support the communities at risk before disaster strikes. Think of it as a way to care proactively, not reactively. Thanks to the work of this brilliant team, the Mediterranean—and soon other regions—will have better tools to listen to the ocean’s warnings and respond with care and urgency.
So, next time you hear “the ocean is heating up,” remember there’s more than just a temperature rise at stake. Behind the scenes, scientists are developing clever algorithms to give vulnerable communities a fighting chance to adapt and survive in a changing world.