Today’s guest post comes from Michelle Cain, postdoctoral researcher at the University of Cambridge, United Kingdom.
Almost a whole day’s worth of sessions on megacities – where to begin? I certainly couldn’t pick just one talk to write about, so here’s a mish-mash of the session in general and a few talks in particular.
First things first: what is a megacity? Officially defined (by who, I don’t know) as a city of 5 million people or more, there are only two of them in Europe (London and Paris), and both are among the most polluted cities in Europe. There are other European places that embody megacity characteristics without adhering to the strict definition, so the MEGAPOLI project has focused on two of these alongside the two bona-fide megacities. The Po Valley in Italy, surrounded by mountains on three sides, is populated by 16 million people and contains 37% of the country’s industry. The mountains disrupt the large-scale meteorology so that local winds are often slack, which combines with the high levels of industrial, agricultural and residential emissions to cause worse air quality than in either Paris or London.
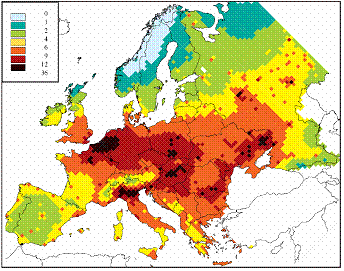
Loss in life expectancy (months) attributable to exposure to anthropogenic PM2.5 for year 2000 emissions (Source: EC, IIASA)
The air quality is similarly poor in the Rhine-Ruhr valley in Germany, an industrial region with about 10 million inhabitants. This region suffers not only from local emissions, but often from pollution transported from London, Paris and the Netherlands in the prevailing winds. (Thanks to the MEGAPOLI website for the info about these locations).
The reasons why these non-megacities have been brought into the fold highlight the complexities of trying to understand what might happen in the coming years as the world becomes increasingly urbanised. It’s not only the amount of stuff being pumped into the atmosphere that causes air quality issues. It’s equally how much stuff gets vented out of the boundary layer (the lowest layer of the atmosphere, where people live), and how much gets washed out in rain. And what happens to the stuff before it gets removed? And this is not even considering the climate impacts of all this stuff is getting higher up into the atmosphere, where it has a longer lifetime and can be transported long distances, potentially also affecting air quality downwind. All these interactions could be broadly categorised into: emissions, boundary layer meteorology, deposition, chemistry, global transport, and climate.
Several talks in the session were related to emissions evaluations, as how can we hope to understand anything if we’re putting the wrong amount of stuff into the atmosphere? Any by “stuff”, I mean NOx (the sum of NO and NO2, which are pollutants emitted from both anthropogenic and natural sources, and can react to produce ozone, which has adverse health effects) and particulates (the shorthand for particulate matter is PM2.5/PM10 for those with a radius less than 2.5/10 microns, also bad for health), as these were the main topics in the session.
Generating emissions inventories is no trivial task, as is evidenced by the continual work going in to this area. In his talk, S Sahu described the development of an emissions inventory for Delhi and the surrounding areas, which is home to a staggering 30 million people in an area of 70 km x 65 km. For 6 months, an army of 250 students surveyed the residents and businesses to determine a sample of the emission-generating activity in the region. They combined this new data with the existing literature and government statistics to develop a GIS-based emissions inventory. Their results showed that there are 5.7 million vehicles on the roads, and 1.5 million living in slums and cooking with wood, kerosene or LPG (in order of decreasing precedence). The PM2.5 emissions total was 68.1 Gg/year, the largest portion of which was from transport at 30.25 Gg/year. Wind-blown dust and residential emissions were also large contributors. The inventory was used to forecast for the Commonwealth games in 2010 and is currently available for both science and policy uses.
Policy issues were the driver behind R Friedrich’s talk, which directly addressed questions of whether air quality policies could result in the desired policy outcome – surely an important factor in decision-making. As part of the EU MEGAPOLI project, his work took a “full chain approach”, whereby the scenario with and without the policy measure was modeled to determine the effectiveness of a policy. The reference scenario assumes the current EU energy and climate package was taken forward. Then each policy was added to the model, and the difference can be described in monetary terms or by DALYs (disability adjusted life years).
The study generated some surprising results. Twenty four policy measures were ranked in terms of avoided DALYs for Paris, and the best measure by this metric was to change to efficient combustion of gaseous fuels (which generate less PM than wood), followed by biomass fuels. However, different metrics paint a different picture. Calculating the efficiency of each measure in monetary terms put coke dry quenching (as opposed to wet quenching which generates PM) in the top spot, followed by use of biofuels, use of district-wide heating networks, an aviation kerosene tax and a switch to electric vehicles. The least efficient measure was a passenger car toll (which, for example, London has had since 2003). Interestingly, the implementation of a low emissions zone was shown to have a negative or neutral effect. On the other hand, the speaker recommended the improvement of traffic management as an efficient measure.
Another EU project, CityZEN, also linked the science with policy needs by producing some 2 page policy briefs on ozone, PM, observations and the East Mediterranean air pollution hotspot, and was discussed by several speakers. Other talks and poster covered the links between meteorology and chemistry, observations and models, but I’m afraid this is all I have time for… See you next time, on the GeoLog.
By Michelle Cain, University of Cambridge

