The Earth’s primary energy source is the radiative energy flux (i.e., the Total Solar Irradiance, TSI) from the Sun. Understanding the TSI or the solar irradiance output in particular wavelengths is important, as it is crucial for sustaining life of metabolisms on Earth and in answering the question of how life emerged on Earth. It has been shown that magnetic activity on the solar surface is one of the main causes of solar irradiance variations. Manifestations of the magnetic activity are seen as bright faculae and darks spots. While during the 11-year solar cycle the activity in terms of spots is gradually increasing, the Sun, paradoxically, is brightest during highest activity level, meaning that it is faculae dominated. Observations present the conundrum, that the facular-to-spot area ratio is decreasing with increasing activity level. In a recent letter (Nèmec et al. 2022) we provide a physical explanation for this conundrum and show, that a very active Sun could indeed be spot dominated.
Obtaining faculae and spot area coverages
Obtaining information on magnetic activity from other stars is often only possible indirectly due to changes in their brightness in different wavelength passbands, depending on the instruments used. For the Sun however, due to its proximity, we do not only have temporal information in form of changes in the TSI, but we can directly observe the magnetic features on its surface.
In our modelling approach, we started by modelling the emergence of active regions based on measurements of solar cycle 22 (Jiang et al., 2011a) and ran a Surface Flux Transport Model (SFTM — Işik et al., 2018) to obtain daily surface distributions of the magnetic field. This distribution was then converted in facular and spot areas (Nèmec et al., 2020). Using an SFTM is necessary to our approach, as in order to model higher activity levels, we proceed to fill the surface of hypothetical stars with more active regions.
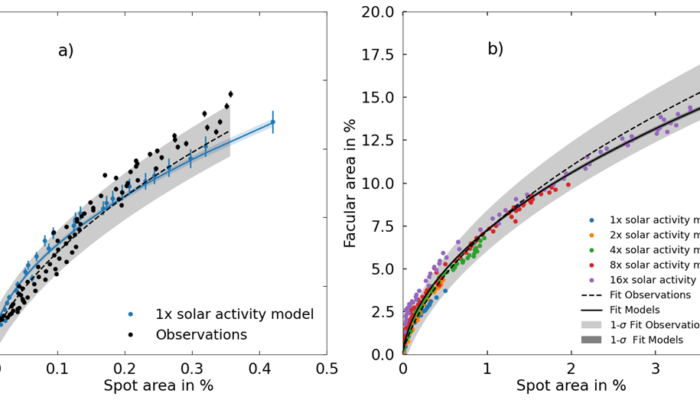
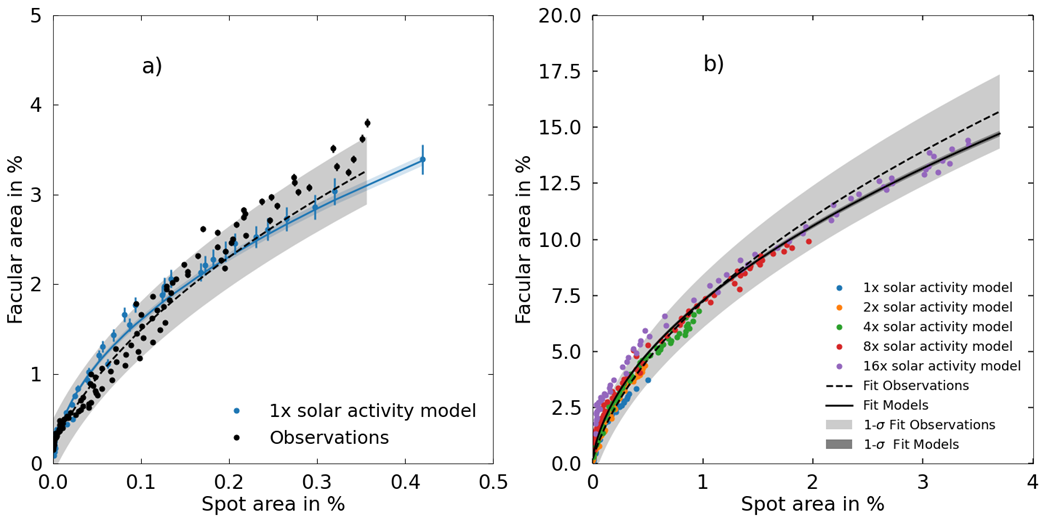
Fig. 1 a shows that our calculations nicely follow the observed trends in facular areas as a function of spot areas. Fig. 1 a) already shows the drop in facular-to-spot area ratios, we extended our modelling to higher activity levels. While doing so, we preserve the underlaying solar 11-year activity cycle and the latitudinal distribution observed on the Sun. As evident from Fig. 1 b) the modelled dependencies follow the extrapolated empirical trends to even higher activity levels.

Fig. 1: Dependence of facular disc area coverage as a function of the spot areas. Panel a) gives the comparison between our solar activity model (blue) and the observed distribution on the Sun (black). Vertical bars represent the error bars. Panel b) shows the calculations for various activity levels compared to an extrapolated fit (black dashed lines) to the solar observations. Shaded areas in both panels give the 1-sigma uncertainty of the fits. (Figures adapted from Nèmec et al., 2022).
Verifying the model against stellar observations
Solar observational records of sunspot show that the Sun has not experienced high level of activity as we consider in this work, so we resort to observations of Sun-like stars to verify our model. Unfortunately, only some indirect measurements of spot coverages of solar-like stars are available, and there is no reliable technique to measure facular coverages. We therefore opt to use a proxy of magnetic activity. The chromospheric emissions in the CaII H & K lines are often used as such a proxy, as emission is depending on magnetically induced heating. Simultaneous observations of stellar chromospheric emissions in the CaII H & K and stellar brightness in the visual wavelength regime (most prominently in the Strömgren b and y filters, centred at wavelengths of 467 and 547 nm, respectively), revealed a distinction between active young and less active old stars like our own Sun (Lockwood et al., 2007; Radick et al., 2018).
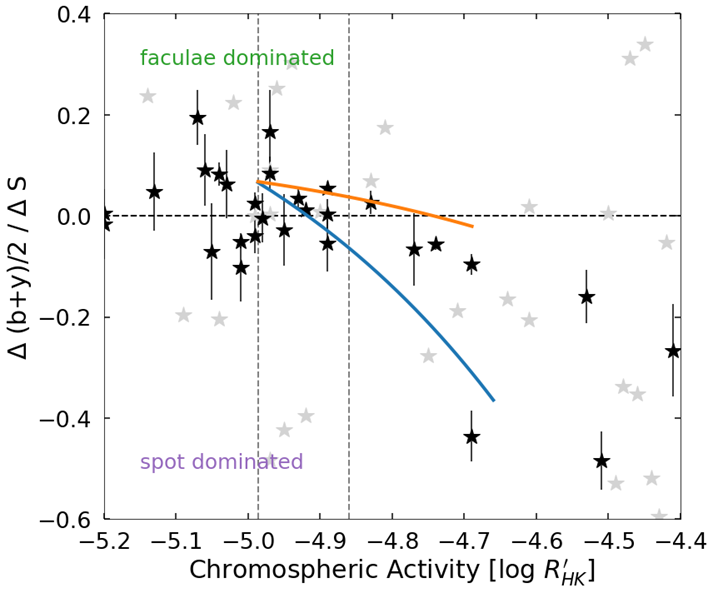
We use the obtained distribution of faculae and spots as shown in Fig. 1 b to calculate the brightness variations in Strömgren b+y (Nèmec et al., 2020) and the chromospheric variability in CaII H & K expressed via the S-index (Sowmya et al., 2021) for each simulated activity level. We combine those individual timeseries to a 55-year time series. Next, we calculate the slope between the changes of stellar photometric brightness and the S-index over the course of the magnetic activity cycle, Δ[(b + y)/2]/ΔS, similar to what has been done to stellar observations. In this metric, stars that are faculae dominated, like the Sun, have a positive value, while stars for which photometric brightness and chromospheric emission are anti-correlated have a negative slope value. This finally allows us to compare our calculations to observations, as shown in Fig 2. We like to focus on the black stars in Fig. 2, which represent the Lowell and Fairborn measurements (Radick et al., 2018) of stars with effective temperatures ±200 K around the solar value (5777 K). Considering two extreme cases of stellar inclination of our model (blue indicating 90 degrees, corresponding to an equatorial observer and 0 degrees, corresponding to an observer that looks at the pole of the star), we find that our model can capture the transition between faculae and spot dominated well.

Fig. 2: Change of photometric brightness as a function of the chromospheric emission (Δ[(b + y)/2]/ΔS) plotted against the mean chromospheric activity expressed through log R¢HK. The blue and orange solid lines represent the modelled dependencies for i = 90° and i = 0° (see text), respectively, while asterisks show the Lowell and Fairborn measurements (Radick et al., 2018). Black asterisks indicate stars with effective temperatures ±200 K around the solar value (5777 K). Gray asterisks depict the rest of the Lowell and Fairborn sample. The dashed horizontal lines depict the dividing line between faculae and spot dominated stars, and the two vertical grey dashed lines indicate the minimum and maximum values the solar activity calculations used in this work. (Adapted from Nèmec et al., 2022)
What could be a possible cause for the switch from faculae to spot dominated?
The ability of our model to explain the observational data allows to take the next step to describe the physical mechanism that causes the decrease of facular-to-spot ratios with increasing activity level. The facular-to-spot ratio observed at a given time depends (1) on the ratio of faculae-to-spots in newly emerged active regions and (2) on the decay rate of previously formed active regions. With our simple scaling of the activity level, we preserve (1) even towards higher activity levels, which means that (2) needs to be investigated further. While spots linearly decay in size and are generally smaller in area (as seen in Fig. 1), the flux tubes associated with faculae cover larger areas, with a higher chance of encounters of opposite polarities. Those opposite polarity encounters are eventually responsible for the evolution and lifetime of the faculae.
With increasing activity level, the surfaces of stars are filled with more magnetic flux elements associated with faculae, which results in more efficient flux cancellation, resulting in a shortening of the facular lifetimes. Therefore, a more efficient cancellation of the facular flux leads to a drop in the facular-to-spot ratio. We note that within the model, flux associated with spots can also cancel out, however due to the smaller sizes and shorter lifetimes (compared to the faculae) this barely occurs.
Implications of our work
Our work clearly highlights the understanding of the facular contribution to the variability on various timescales and its different imprints (for instance in photometry, radial velocity, or spectroscopy) for inactive stars, like the Sun. Understanding and especially physically accurate modelling for the facular component of variability for those stars is especially important, as they are the main target for planet hunting and atmospheric characterisation missions, where it is crucial to remove the contamination of the planet’s signal by stellar activity.
References
Işik, E., Solanki, S. K., Krivova, N. A., & Shapiro, A. i. 2018, A&A, 620, A177
Jiang, J., Cameron, R. H., Schmitt, D., & Schüssler, M. 2011a, A&A, 528, A82
Lockwood, G. W., Skiff, B. A., Henry, G. W., et al. 2007, The Astrophysical Journal Supplement Series, 171, 260
Nèmec, N.-E., Shapiro, A. I., Is ̧ık, E., et al. 2022, The Astrophysical Journal Letters, 934, L23
Nèmec, N. E., Shapiro, A. I., Krivova, N. A., et al. 2020, A&A, 636, A43
Radick, R. R., Lockwood, G. W., Henry, G. W., Hall, J. C., & Pevtsov, A. A. 2018, The Astrophysical Journal, 855, 75
Sowmya, K., Shapiro, A. I., Witzke, V., et al. 2021, The Astrophysical Journal, 914, 21
