March 2021 was a busy month for Geoscientists from the seismic sequence in Iceland and their apparent migration towards the emergence of the new volcano Fagradalsfjall, the onshore, shallow earthquake M6.3 in Thessaly (Greece) on March 3rd (the largest in Europe during 2021), and other major shallow earthquake M6.0 in Algeria on March 18th. For this EQ-Watch we focus on the seismic sequence in New Zealand and the Kermadec Islands, with three principal actors that caught the attention of Earth Scientists around the world.
This trilogy started on March 4th at 13:28 (UTC) with an M7.3 earthquake that occurred off the East Cape in New Zealand. No clear foreshock activities were reported (the last event was a shallow M4.3 on February 21st). Four hours later, two earthquakes M7.4 and M8.1, hit the Kermadec Islands, with both events close to each other and separated by less than 2 hours. Since then, the aftershocks of this sequence (Figure 1) have been compared with the Chilean earthquake in 1960 or Japan in 2011. Several seismic stations at teleseismic distances recorded these events, but the near-field source of this earthquake cannot be recovered due to their location.
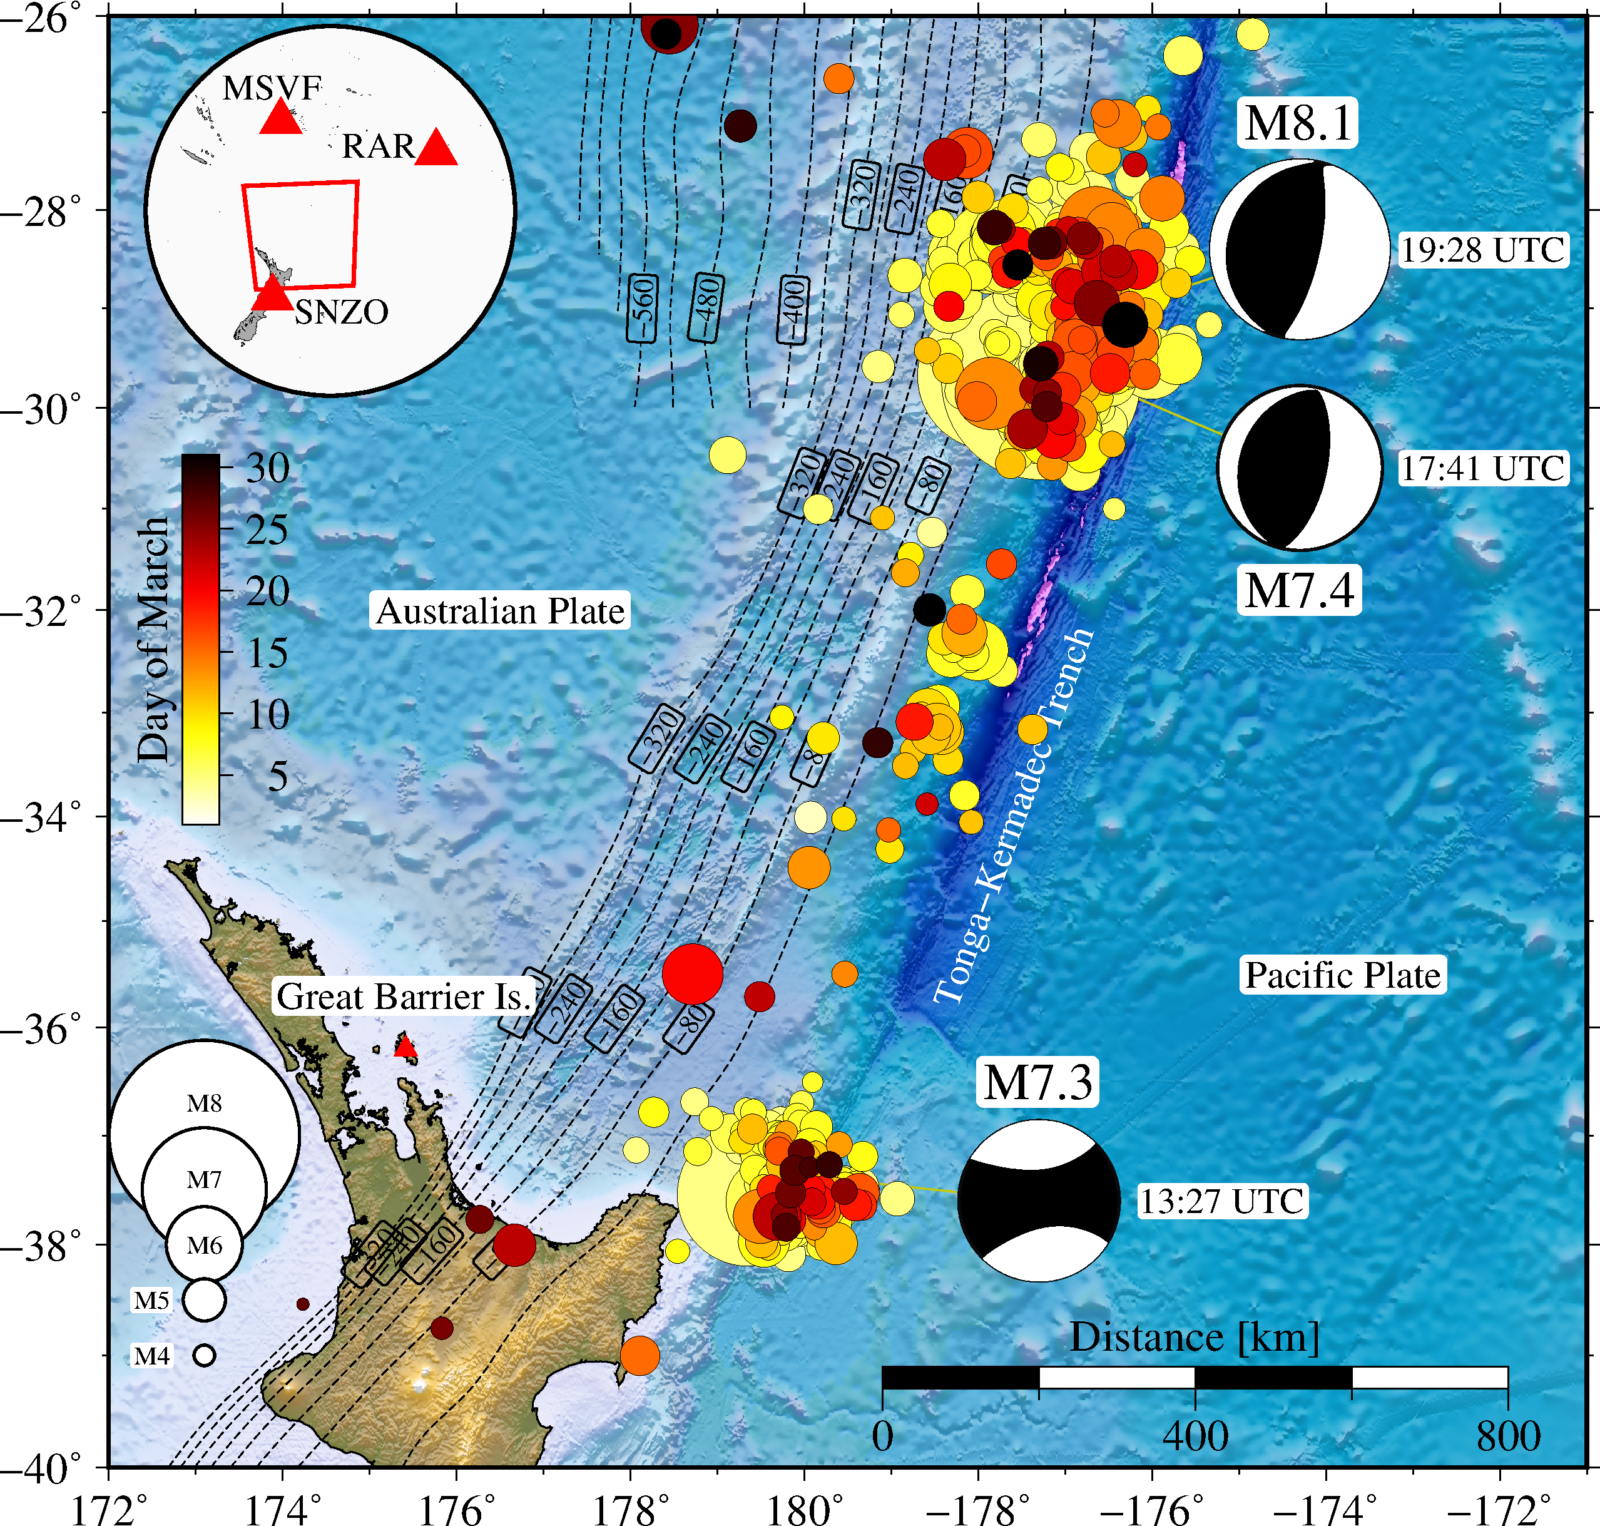
Figure 1 | Location of the New Zealand and the Kermadec Islands seismicity during March (USGS catalogue, see colour bar depending on time). Focal mechanism calculated by GCMT are plotted for the main events occurred on May 4th: M7.3 at 13:27 UTC, M7.4 at 17:41 UTC and M8.1 at 19:28 UTC. Inverted red triangles indicate seismic stations (MSVF, RAR, SNZO) and tsunami gauge (in Great Barrier Island).
The closest instruments located in Raoul Island (1000 km to Auckland) only recorded the first event. Fortunately, the stations around the Pacific Ocean like MSVF, RAR, or SNZO could record the full sequence (Figure 2).
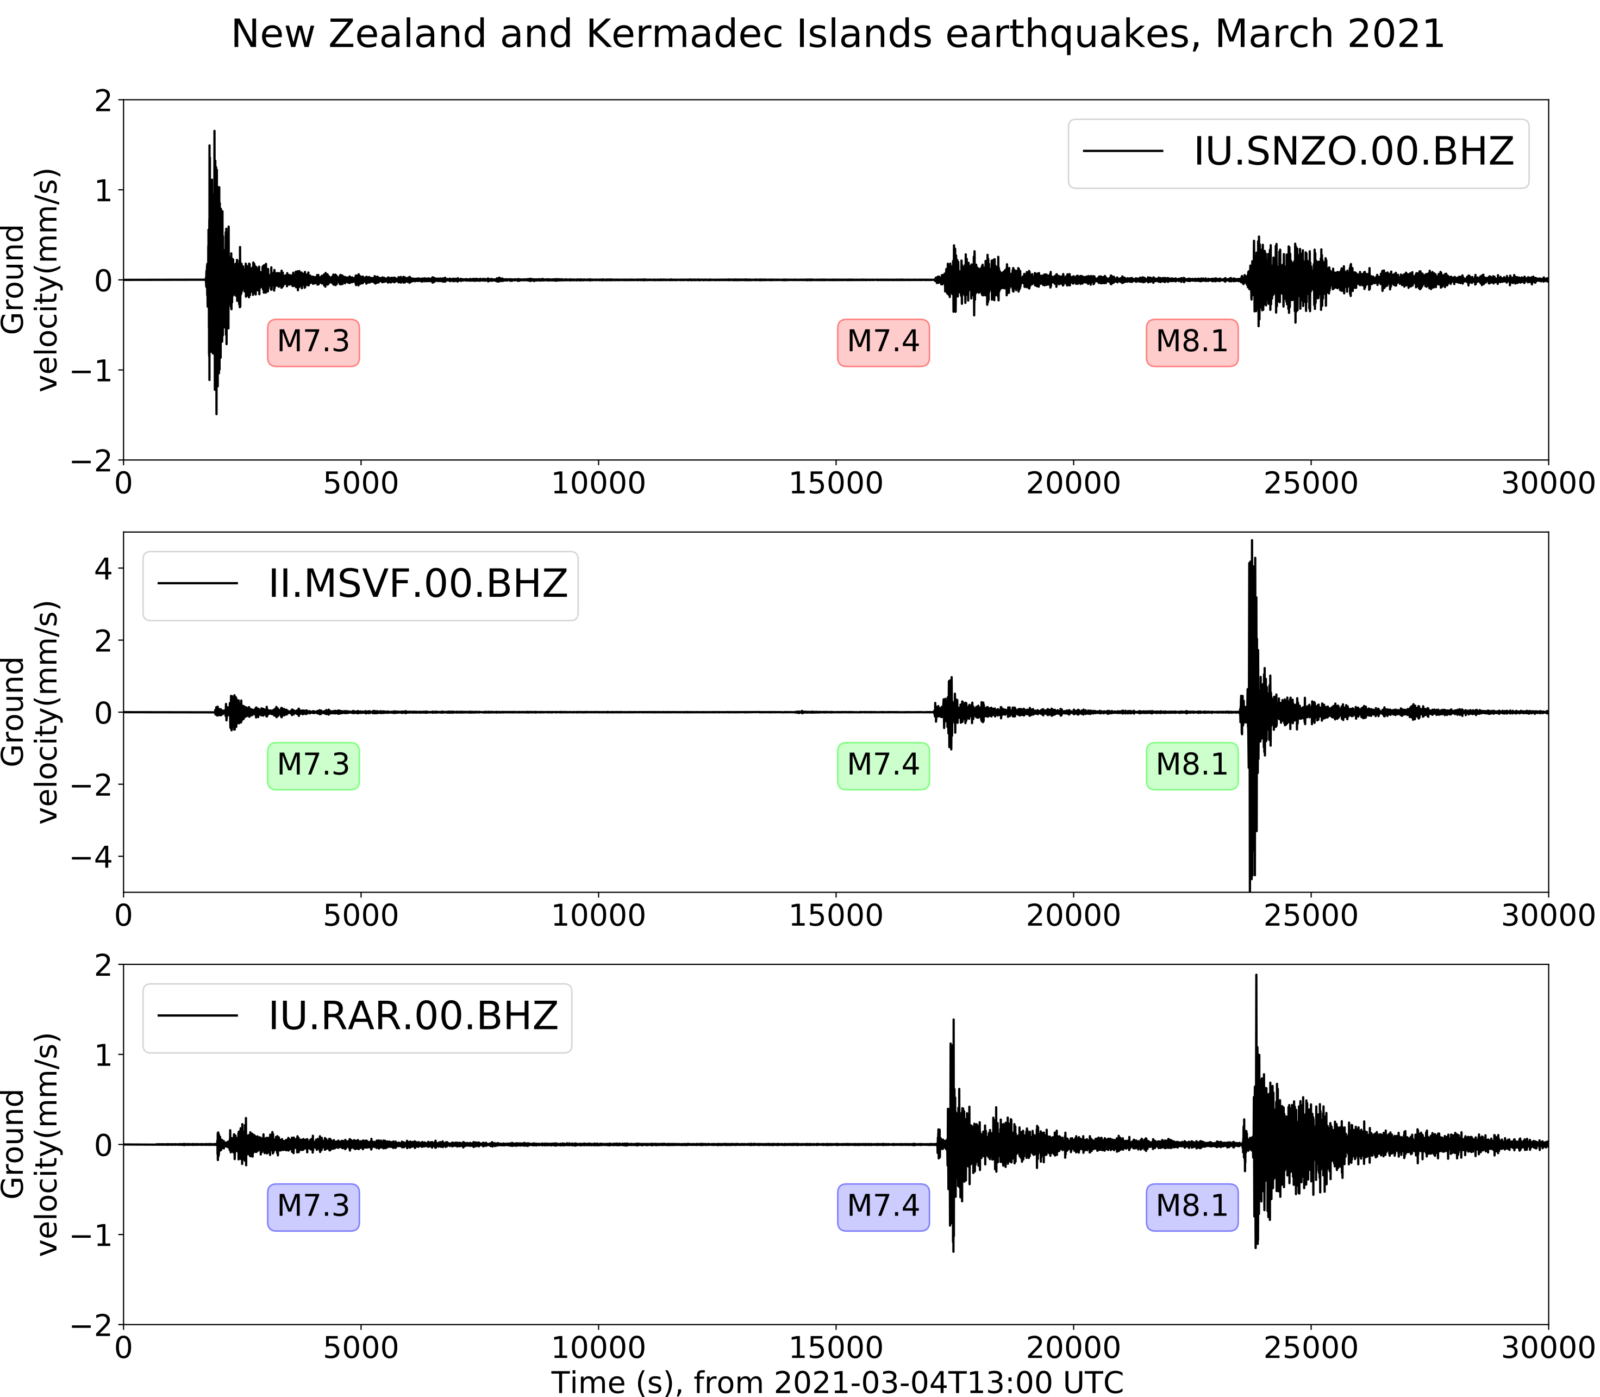
Figure 2 | Seismic record in stations SNZO (South Karori, NZ), MSVF (Monasavu, Fiji) and RAR (Raratonga, Cook Is.) for earthquakes M7.3, M7.4, M8.1 in New Zealand – Kermadec Islands.
The first event occurred in a complex region of transition from the Hikurangi Trench into the Tonga-Kermadec Trench, which involved the East Cape Ridge (Basset et al., 20101). The first shock struck in the middle of these main tectonic features and was felt by over 52,000 people in New Zealand (hereafter NZ; Geonet). Analysing the coseismic deformation patterns across northern NZ, we see that this region was pushed about 1 cm to the SW (Figure 3a). Besides, the early analysis of seismic waves suggests a complex source like the Kaikoura earthquake in 2016 (M7.8), in which multiple faults were involved (e.g., Zhang et al., 20173).
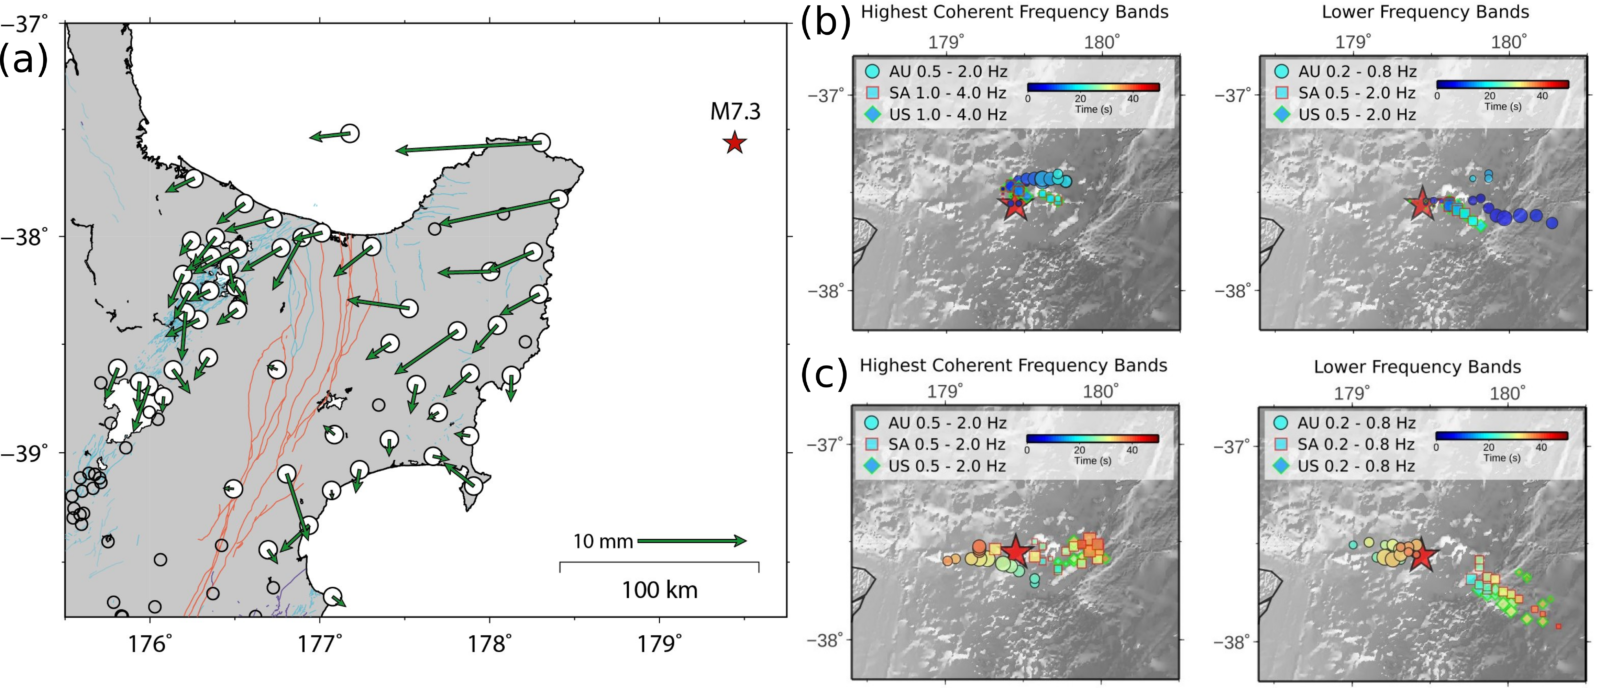
Figure 3 | (a) Coseismic displacements from the M7.3 earthquake. Scale in mm. It is based on the six hours of data before the M8.1. Credits: Sigrun Hreinsdottir @gpsRuna. (b, c) High-resolution back-projection results for the M7.3 earthquake using vertical broadband (BHZ) and high-gain (HHZ) records. (b) Sub-event 1 (0-20 sec), (c) Sub-event 2. AU: Australian network (109 stations), SA: South-American network (166 stations), US: United States network (410 stations). Credits: Han Bao @HanBao_UCLA.
This observation can explain differences in focal mechanism from different agencies (Figure 1) that joint two earthquakes that occurred short-distance apart and separated by just a few seconds (Geonet). Preliminary results from Han Bao (UCLA) using teleseismic back-projection to discriminate the difference in seismic waves behaviour show at least the presence of two sub-events. Sub-event 1 (Figure 3b) was a thrust earthquake at depths 60 to 90 km in the first 10-20 seconds, dipping with along-strike and along-dip propagation. Sub-event 2 (Figure 3c) was a shallow event at depths around 20 km, with normal fault dipping NW. Although the strange characteristics of the first event (M7.3) opened scientific discussions, most of them agree with a multiple-fault rupture or/and complex and energetic coda waves to explain the recorded data.
The second event occurred more than 900 km north of the first quake (see Figure 1). This earthquake had a reverse-faulting mechanism at ~40 km depth (Figure 4). Coseismic slip distribution models show a single asperity with a maximum slip of 3 m that ruptured during ~23 seconds (Figure 2). A deep event in the megathrust likely triggered the third event of this trilogy, something observed in other seismic sequences like the 1960 Chilean earthquakes (e.g., Ojeda et al., 20202).
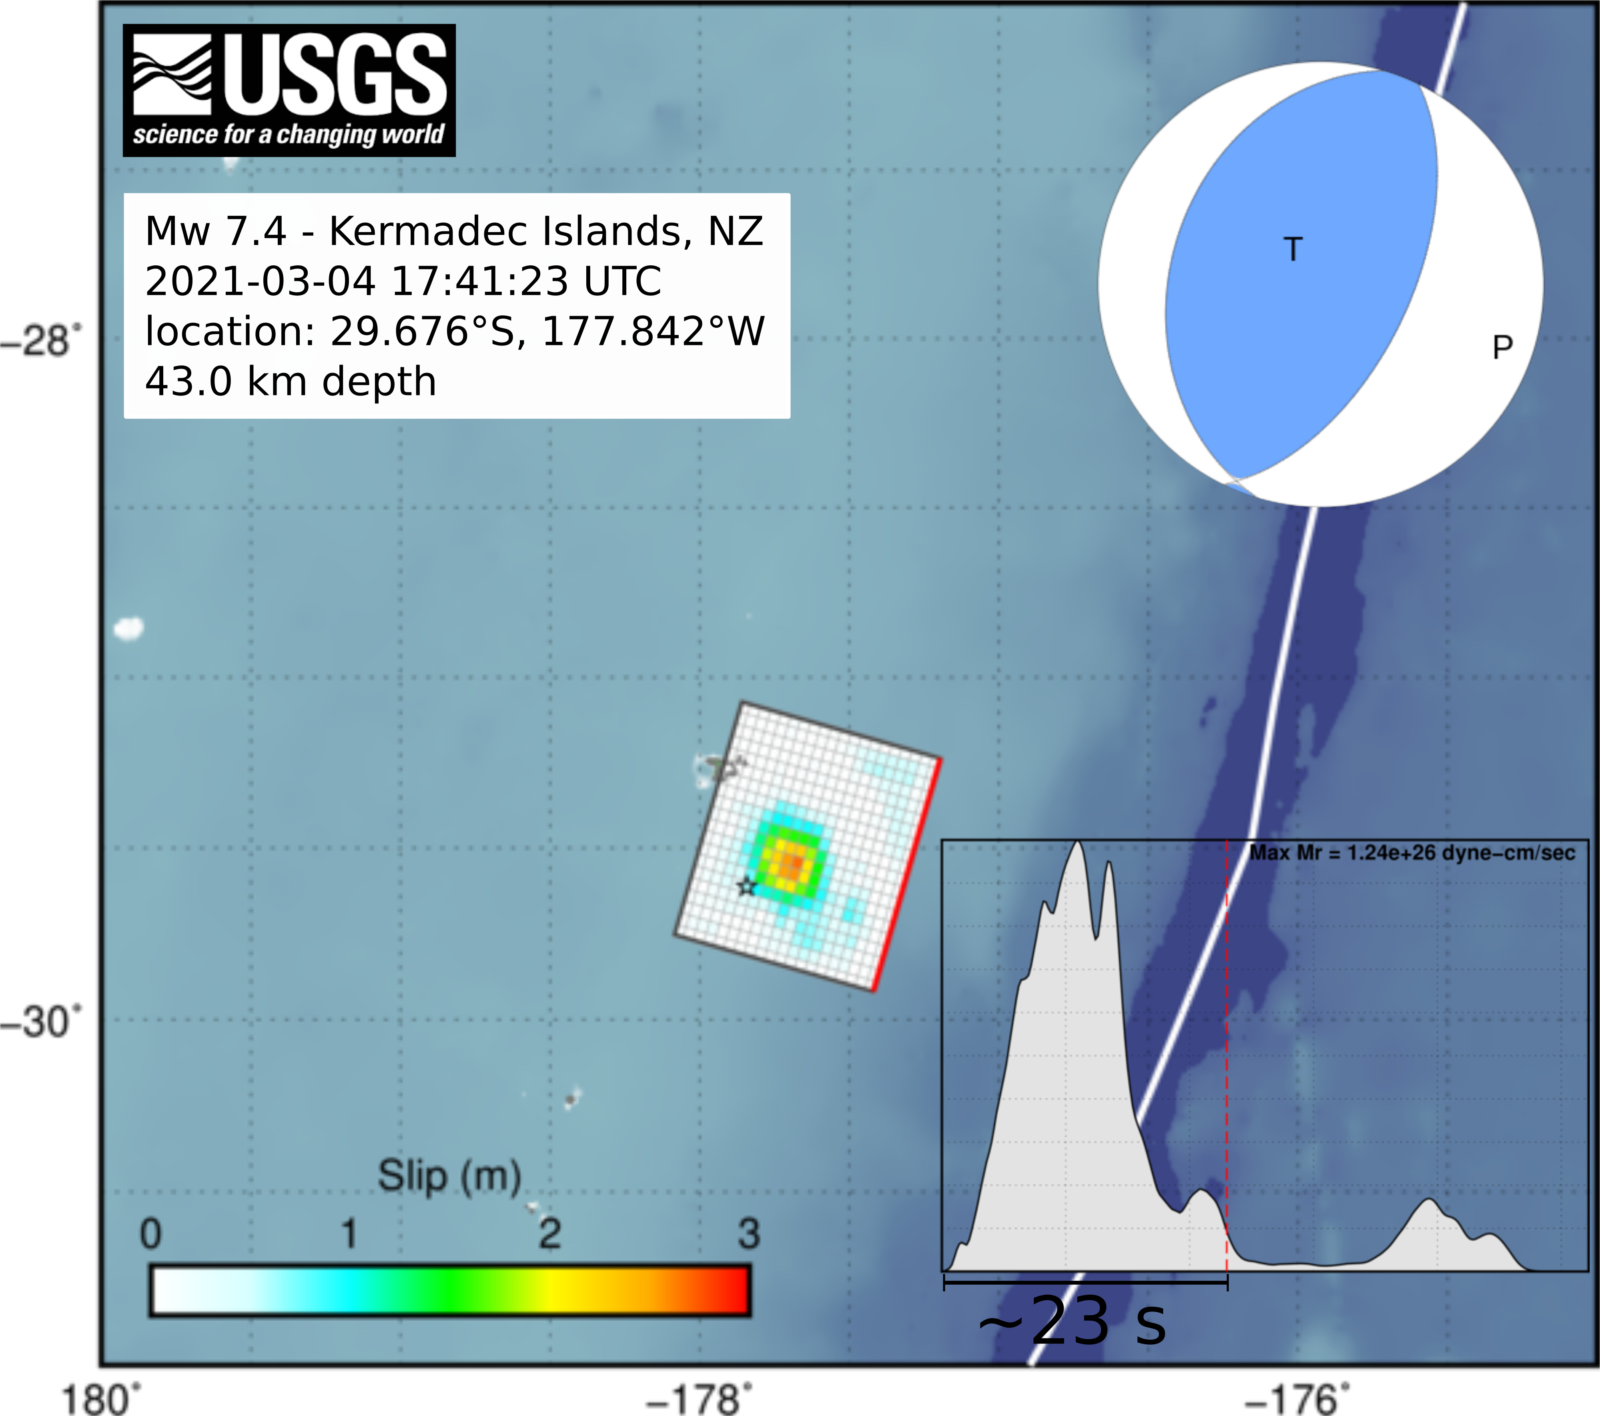
Figure 4 | Coseismic slip distribution model, source-time function, and focal mechanism for the M7.4 earthquake (Credits: USGS).
Less than two hours later, an M8.1 event hits the Kermadec Islands at the same latitude as the second event. The Kermadec Islands earthquake corresponds to the largest event in this sequence, which ruptured the subduction megathrust along the Tonga-Kermadec trench and showed a reverse-faulting mechanism at shallower depths (~29 km). The coseismic slip distribution model reveals a fault plane with two main asperities, also observed in the source-time function, with peak slips of around 4 m at ~20 and ~35 seconds from the origin time (Figure 5).
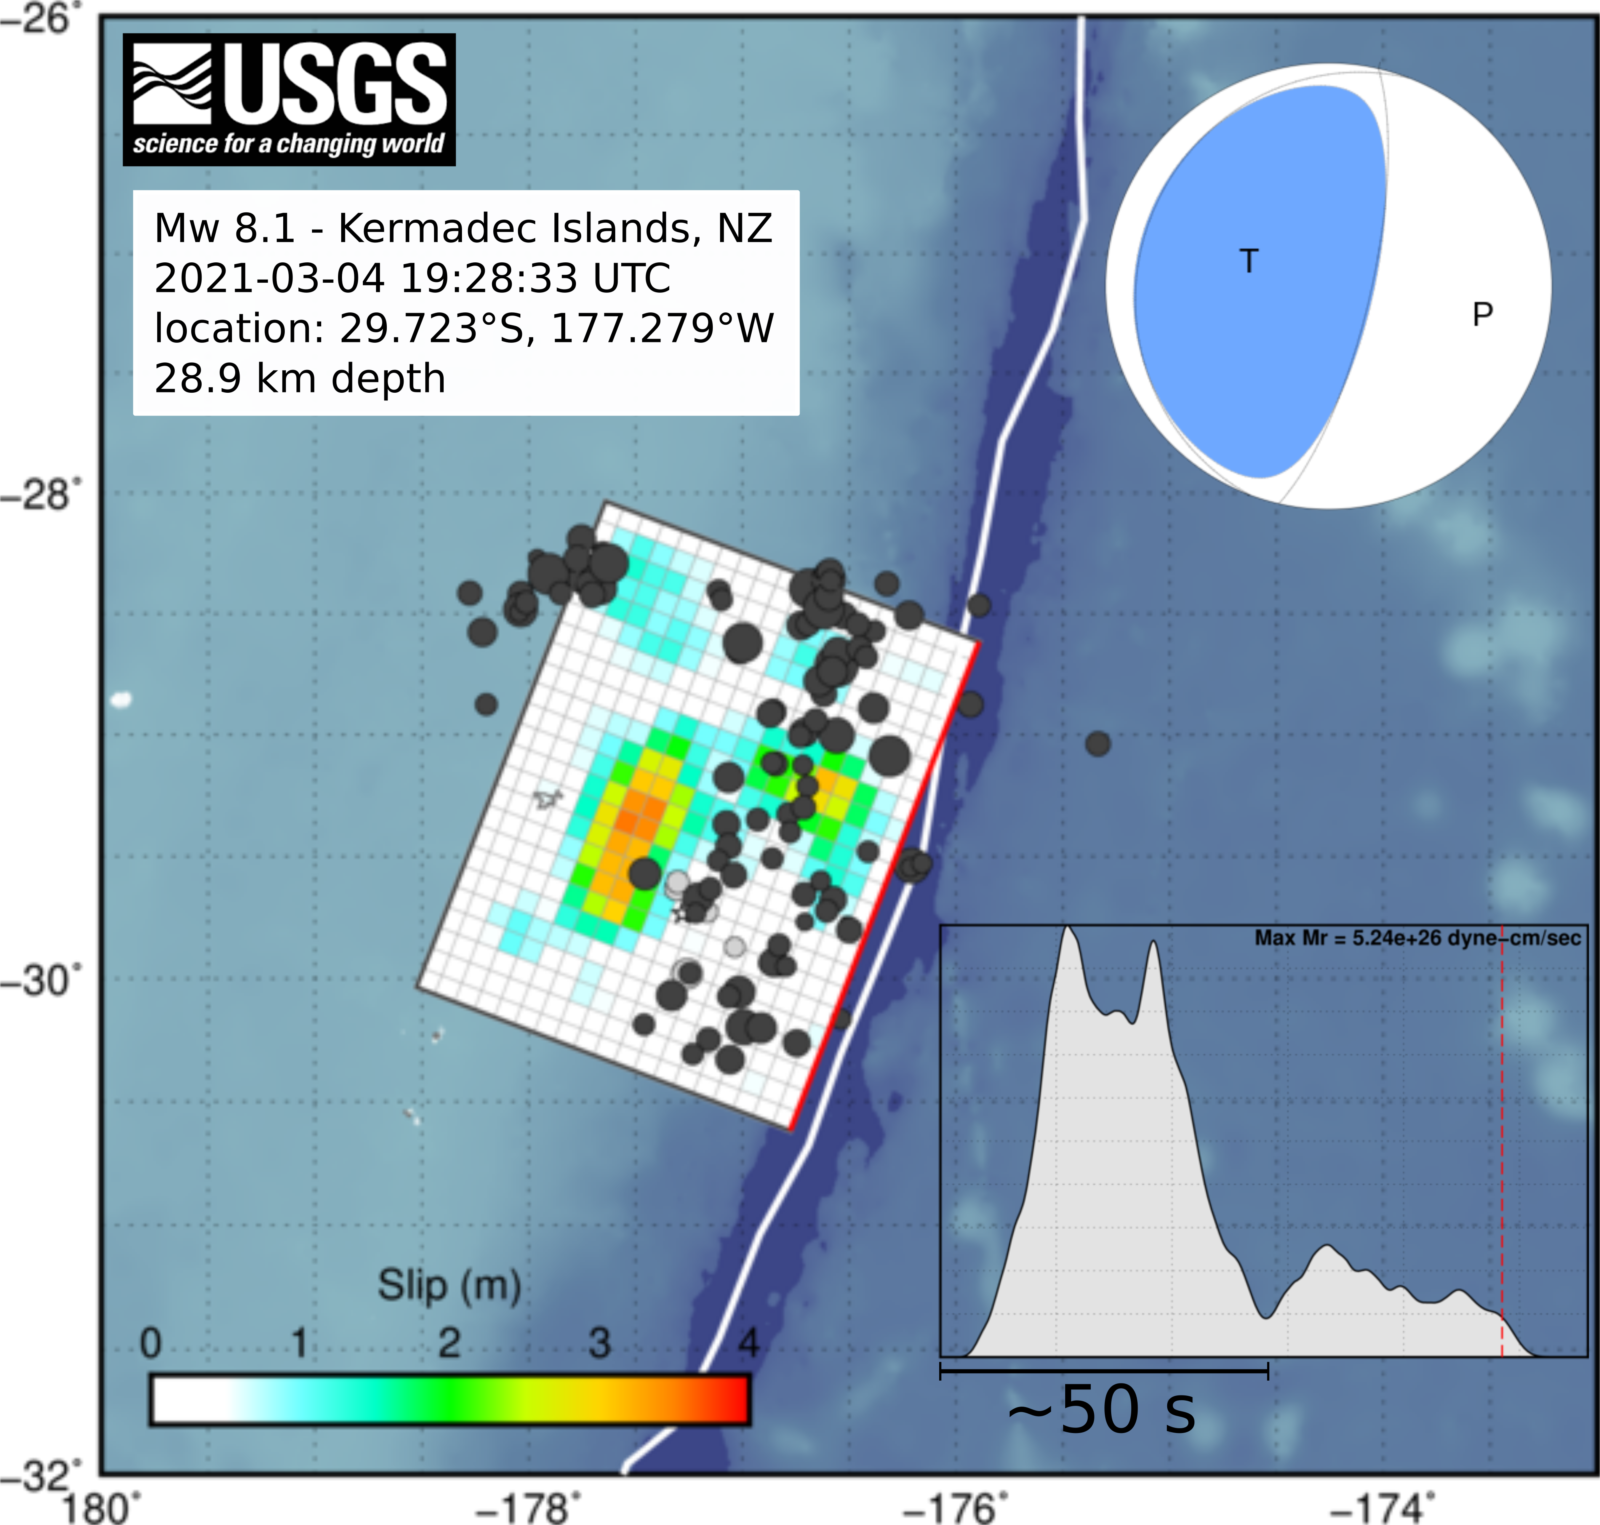
Figure 5 | Coseismic slip distribution model, source-time function, and focal mechanism for the M8.1 earthquake (Credits: USGS).
Undoubtedly, researchers worldwide still analyse the seismic waves and deformation patterns of this interesting and intriguing trilogy that occurred on one day. Moreover, it is also important to consider the full seismic sequence, including aftershocks that became foreshocks. What caused the possible multi-fault segment of the first event? Did the first quake trigger the second event 900 km apart? How are they linked to each other? These are only a few questions, and also many questions are open for further discussions.
Earthquakes are not the only hazard
The three main earthquakes generate three cumulated tsunamis. Figure 6 shows the tsunami gauge located in Great Barrier Island located to the North of NZ (see Figure 1). The first event, M7.3, generated a tsunami that reached a maximum amplitude of around 35 cm at East Cape and 20 cm at Great Barrier Island (Geonet). The tsunamis generated by the M7.4 and M8.1 close to the Kermadec Islands overlapped to produce waves around 40 cm at Great Barrier Island (Figure 6). However, these values were only recorded by tide gauges instruments installed at some points along the NZ coasts. For that reason, Geonet has opened a survey looking for unusual tsunami observations here.
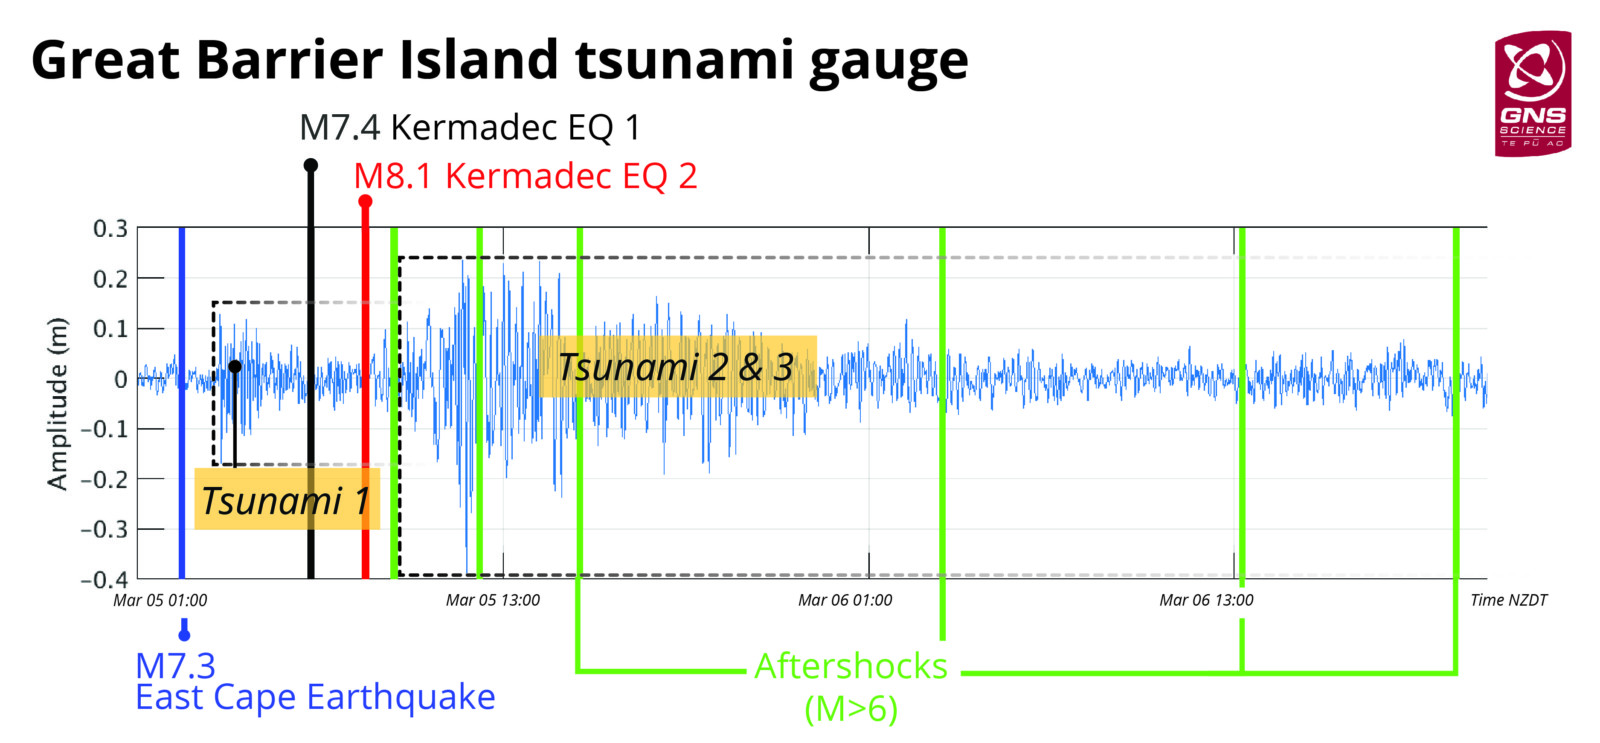
Figure 6 | Tsunami produced by the three large earthquakes occurred offshore New Zealand. The tsunami overlapped and was recorded around NZ. (Credits: Geonet @geonet).
After a large earthquake is important to monitor the damage associated with the surface ground motion. The uninhabited Raoul Island is the largest and northernmost of the Kermadec Islands, experienced over 300 new landslides triggered by the M8.1 earthquake (Source: Geonet). This geological hazard can be explained by a combination of the ground shaking estimated between 0.15 and 0.75 g in Raoul Island and the steep forested slopes near the volcanic Raoul caldera.
March earthquakes
Kermadec Islands earthquake, New Zealand – March 4th – M 8.1
Kermadec Islands earthquake, New Zealand – March 4th – M 7.4
East Cape earthquake, New Zealand – March 4th – M 7.3
References
1 Bassett, D., Sutherland, R., Henrys, S., Stern, T., Scherwath, M., Benson, A., Toulmin, S., and Henderson, M. (2010), Three‐dimensional velocity structure of the northern Hikurangi margin, Raukumara, New Zealand: Implications for the growth of continental crust by subduction erosion and tectonic underplating, Geochem. Geophys. Geosyst., 11, Q10013, doi:10.1029/2010GC003137.
2 Ojeda, J., Ruiz, S., del Campo, F., & Carvajal, M. (2020). The May 21st 1960 M w 8.1 Concepción Earthquake: A Deep Megathrust Foreshock That Started the 1960 Central‐South Chilean Seismic Sequence. Seismological Research Letters, 91(3), 1617-1627.
3 Zhang, H., Koper, K. D., Pankow, K., & Ge, Z. (2017). Imaging the 2016 Mw 7.8 Kaikoura, New Zealand, earthquake with teleseismic P waves: A cascading rupture across multiple faults. Geophysical Research Letters, 44(10), 4790-4798.
Note: This blog corresponds to a brief seismological review of the preliminary results about a mainshock event and seismic activity. An earthquake can be disastrous for neighbouring towns and people. When our team picks an “Earthquake of the month” (now “Earthquake Watch”) it is important to keep in mind that we are not looking for the most mediatic and deadly one. We are generally looking for regions where we can learn more about the seismic hazard, seismotectonic background, and social impact, which we put together with preliminary contributions. Understanding the seismic hazard is one way to address disaster risk reduction and develop resilient cities. As EGU Seismology ECS Team, our thoughts are with the earthquake struck communities in this challenging time.
This blog post was written by ECS representative Javier Ojeda
with revisions from ECS representative Walid Mansour and Maria Tsekhmistrenko
David Essing
Thank you Javier Ojeda for this interesting overview 🙂 It is a really cool summary of the information!
Best,
David
Bashir Elmejrab
Thanks, great learning. Appreciated interpretation /analysis effort from the involved teams.