On October 30th, a strong earthquake with Mw 7.0 occurred in the Aegean Sea, between the main cities of Samos in Greece and Izmir in Turkey. The hypocenter location and focal mechanism suggest shallow depth (~10 km) and normal faulting on the E-W plane. This is in agreement with the tectonic setting where an N-S extension is dominant. Moreover, the rupture propagates near the Menderes Graben in Western Turkey, a region of historical strike-slip and normal faulting (Figure 1, Karasözen et al., 20161).
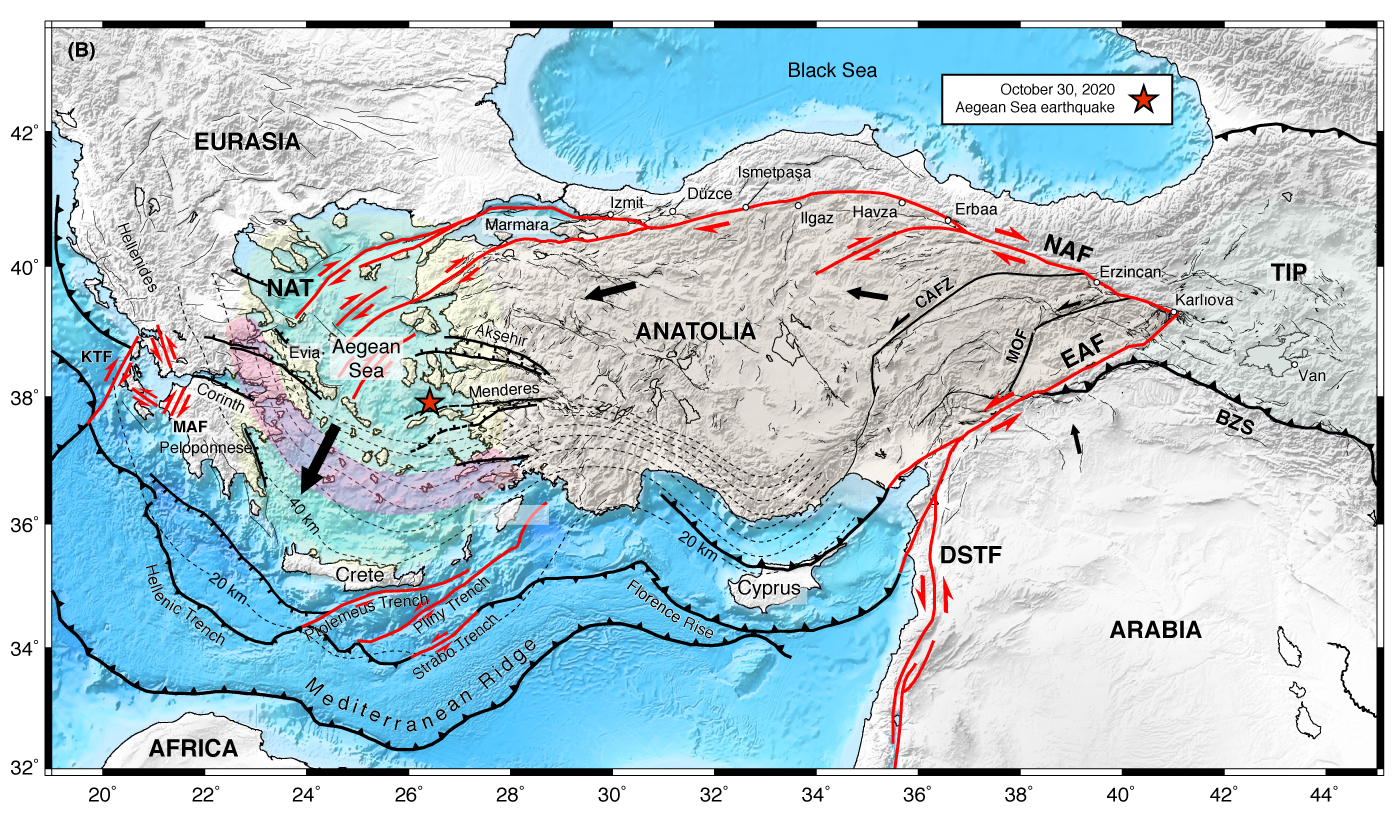
Figure 1 | Tectonic setting and location of the Samor-Izmir earthquake (red star). Credits: Sylvain Barbot @quakephysics2
Preliminary InSAR analyses show that most of the deformation appears to be underwater (Figure 2). Also, it reflects uplift of about 5-10 cm in western Samos Island, and a small area of the coast subsided due to the earthquake. This strong gradient between uplift and subsidence in Samos Island observed with InSAR data could be a key point to better understand the fault mechanism of this earthquake. However further models, analysis, and field evidence are needed.

Figure 2 | Map of ground displacements calculated from Sentinel-1 radar by NASA-JPL ARIA project3.
Some regional and teleseismic finite-fault models are available (Figure 3). Most of them show likely bilateral shallow rupture with maximum slip around 2 to 3 meters. Despite the bilateral rupture, the slip seems to propagate mostly west-ward followed by aftershock seismicity. A different source time function shows that the rupture propagates for ~20 seconds. However, it is important to keep in mind that finite fault models can not constrain a preferred fault plane properly, due to the ambiguity between the fault and auxiliary planes obtained from the focal mechanism. To discriminate between each nodal plane it is necessary to assess and compare with more data, e.g. InSAR or other geodetical methods.
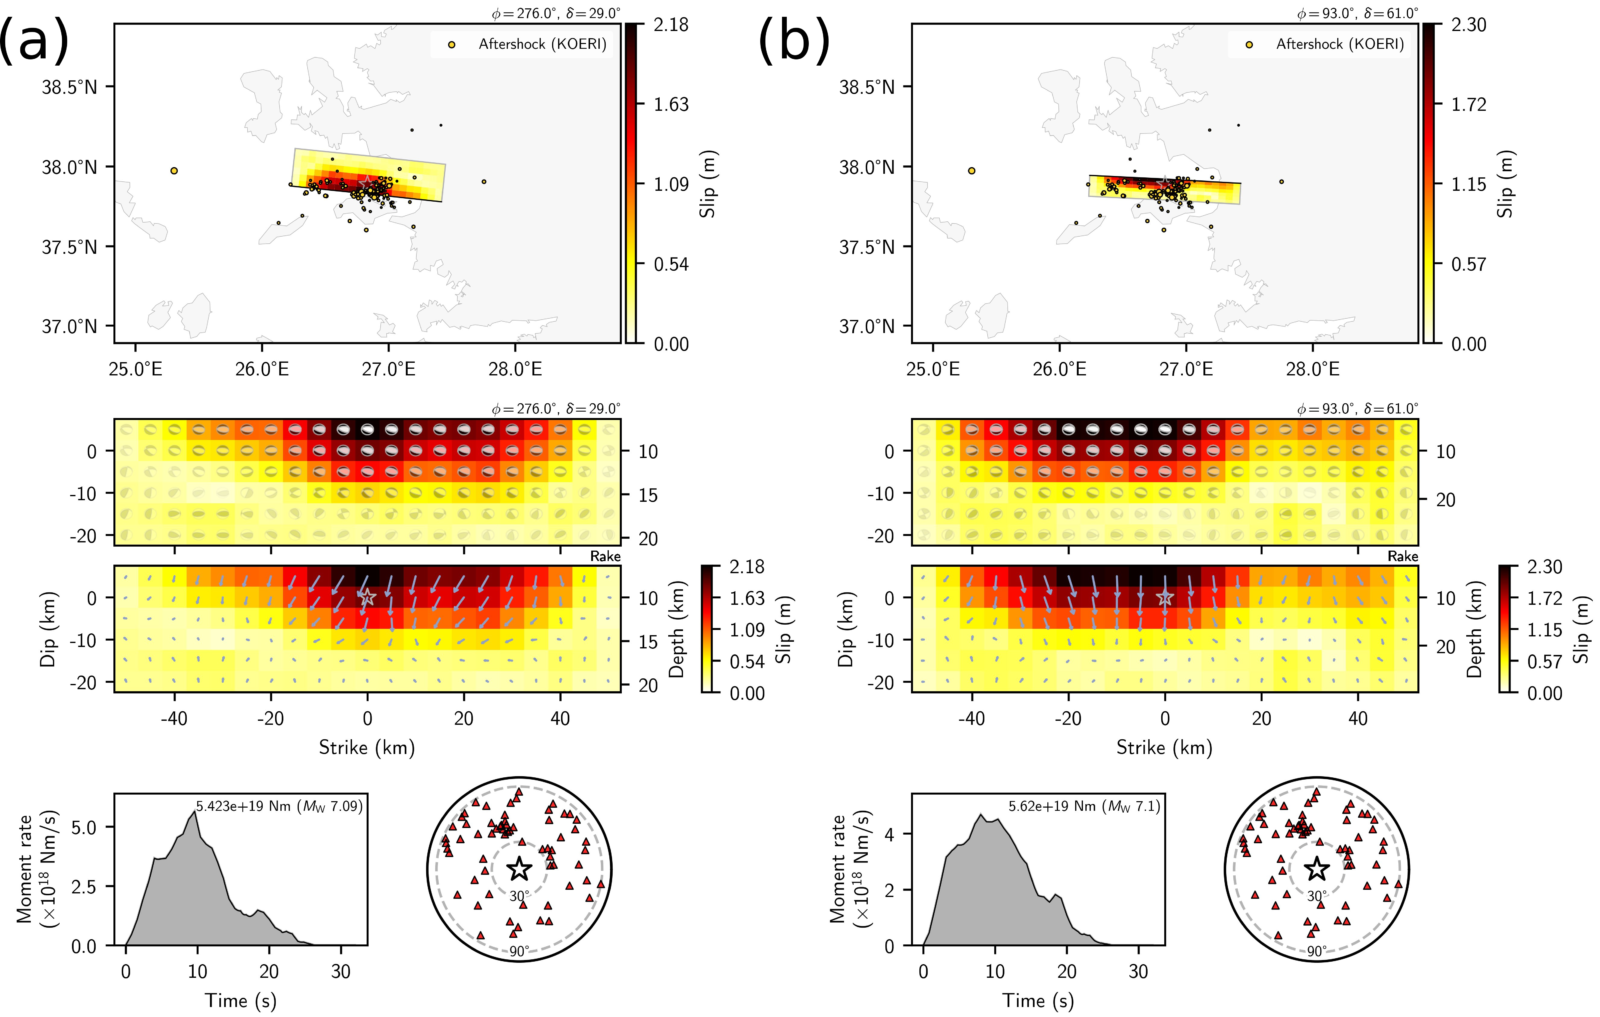
Figure 3 | Slip distribution model using as initial rupture of the hypocenter (from KOERI4), the methodology proposed by Shimizu et al., 20205, and two possible fault planes (USGS, W-phase Moment Tensor6). Credits: Ryo Okuwaki @rokuwaki7
Normal faults can trigger a localized tsunami, and that was observed only a few minutes after the earthquake (Figure 4). Coastal cities close to seismogenic sources only have a short time window to activate the Tsunami Early Warning System to warn the population.
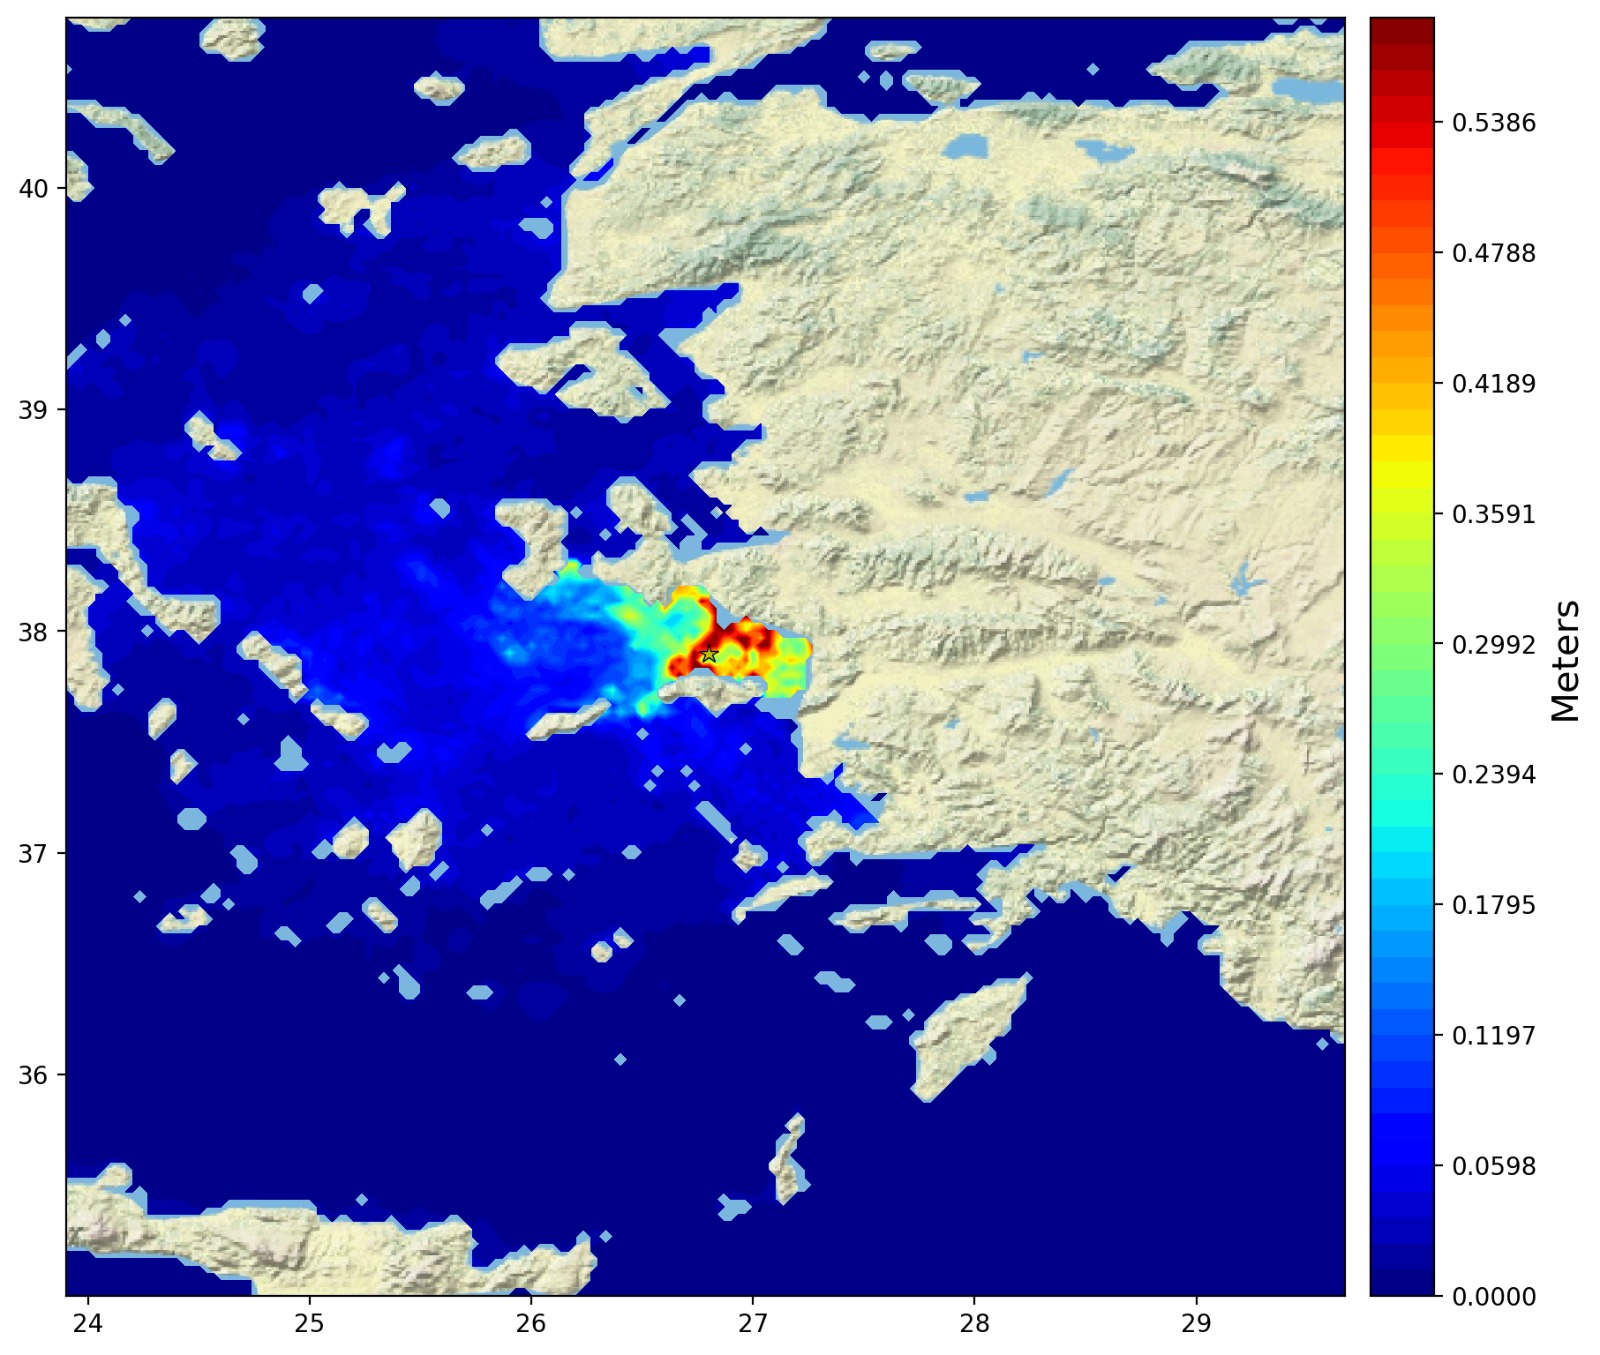
Figure 4 | Simulation of tsunami wave propagation in the Aegean Sea. Credits: (TOP) Amir Salaree @amirsalaree8, (BOTTOM) Jorge Macías Sánchez @JorgeMACSAN9
The Samor-Izmir earthquake caused significant damage in populated cities, for example, the impact in Izmir results in a peak ground acceleration (PGA) close to 0.2g in the horizontal component (Figure 5). The high PGA resulted in the collapse of buildings, numerous fatalities, and missing people.

Figure 5 | Acceleration in a near eld record. Station GMLD, network KO. Credits: Iunio Iervolino @iuniervo10
TOP 3 – October earthquakes
Sand Point earthquake (Alaska) – 19th October – M 7.6
Samos-Izmir earthquake (Greece/Turkey) – 30th October – M 7.0
Pangai earthquake (Tonga) – 30th October – M 6.4
References
-
- 1 Karasözen, E., Nissen, E., Bergman, E. A., Johnson, K. L., & Walters, R. J. (2016). Normal faulting in the Simav graben of western Turkey reassessed with calibrated earthquake relocations. Journal of Geophysical Research: Solid Earth, 121(6), 4553-4574
- 2 https://twitter.com/quakephysics/status/1322242343198621696/photo/1
- 3 https://appliedsciences.nasa.gov/what-we-do/disasters/disasters-activations/aegean-sea-earthquake-october-2020
- 4 http://www.koeri.boun.edu.tr/new/en
- 5 Shimizu, K., Yagi, Y., Okuwaki, R., & Fukahata, Y. (2020). Development of an inversion method to extract information on fault geometry from teleseismic data. Geophysical Journal International, 220(2), 1055-1065.
- 6 https://earthquake.usgs.gov/earthquakes/eventpage/us7000c7y0/executive
- 7 https://twitter.com/rokuwaki/status/1322697505499394048/photo/1
- 8 https://twitter.com/amirsalaree/status/1322541828214726656/video/1
- 9 https://twitter.com/JorgeMACSAN/status/1322199843100643328/photo/1
- 10 https://twitter.com/iuniervo/status/1322211934972895233/photo/1
This blog post was written by ECS representative Javier Ojeda
with revisions from ECS representative Maria Tsekhmistrenko
aec
There is an error about the PGA of the earthquake. The PGA is 0.2 g.
Figure 5. shows the acceleration time history for a building with period of 0.16 sn. The maximum acceleration is about 1 g for that kind of structure.
Maria Tsekhmistrenko
Hello!
Yes, indeed you are right with your comment. Javier recently found an update by Iunio Iervolino (Twitter account @iuniervo) from December 10. Iunio Iervolino comments about an error in the metadata of this station, the waveform has lower amplitudes. The figure in question was changed accordingly.
Cheers,
Maria
DR RBS Yadav
Hi,
Its very good work. Congratulation to the authors.
Can I get slip distribution model that is shown in Fig 3. I want to calculate deformation and stress changes due to this earthquake.
Reagrds
DR RBS Yadav
Maria Tsekhmistrenko
Dear Yadav,
Javier says that Figure 3 is from Ryo Okuwaki, and he recently published their models on the next open-access paper in PAGEOPH (check fig.5):
https://link.springer.com/article/10.1007%2Fs00024-021-02761-8
We don’t know if the model is available in some repository, but you try to send an email to the corresponding author asking for the slip distribution model.
Cheers,
Maria