An interview with Arie van Wettum
In many universities, students and staff will go out into the field to deploy seismometers, collect data, and service instruments. Students get a sense of the area their data is coming from, the difficulties that are involved with deploying and recording data, and although inexperienced at the beginning, they are a relatively low-cost way of getting equipment out. It is a system that relies on a continuous transfer of knowledge to each new generation. Utrecht University, however, has taken a different tack, and for nearly 40 years, Arie van Wettum has been the master and commander of all things field and seismometer in the Seismology group. In late summer, the EGU seismology blog interviewed him at his home, where he has temporarily set up shop because of the corona pandemic. Fully corona proof, we sit in his garden and speak about exploding pre-amplifiers, lorry driver telemetry and how the explosion in data storage capacity has fundamentally changed seismology (as it happens, Arie is wearing a T-shirt with on it a floppy disk saying to a dismayed USB stick “I’m your father!”). As we speak, more and more gadgets, many of them built by himself, appear on the table.
Blown pre-amplifiers
“When I started the job, I knew absolutely nothing about seismology. This was in 1981, and it was actually my wife Kitty who had noticed the job advertisement. At the time, we were in the midst of renovating our house and busy as we were with this, I didn’t really feel like applying for a job, but she convinced me. During my training, I had thoroughly enjoyed my internship at Utrecht University’s Robert van de Graaff lab, so returning to the university might actually be just the thing for me.”
“I was hired to develop a pre-amplifier for the NARS project – the Network of Autonomously Recording Seismographs –, a job I carried out together with Bernard Dost, then a PhD student on the project and now working at the KNMI, the Dutch Meteorological Institute, which also has a seismology division. He had already made several attempts on his own, but as this had involved some things going up in smoke, at some point the decision was made to hire a proper technician.”
“I was hired out of roughly 40 candidates – they later told me this was because I’m a radio amateur and they were told ‘make sure to take one of those guys, they’re always tinkering with electronics and building stuff’.”
“The start was tough. On the first day, I was shown my room – which was also supposed to function as lab space – and save for a few novels on a shelf it was completely empty. I had never seen a seismometer before, I had no tools and no knowledge, and as I came home I said to my wife ‘either I’m going to sink my teeth into this properly, or I’m out of here within a month.’”
“Luckily, my colleague Johan Tempels, who worked in the office next door as the technician for exploration geophysics, was incredibly helpful. He lent me a soldering iron, advised me about where to get money, and slowly I got into the project so that by early 1983, we had a functioning setup and we were ready to deploy the first NARS experiment.”
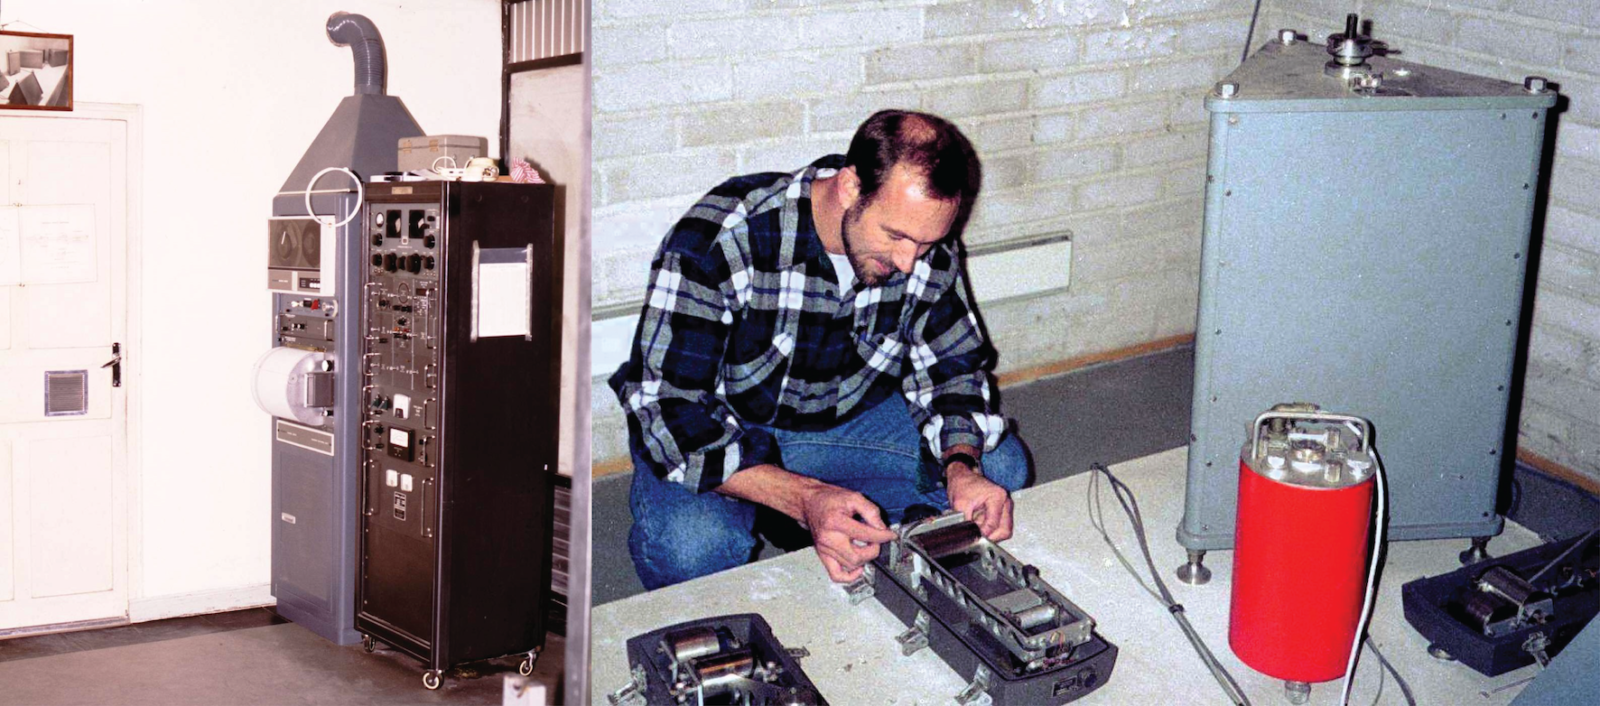
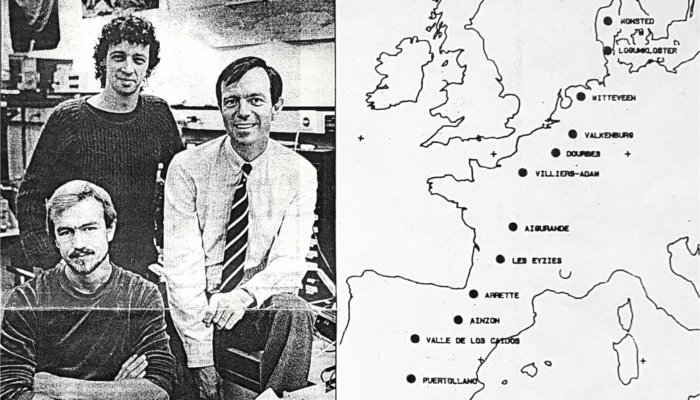
Figure 1 | The WWSSN setup vs NARS instruments. Left: WWSSN station TOL, Toledo, Spain. In the WWSSN setup, data recording took place on huge devices, with visualisation on long rolls of paper. As a result, the dynamic range of the systems was fairly limited. Right: Arie busy tuning the NARS instruments, at WWSSN station NUR, Nurmijarvi, Finland. The large triangular box holds one of the WWSSN sensors — an order of magnitude larger than the NARS sensor Arie is calibrating. Photos courtesy Arie van Wettum.
The development of mobile seismology
Nowadays, mobile, unmanned networks of broadband seismometers are a commonly used tool by seismologists to investigate in detail a specific area and rapidly respond to events. In the 1980s, however, sensors and recording devices were still very large, with storage either analogue on large rolls of paper (with a correspondingly limited dynamic range), or taking place on 19-inch tapes – not something to be carried around in the field (Figure 1).
With the rapid advent of microprocessors in the late 1970s, it suddenly became possible to implement electronic signal amplification and digital recording. Guust Nolet, now retired from his professorial duties in Princeton and Nice but then a researcher in Utrecht, wanted to study the European upper mantle using surface wave overtones. For this, close spacing of stations would be required, using broadband instruments with a large dynamic range. He came up with the idea to develop a network of mobile digital broadband seismometers that would make use of these new developments and could be deployed easily [1]. In contrast to the then gold standard WWSSN stations [2,3], these would make use of digital recording with an enhanced dynamic range to pick up both the small and large signals. The main challenge lay in data storage – to make the setup portable, this had to be done on tapes that could hold a maximum of about 10 MB. With the triggering algorithms on the datalogger’s microprocessor, it was possible to discriminate between quiet noise and events, and selectively record the interesting events only.
The first generation NARS network thus consisted of 14 stations equipped each with a Kinemetrics PDR-2 datalogger and three sensors: two horizontal Kinemetrics SL-220 and a vertical SL-210. These were tuned to an eigenperiod of 12 s, where the pre-amplifier that Arie built served to boost the low frequencies. NARS-Europe, the first NARS experiment, was set up with the instruments configured in a line from Göteborg in Sweden to Granada in the south of Spain [4,5,6]. Arranged like a directional ‘antenna’ with an interstation spacing of about 200 km, it was designed to pick up higher mode surface waves over a large range of frequencies from events around Japan and in the South Pacific. When it was first deployed, the NARS project made quite a splash, with articles in several national and international newspapers [e.g. 7,8].
No such thing as GPS
“In the 1980s, GPS was only just being made available for civilian use, and no useful receivers were on the market yet. Although the PDR2 could receive the GOES satellite time signal, this was only a few degrees above the horizon, and as such not an option for us [9]. Instead, we made use of the DCF signal.” My quizzical look must have betrayed my ignorance as to what DCF is.
“Have you never had one of those little bedside clocks that say ‘radio controlled’?” He immediately fetches a small digital clock from inside his house. DCF [or fully: DCF77, see 10] turns out to be a longwave time signal radio station located near Frankfurt, which continuously broadcasts the datetime signal all across Europe. Thanks to its long wavelength it can be picked up as far as 1500–2000 km.
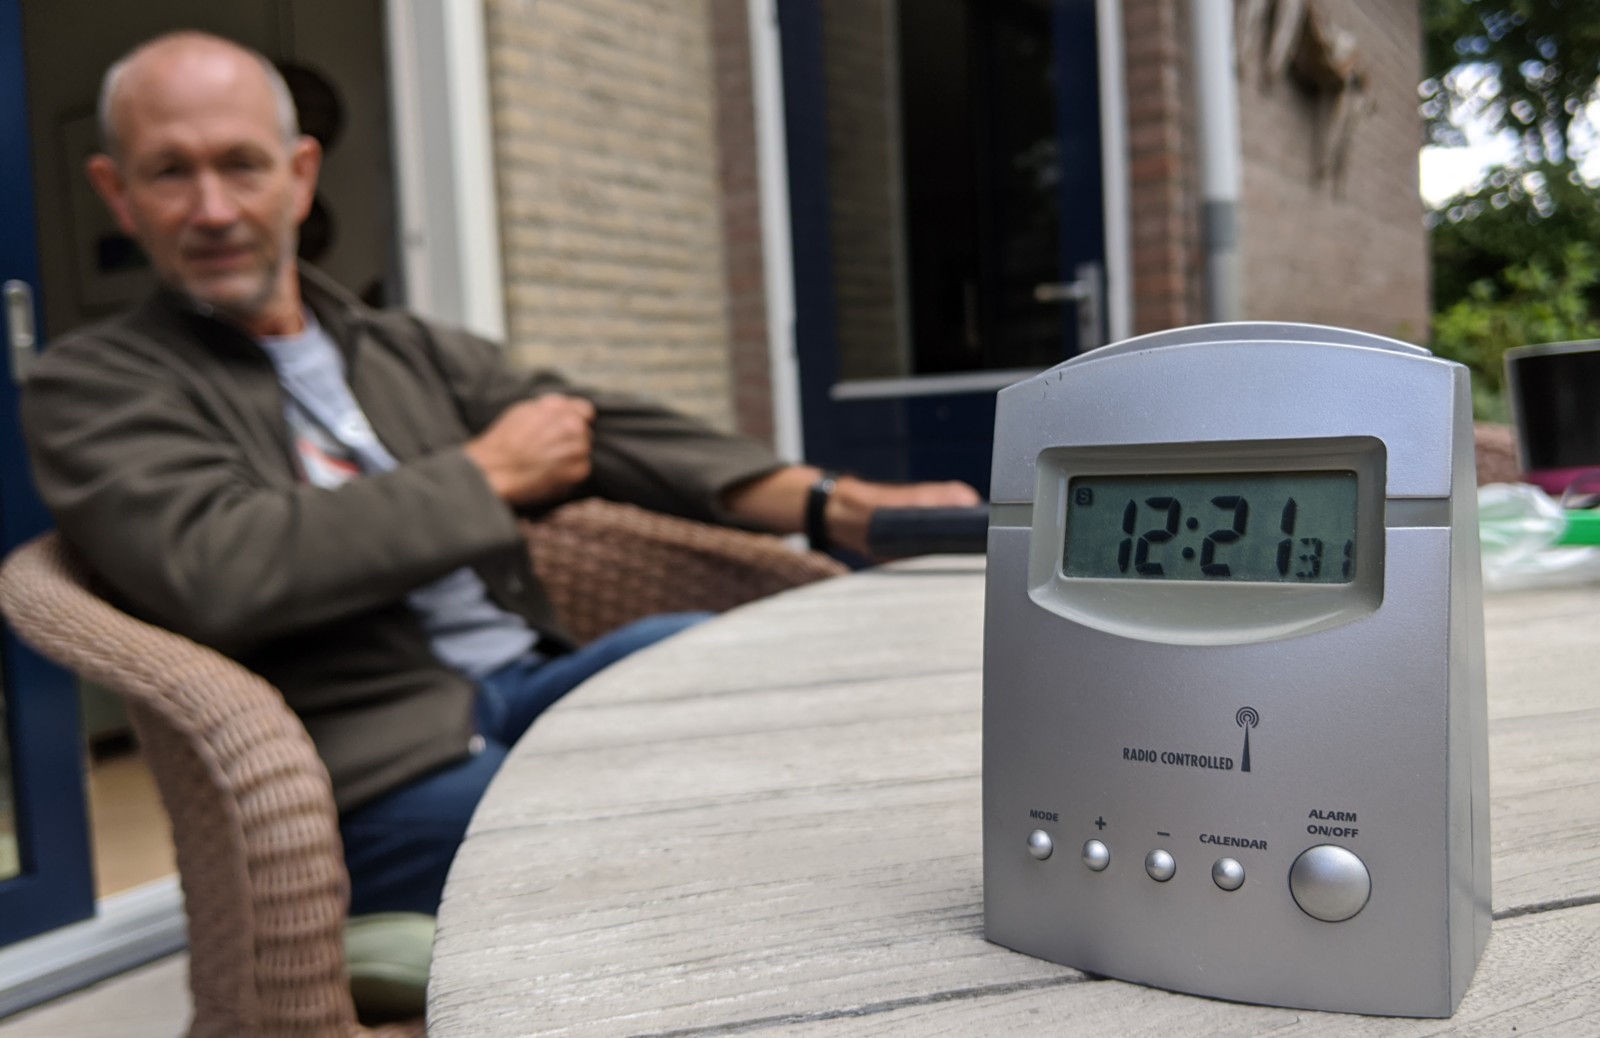
Figure 2 | A DCF clock, receiving its time signal from the Frankfurt station.
“Still, the south of Spain is quite far away, so to receive the signal, I had to make a special antenna. The design is quite simple – a loop antenna consisting of a cross of plastic bars, some wire wrapped around it and a capacitor – but it worked very effectively. But sometimes we had to sit on the roof of a building, waving around the antenna until we had picked up the signal.”
“I had to design a receiver to make the instrument adopt DCF time – nothing existed at the time. So I took a DCF clock and adapted the software – in assembly code, mind you! – to transfer the time from the antenna to the instrument. Depending on how far away you were from Frankfurt, this resulted in a temporal accuracy of about 10-20 ms, which was generally good enough for the long periods targeted in the NARS-Europe project.”
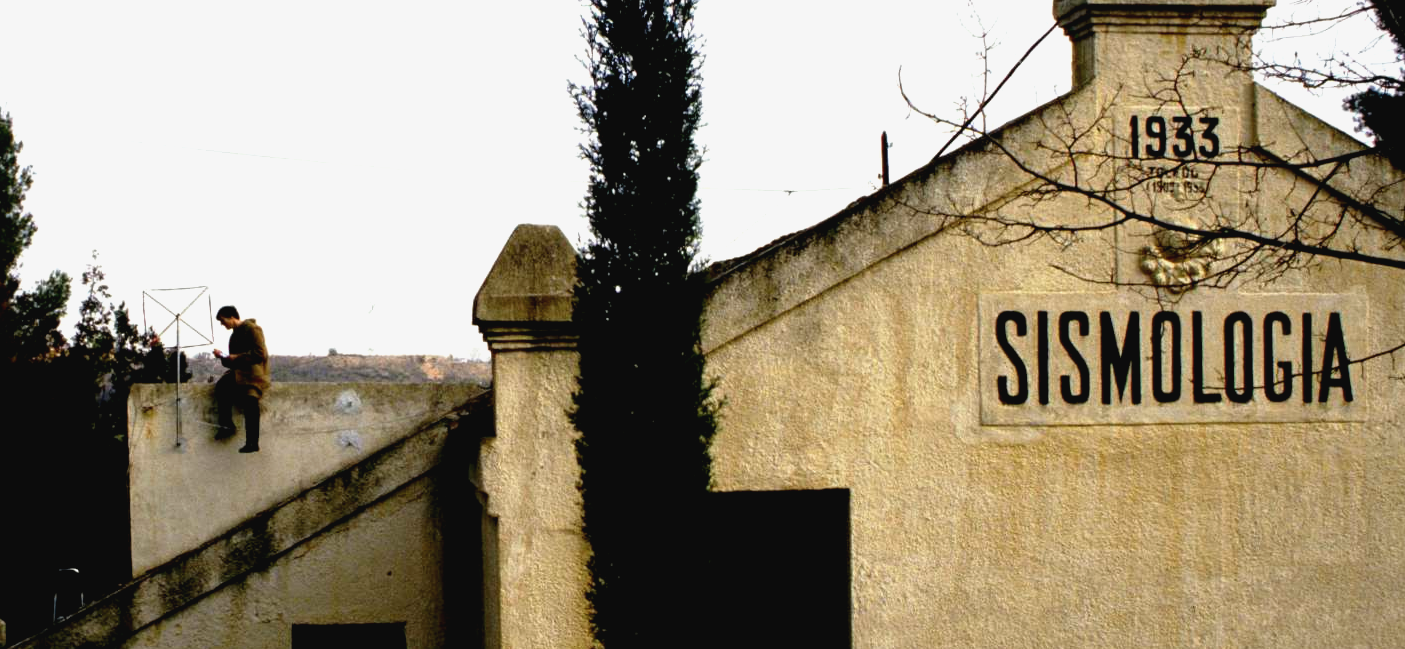
Figure 3 | Roel Snieder (now a professor at the Colorado School of Mines) sitting on the roof with Arie’s loop antenna, trying to capture DCF signal near Toledo in central Spain, ca 1983/1984. Photo courtesy Arie van Wettum.
A loud and heartfelt ‘¡jodér!’ echoed through the church.
Franco’s grave
“One of the most memorable sites of this deployment was the Valle de los Caídos. This is where Franco lay buried [up until about a year ago, 11], and our instrument was deployed in a burial vault right inside the church! The Istituto Geográfico Nacional also had an instrument there, so it was actually quite easy for us to gain access. The vault was situated behind the pews on the right-hand side of the church, and you accessed it by lifting up a big stone. We had to take care when we went inside: services were carried out regularly in the church, so we always listened carefully whether we could hear singing or preaching, and only came out when things had gone quiet again. One time we made a mistake: mass had only just ended and people were still on their way out. As we lifted up the stone, a loud and heartfelt ‘¡jodér!’ echoed through the church – I think we gave this poor Spaniard the fright of his life!”
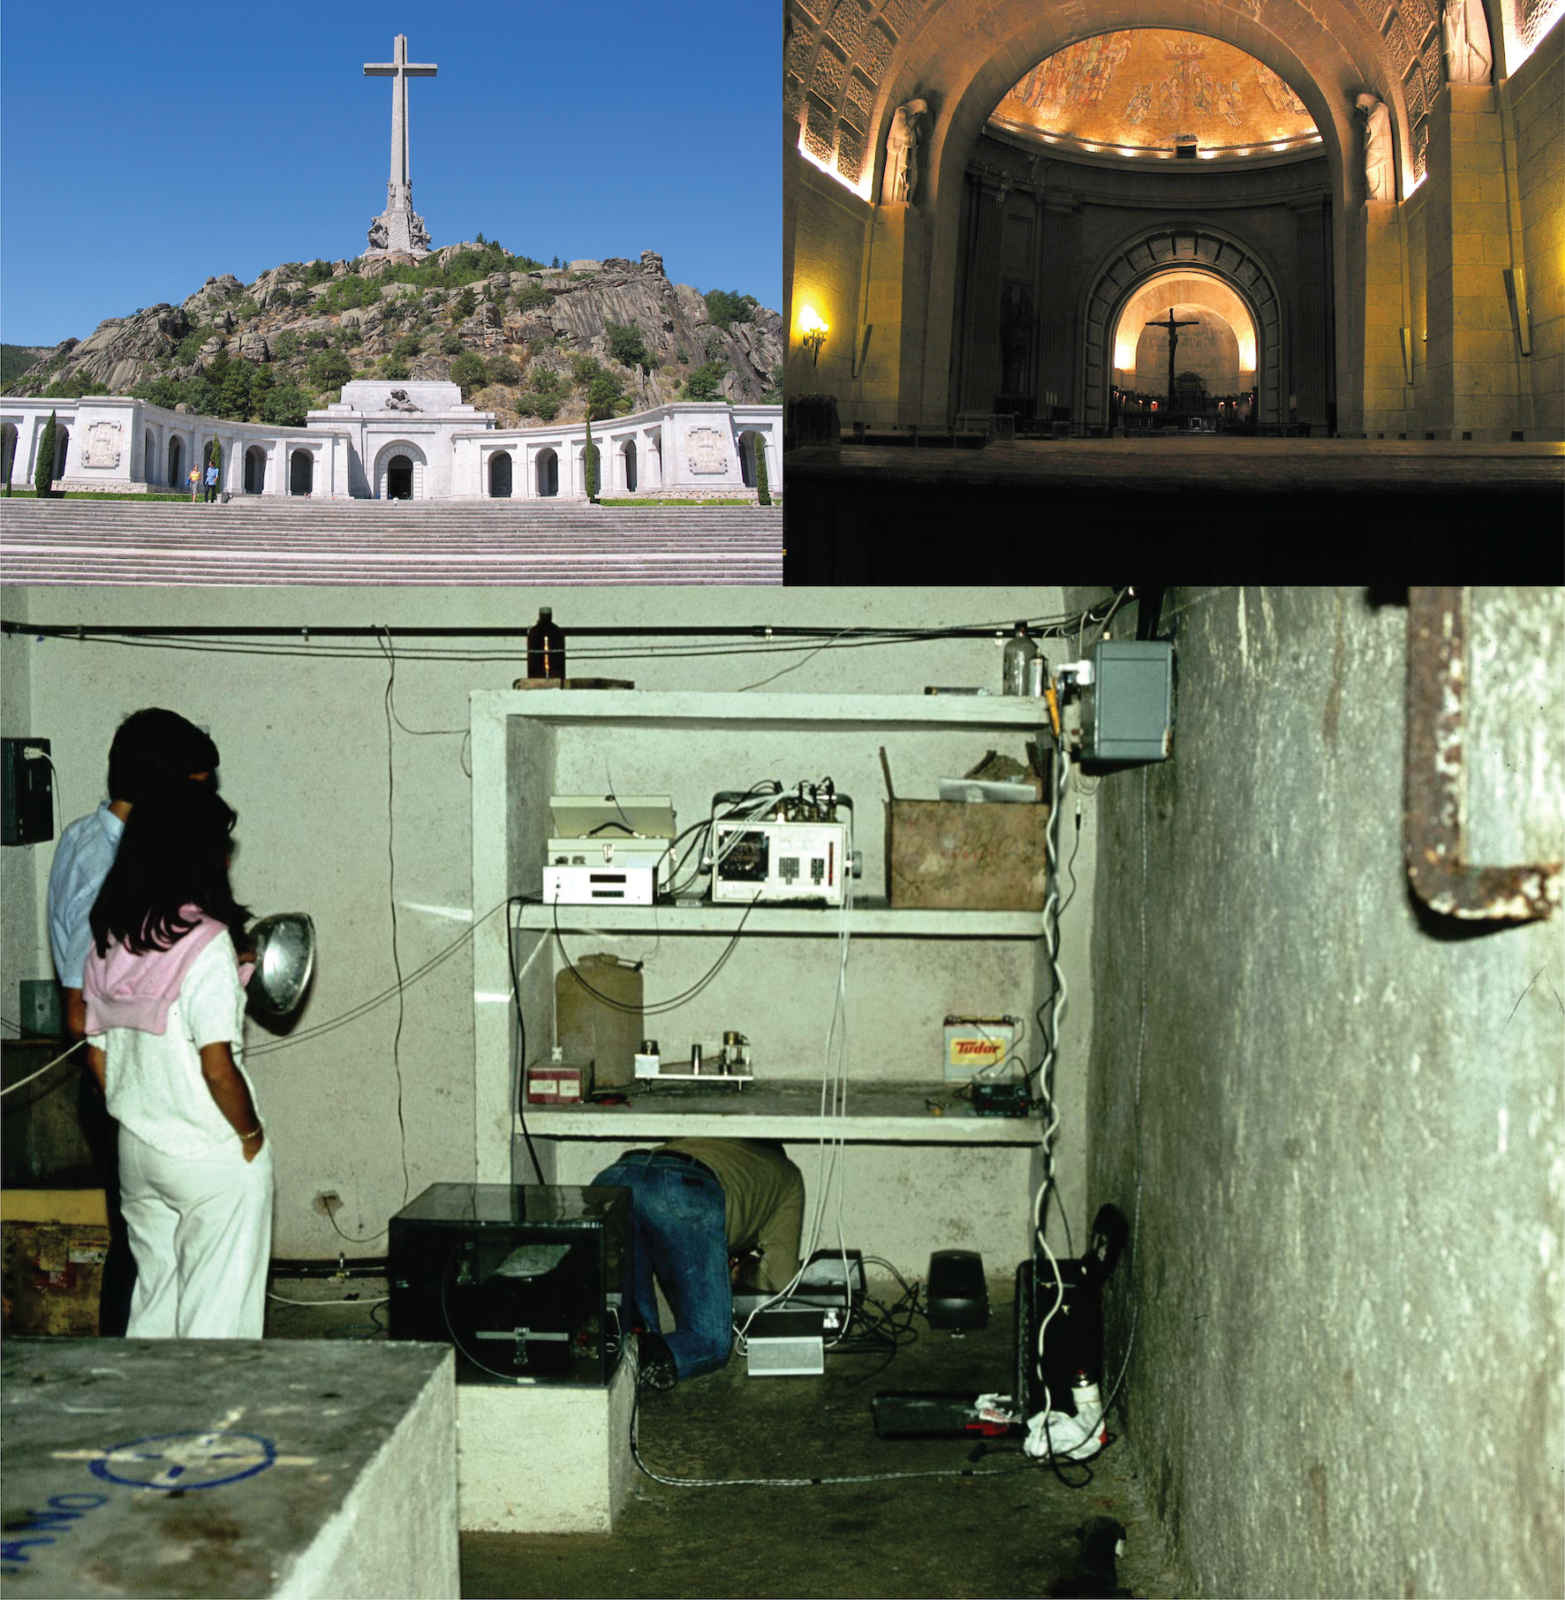
Figure 4 | Top left: The monumental church in the Valle de los Caídos. On windy days, the swaying of the large cross on top of the hill became visible in the seismograms. Top right: The vault containing the instruments was located behind the pews, Bottom: Inside the vault. Photo courtesy Arie van Wettum.
Not only did Arie help develop the initial NARS field setup, but he was also the main force behind all consecutive deployments. Over the years, these would take him to Germany, Russia, Baja California in Mexico, and most recently Botswana, where the network was so successful that it was bought as-is by the Botswana Geosciences Institute (BGI). At each iteration, new innovations were introduced, often inspired by technological developments of the time and cobbled together by Arie.
The first ‘telemetring system’ we had consisted of lorry drivers picking up cassette tapes in the former USSR.
10 MB on a cassette tape
“The main issue during the first deployments was storage. In those days, the data was stored on cassette tapes with a grand total of 10 MB storage space. You wouldn’t even dream of continuous recording – instead, we used an STA/LTA (short term average/long-term average [12]) filter to trigger events. This was a real pain, though: a trigger could be provoked by a small thermal deviation, or even a mouse walking over your instrument… In those days, we lost a lot of potentially good events, and gathering enough data must have been hard work for the seismologists! Later, my colleague Henk van der Meer and myself designed thermally regulated boxes with double walls and terrarium heating and this made the data losses significantly less.”
“The big step in data storage really came in the late 1980s. This was when we were setting up an experiment in the (former) USSR, for the DEEP project [13]. The development of DAT tapes [14] allowed for a whopping 3 GB to be stored on a single tape. This gave us for the first time the possibility of continuous data storage in a mobile deployment. As no commercial party had yet made a data logger using these tapes, I sat together with the electronics company Interay to design and build one specifically for us.”
“Even with 3 GB on a tape, eventually you want access to your data. Because the postal services were so unreliable, at some point I contacted the haulier firm Van der Wal, who regularly drove to Russia. Local people would bring the tapes to the hotel where the drivers were staying, who would pick them up if they were passing by anyway. This resulted in our first ever ‘telemetring’ system. I would give the drivers 25 guilders [equivalent to ~€20 nowadays] for their service, but they would have none of that and were simply happy to help. This system ran successfully for a number of years.”
The future is really with telecommunication.
Remote control seismology
“The future is really with telecommunication. Mobile network coverage is becoming more and more reliable, and developments such as the Internet of Things are a market that is growing exponentially. Companies like SpaceX and Amazon are launching their own small satellites, aimed in particular at remote developing areas. It’s a matter of time before this takes over in seismology as well.”
Picking up on these developments, Arie designed a telecommunications system for the deployment in Botswana (2013–2018) that made use of a GSM modem and a local SIM card. If an instrument powered off or somehow seemed to be misbehaving, it would send him an SMS update. He could then discuss with the technicians in Botswana whether someone needed to go and check-up.
“Just imagine how sad it would be if things stopped working a month after you installed or serviced the instrument, and you’d only find out a year later!” (Here, I nod – just that has happened several times in the deployments that I have been involved in.)
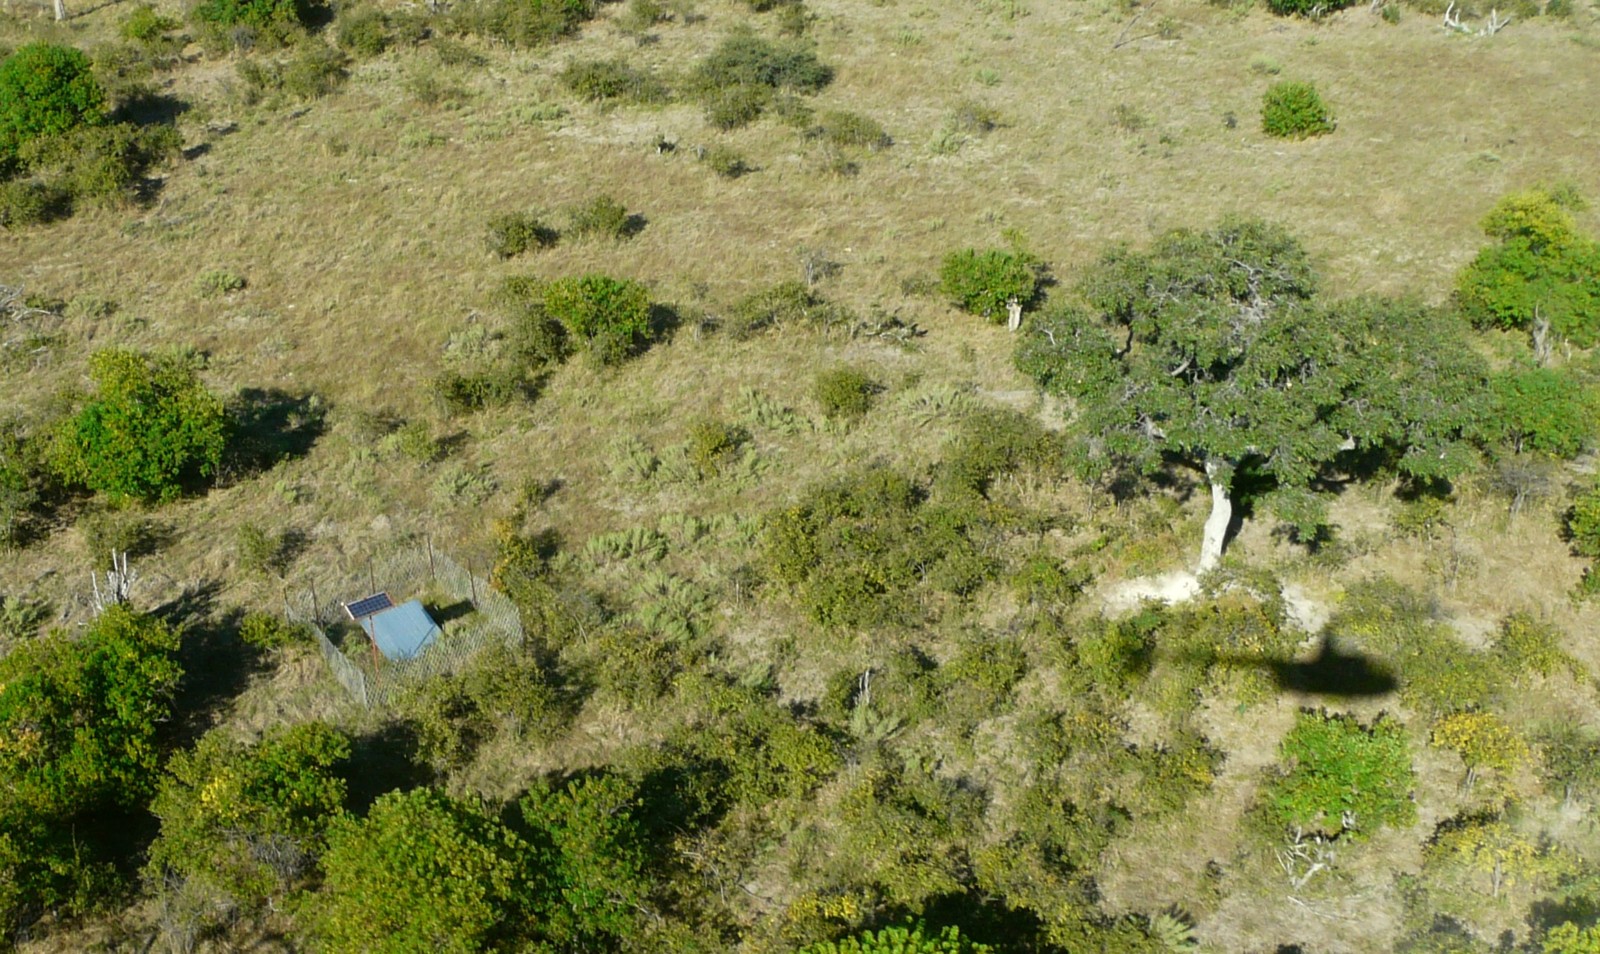
Figure 5 | Not all stations in Botswana have mobile reception. The Selinda camp station in the northern Okavango area takes a full day of offroad driving to reach. When the M6.5 earthquake hit in April 2017 [15, 16], the heavy rains had made it impossible to reach altogether, so the data was collected by helicopter.
The Botswanan collaborators were so happy with the systems that Arie built up, that they suggested buying the complete deployment. This was partially prompted by the MW 6.5 earthquake that happened in the central Kalahari in April 2017 [15, 16], which occurred right in the middle of the network.
“At first I just laughed, but they were dead serious. I told them we would need to buy new seismometers, while the instrumentation that they were getting was partially almost two decades old. But they insisted, and in the end, we struck a deal out of which we could buy twelve new instruments.”
“Now, things move towards continuous remote access. For the DeepNL project in Groningen [a province in the north of the Netherlands plagued by induced seismicity related to gas extraction, 17], I developed a more elaborate communications system that would allow you to remotely gain access to the datalogger and control the instrument, again via the mobile phone network. Data transfer also takes place like this. The modem does consume a lot of energy, though, so I built a board which in wintertime, when there’s not enough sunshine, only turns on the modem for 15 minutes every six hours. It has a built-in override option that can be triggered by SMS such that I can still log on to an instrument to check up on how it’s doing. This system has already saved me several 2 hr drives to Groningen, and we installed something similar in the Botswana instruments just before the handover.”
I aim to make it completely accessible for someone with brains and some patience to home-build a seismometer…
DIY seismology
Now that corona has slowed down his usual work, Arie has also returned to a pet project of several years: a DIY seismometer. This is based on the Yuma2 design by David Nelson and Brett Nordgren [18], a simple broadband force-balance vertical seismometer made with a leaf spring.
“I aim to make it completely accessible for someone with brains and some patience to home-build a seismometer for, say, less than €200. The original design features a solid steel base, but I’ve replaced that with a 3-D printed design. If it is still stable, this cuts the need for sophisticated metal-working machines that not everyone has access to. I also want to see if there are parts of the design I could simplify without sacrificing performance. Oh, and convert all the units to metric – those 1/8 inches are driving me crazy!”
He shows me the prototype he’s been working on – working title Yuma3D. Although functional already, it’s nowhere near finished: to balance it, you currently need to move a loose nut around over the plate, until you find the balance point.
“It’s still very much work in progress. I also have no idea how stable it is – the original design has a pretty good noise response, but I don’t know how the plastic base changes that. When I get around to finishing it, I’ll have to bring it to the bunker for some proper testing.”
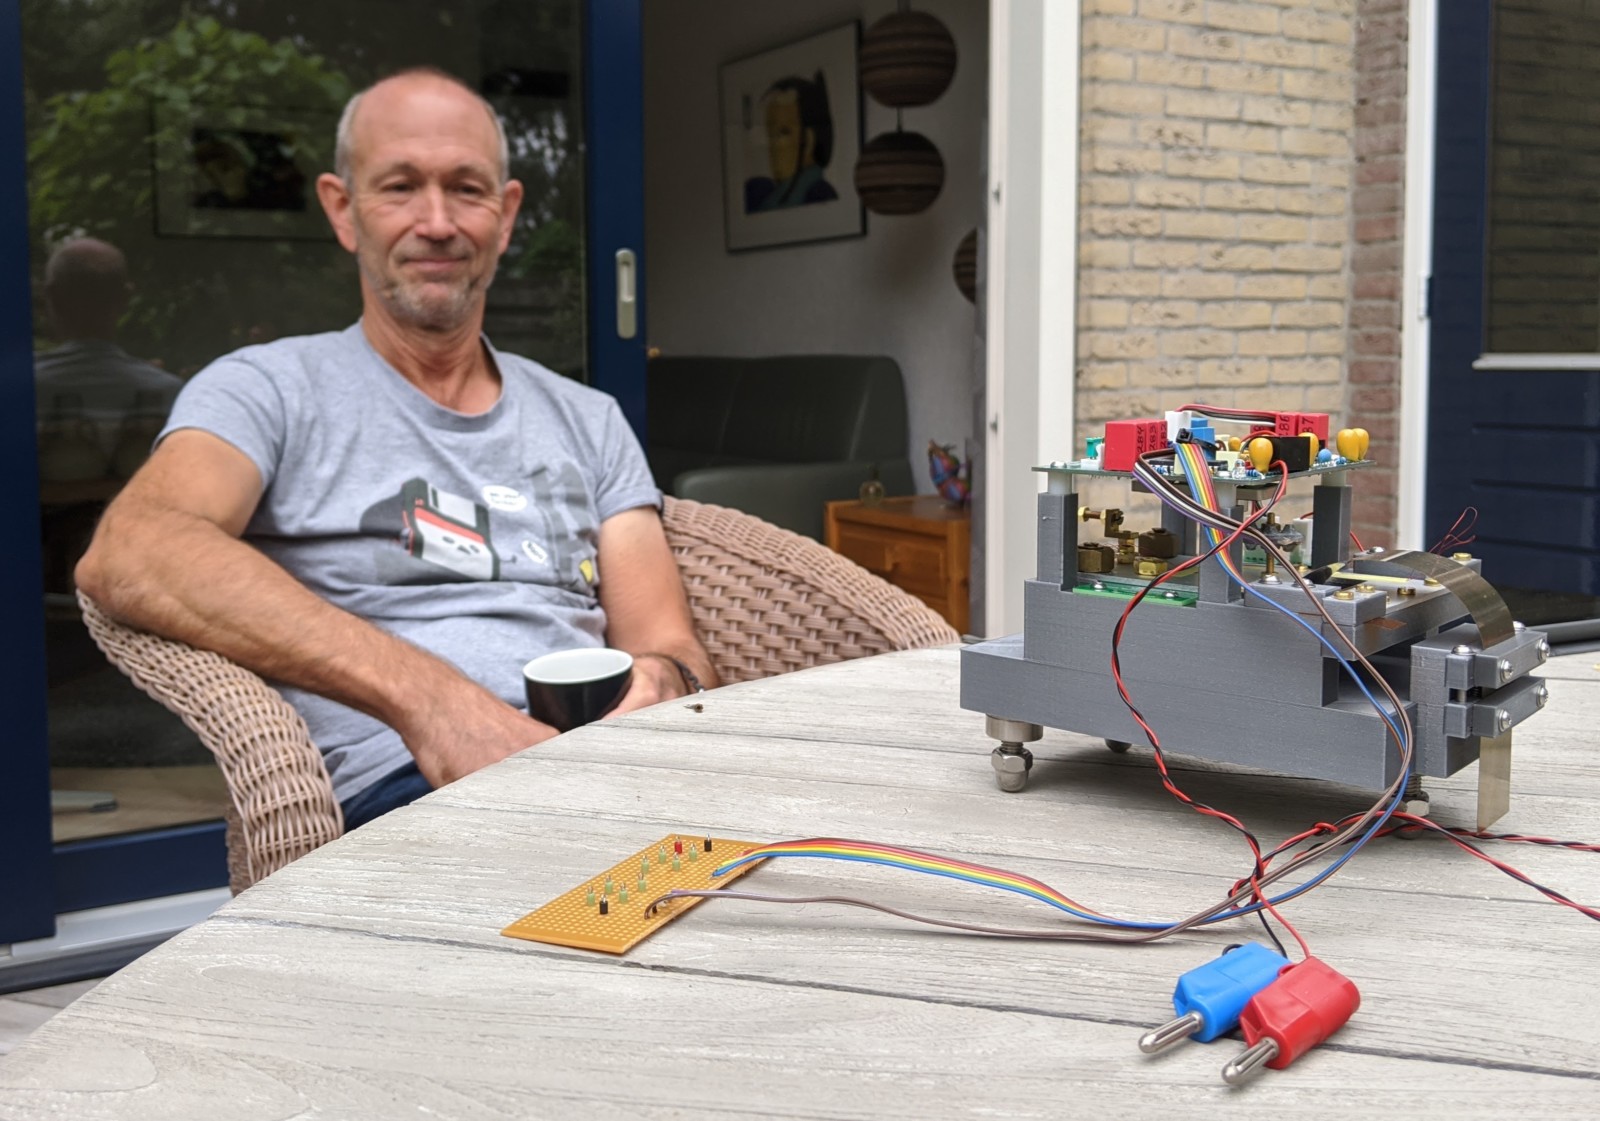
Figure 6 | Arie’s Yuma3D prototype. The bolts that form part of the design have actually been placed during the 3-D printing. By allowing just the right amount of empty space in the print design and inserting the bolts during the printing process, the thread of the bolts gets moulded into the plastic, and so you can still screw and unscrew them.
If you are the person responsible for something, you give it your best 110%.
A new Arie, or a new era?
After nearly 40 years in the game, retirement is now getting closer. He looks pensive when I ask him about whether there will soon be a new Arie.
“Look, a dedicated technician for a research group definitely has advantages. If you are the person responsible for something, you give it your best 110%. If something doesn’t work, or breaks, I feel bad about it, and I do my bloody best to repair it. I often hear complaints from scientists at different institutes who rely on a pool of generic technicians – often you’ll get a ‘I need to go home now’, or ‘come back next week’. And of course, I’ve done everything a thousand times, so I know to steer clear of all the rookie mistakes – I already made all of those in the 1980s!”
“But I also see that things are changing. More and more things just work out of the box, and function more or less autonomously. Even if something breaks, the electronics nowadays are so small and sensitive that anyway you’d need to send it back to the manufacturer for repair. It shifts the needs from knowledge of electronics and building stuff to networking and software. Once the telecommunication is working properly, all the time spent going into the field will drop away, save for a deployment and retrieval once every few years.”
“But I’ve thoroughly enjoyed the time. I’ve seen so many people come and go, and had so many good experiences here in Utrecht and in all these remote places. And even when I retire, I’ll have plenty of projects to keep myself from being bored. Maybe I’ll finally finish that atom clock I’ve been working on…”
References
[1] G. Nolet, N.J. Vlaar, 1982. The NARS project: probing the Earth with a large seismic antenna, Terra Cognita, 2, pp. 17-25
[2] J. Oliver, L. Murphy, 1971. WWNSS: Seismology’s network of Observing stations. Science, 174, 4006, pp. 254-261.: https://www.jstor.org/stable/1732155
[3] Peterson, Jon, and Hutt, C.R., 2014, World-Wide Standardized Seismograph Network—A data users guide: U.S. Geological Survey Open-File Report 2014–1218, 74 p.: https://dx.doi.org/10.3133/ofr20141218.
[4] NARS webpage: http://www.geo.uu.nl/Research/Seismology/nars.html
[5] G. Nolet, B. Dost, H. Paulssen, 1986. Intermediate wavelength seismology and the NARS experiment, Ann. Geophys., 4, pp. 305-314: https://www.researchgate.net/profile/Bernard_Dost/publication/316610399_Intermediate_wavelength_seismology_and_the_NARS_experiment/links/5c388b44a6fdccd6b5a37394/Intermediate-wavelength-seismology-and-the-NARS-experiment.pdf
[6] Nolet, G., Dost, B., Paulssen, H., 1991. The NARS array (1983–1990). In: Boschi, E., Giardini, D., Morelli, A. (Eds.), Proceedings of the 1st Workshop on MedNet: The Broad-band Seismic Network for the Mediterranean. pp. 76–82.
[7] “Seismologen maken aarde zichtbaar”, Algemeen Dagblad, 26 March 1988
[8] “Politieke beving gooide Russische aardkorst open”, Trouw, 26 January 1994
[9] Wikipedia page on the GOES satellite sysem: https://en.wikipedia.org/wiki/Geostationary_Operational_Environmental_Satellite
[10] Wikipedia page on the DCF77 longwave time radio: https://en.wikipedia.org/wiki/DCF77
[11] Wikipedia page on the Valle de los Caídos: https://en.wikipedia.org/wiki/Valley_of_the_Fallen
[12] A Trnkoczy, “Understanding and parameter setting of STA/LTA triggering algorithm”, GFZ Information Sheet IS 8.1: https://gfzpublic.gfz-potsdam.de/rest/items/item_4097_2/component/file_4098/content
[13] H. Paulssen, B.G. Bukchin, A.P. Emelianov, M. Lazarenko, E. Muyzert, R. Snieder, T.B. Yanovskaya, “The NARS-DEEP Project”, Tectonophysics, Volume 313 (1–2), pp 1–8: https://doi.org/10.1016/S0040-1951(99)00186-9
[14] Wikipedia page on DAT tapes: https://en.wikipedia.org/wiki/Digital_Audio_Tape
[15] Kolawole, F., Atekwana, E. A., Malloy, S., Stamps, D. S., Grandin, R., Abdelsalam, M. G., Leseane, K., and Shemang, E. M. (2017), Aeromagnetic, gravity, and Differential Interferometric Synthetic Aperture Radar analyses reveal the causative fault of the 3 April 2017 Mw 6.5 Moiyabana, Botswana, earthquake, Geophys. Res. Lett., 44, 8837– 8846 https://doi.org/10.1002/2017GL074620
[16] Materna, K., Wei, S., Wang, X., Heng, L., Wang, T., Chen, W., Salman, R., & Bürgmann, R. (2019). Source characteristics of the 2017 Mw6.4 Moijabana, Botswana earthquake, a rare lower-crustal event within an ancient zone of weakness. Earth and Planetary Science Letters, 506, 348-359: https://doi.org/10.1016/j.epsl.2018.11.007
[17] DeepNL project: https://www.nwo.nl/en/research-and-results/programmes/DeepNL/
[18] B. Nordgren’s website containing information on the Yuma2 seismometer: https://bnordgren.org/seismo/FBV/
This interview was conducted and written by ECS representative Nienke Bloom
with revisions from ECS representative Maria Tsekhmistrenko.