As lockdowns have come in place all over the globe, workplaces have closed, people are sticking to their homes, and perpetual traffic jams have reduced to a trickle [1]. This results in eerie sights, where the lone bypasser walking through deserted streets cannot but wonder whether they’ve accidentally missed the memo on the apocalypse.
The world is coming to a halt and this results in… silence. Notable improvements in air quality have already been observed in many areas [2] as well as the return of wild animals in places deserted by humans [3]. Seismologists all over the world are now also recording a marked decrease in seismic noise level associated with anthropogenic activities, coinciding with the onset of lockdowns.
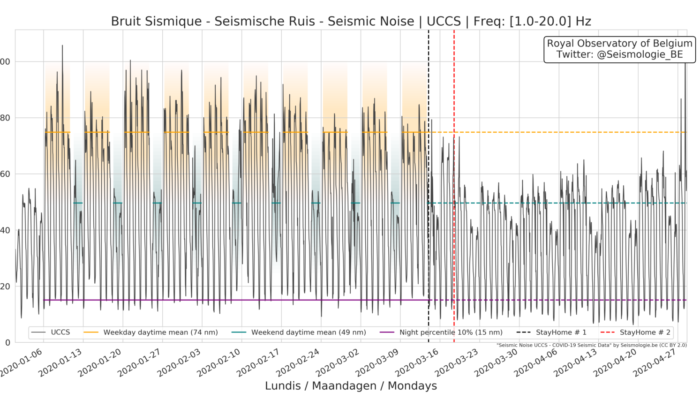
Thomas Lecocq, a seismologist at the Royal Observatory of Belgium, a specialist of ambient seismic noise analysis and a Python lover, knew what to look out for. Snowy days and big strikes tend to result in a drop in seismic noise levels, so he was all set to record the sound of Covid-silence and see what seismic instruments can tell us about the impact of the pandemic on society. And indeed, as soon as lockdowns in Belgium came into force mid-March 2020, the city turned quiet (Figure 1, for a station in Uccle, just south of Brussels).
The weekdays quietened down to pre-Covid weekends, the weekends all turned into January 1st, and with no bars or restaurants to go to, the nights became almost rural. Thomas also posted the results on social media. As he told us, “I wanted to use it to show and motivate people: Stay at home, it’s working, we can see it!”
To make the plots, Thomas computed power-spectral-densities (PSD, functionality included in ObsPy [4]), and computed the root-mean-squared displacement over half-hourly intervals for frequency bands where typically anthropogenic noise can be found (1-20 Hz, in the case of Fig. 1).
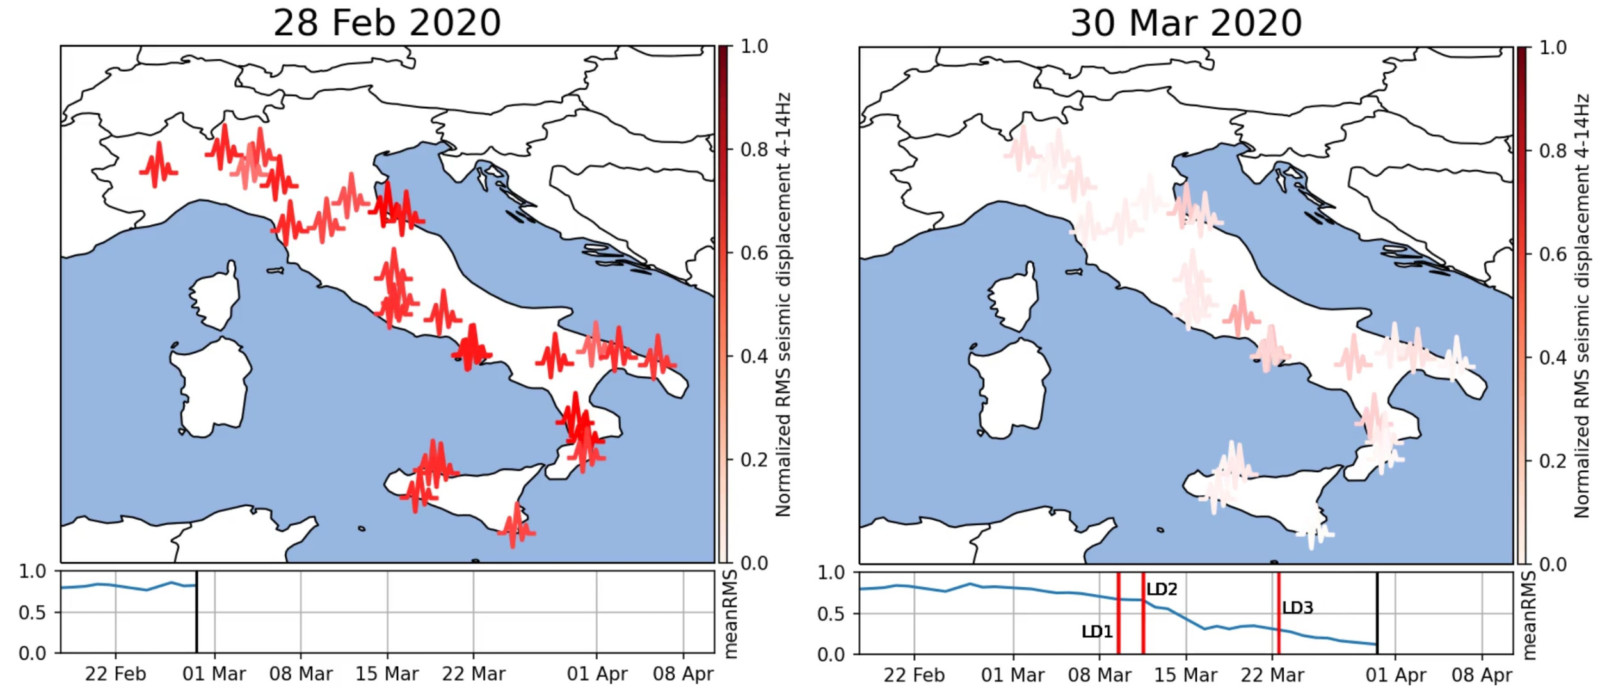
Fig. 2: Two stills from a video produced by Flavio Cannavò and Andrea Cannata showing the levels of anthropogenic seismic noise before and after lockdown measures came into force [9]. To produce this video, only data from weekdays was used, as weekends already result in a significant drop in noise (see Fig. 1). Data source: INGV Seismological Data Centre [11].
What Thomas didn’t quite expect was the extent to which this would be picked up.
Colleagues from all over the world started sharing on social media their own noise plots, with everywhere the same pattern: as places went into lockdown, the Earth’s buzz became a whisper. Of course, the differences aren’t the same everywhere. Stations in or near big cities show a large drop in noise, whereas remote stations are quiet as ever.
Media soon caught wind of their efforts and the number of (non-scientific) articles mentioning the word ‘seismology’ or ‘seismic noise’ temporarily skyrocketed [e.g. 6, 7, 8, 9] – not a usual sight for this field of work. The effect of these lockdowns is especially notable in those areas most hard-hit by the pandemic. Figure 2 shows two stills from a video produced by Flavio Cannavò and Andrea Cannata, who investigated the change in seismic noise levels across the length of Italy [10].
The obvious next step was to formalize these efforts into some more serious science. “It was clear we were acting ‘as a community’ there,” Thomas says, and so he put a call out on Twitter for a large collaboration on Covid noise [12] and also contacted about 30 people by e-mail – “on April 1st, not my best idea”.
Currently, there are 59 collaborators on a Slack channel, all brainstorming and sending around ideas. “Yes, it’s a bit crazy,” Thomas concedes (it has been said before that managing scientists is like herding cats), but he’s hopeful to have a paper in the foreseeable future “and probably sparkle a large number of other studies!”
Want to visualize the noise at your seismic station? The code that produced Fig. 1 can be found on GitHub [5].
This blog post was written by Nienke Blom
with revisions from Walid Ben Mansour and Javier Ojeda
-> Go back to the blog series
_____________________________________________________
References
[1] Snapshots of a world in lockdown: “The crisis has crossed a new threshold”
https://www.theguardian.com/global-development/2020/apr/22/snapshots-of-a-world-in-lockdown-the-crisis-has-crossed-a-new-threshold
[2] Coronavirus: lockdown’s effect on air pollution provides rare glimpse of low carbon future
https://theconversation.com/coronavirus-lockdowns-effect-on-air-pollution-provides-rare-glimpse-of-low-carbon-future-134685
[3] The urban wild: animals take to the streets amid lockdown-in pictures
https://www.theguardian.com/world/gallery/2020/apr/22/animals-roaming-streets-coronavirus-lockdown-photos
[4] McNamara, D. E., & Buland, R. P. (2004). Ambient noise levels in the continental United States. Bulletin of the seismological society of America, 94(4), 1517-1527.
https://doi.org/10.1785/012003001
[5] Source code to produce displacement RMS plots as a function of time.
https://github.com/ThomasLecocq/SeismoRMS
[6] The coronavirus pandemic is making Earth vibrate less.
https://edition.cnn.com/2020/04/02/world/coronavirus-earth-seismic-noise-scn-trnd/index.html
[7] Coronavirus lockdowns worldwide make Earth’s crust move less, scientists find.
https://www.independent.co.uk/news/science/coronavirus-lockdown-earth-move-vibrate-seismic-noise-thomas-lecocq-a9445346.html
[8] Coronavirus turns urban life’s roar to whisper on world’s seismographs.
https://www.nytimes.com/2020/04/08/science/seismographs-lockdown-coronavirus.html
[9] These charts show how coronavirus has ‘quieted’ the world.
https://www.nationalgeographic.com/science/2020/04/coronavirus-is-quieting-the-world-seismic-data-shows/
[10] Flavio Cannavò: Reduction of anthropogenic seismic noise in Italy due to COVID19 lockdown.
https://twitter.com/flaviocannavo/status/1253723170454097920?s=20
[11] INGV Seismological Data Centre. (2006, January 1). Rete Sismica Nazionale (RSN). Istituto Nazionale di Geofisica e Vulcanologia (INGV), Italy.
https://doi.org/10.13127/SD/X0FXNH7QFY.
[12] Thomas Lecocq: Twitter call to write a Covid-noise paper.
https://twitter.com/seismotom/status/1245223281671786497?s=20