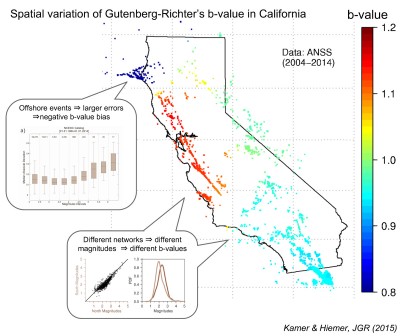
The b-value is that parameter of the Gutenberg-Richter relation which controls the ratio of small to large earthquakes. Intriguing temporal and spatial variations of the b-value have been reported in recent years, for example sudden b-value changes at active fault zones.
Are such sharp spatial b-value variations merely a result of crude undersampling? To address this unsettling question, a recently published study presents a data-driven spatial subdivision to spare researchers arbitrary judgment on how to delineate different regions. Instead of a human researcher, the Bayesian information criterion decides on how many earthquakes are ‘enough’ to reliably estimate the b-value for one region. The study reports ‘irreconcilable differences’ with previously published b-value mapping techniques.
Applied to California, the new approach indeed shows significant b-value variations, but they occur on rather large spatial scales and can largely be attributed to biases induced by our limited capabilities to detect and record seismic events. A notable exception is the geysers geothermal region, where small events are actually more dominant than elsewhere, probably due to a different physical origin: many of these small events are geothermal rather than tectonic.
Does this prove the existence of small-scale b-value variations wrong? It doesn’t. The problem could rather be summarized as ‘what’s one seismologist’s noise is another one’s signal’: With larger subregions, the authors of the present study average out small fluctuations, which they — or rather the Bayesian information criterion — regard as random. Other researchers argue these are physically meaningful signals, even though observations might be scarce.
So…how should one be mapping b-value variations? Engaged debate on the procedure is certainly no harm to science. If you’d like to form you own opinion, read more here.
