By Aris Kwadijk, PhD candidate, Mountain Hydrology group, Department of Physical Geography at Utrecht University, and Walter W. Immerzeel, Professor, Mountain Hydrology group, Department of Physical Geography at Utrecht University. Email: a.kwadijk@uu.nl, w.w.immerzeel@uu.nl. Website: https://www.uu.nl/medewerkers/AKwadijk, https://www.uu.nl/medewerkers/WWImmerzeel.
Was the catastrophic flood wave in the Himalaya on 26 August a consequence of climate change, and therefore the fault of the major CO₂ emitters, as a Nepalese minister suggested? The puzzle of what exactly caused it has not yet been fully solved.
‘We are paying the ultimate price for a global crisis we did not create.’ With these words, on 1 September, Nepal’s Minister of Foreign Affairs, Shisir Khanal, placed responsibility for the disaster of 26 August on the major emitters: India, China and the United States.
Three days later he moderated that position: he was not asking these countries for compensation, but he did call for the disaster to be seen in the context of climate change. Is this attribution of responsibility justified? And what role can the scientific community play in answering this question and in improving early warning systems? The debate is still ongoing, but let’s look at what we already know.
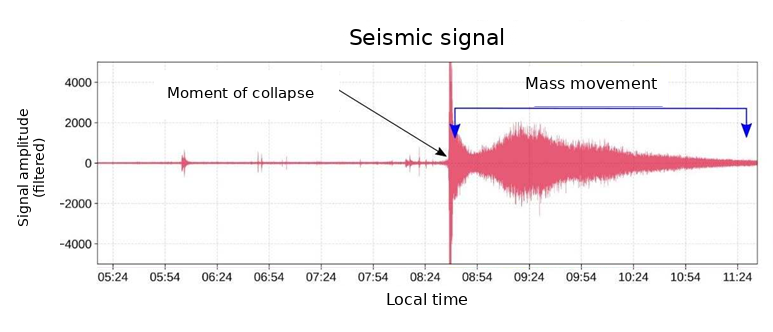
Figure 1: The seismic signal recorded nearby. Source: S. Subedi.
Unusual seismic signal
On 26 August at 08:37 local time, seismological stations detected an unusual signal near the Nepal–Tibet border in Rasuwa district (Figure 1). At first, it was thought to be a magnitude 5.2 earthquake, nothing unusual for the Himalaya, where small earthquakes occur regularly.
But the signal differed from what we normally observe. The seismometers had not recorded an earthquake, but the impact of a gigantic mass of glacier ice and debris crashing down, which then surged down the Trishuli River system as a flood wave.
The impact could be heard across a wide area. Residents of the nearby Langtang valley thought a bomb had struck. Seismometers 2,000 kilometres away also registered it. A reconstruction shows that the flood wave reached the first village, Timure, seven minutes later, travelling at speeds above 175 km/h.
The residents of the upstream villages stood no chance. Further downstream, the government did issue warnings, but many people did not take them seriously. The scale of what was coming was simply unimaginable. Even people who believed they were safe high above the river were killed. The latest figures from the United Nations report more than 1,500 dead and nearly 5,600 still missing.
The first hours after the disaster
That same day, more than eighty scientists from around the world gathered in a Slack workspace to share the latest findings and communicate them to the media. The source of the disaster was quickly identified: Langtang Lirung, a steep 7,200 m peak located upstream in the Trishuli River system. On this mountain lay a glacier whose tongue rested on a steep mountain flank.
Using satellite data, recent elevation maps, photographs, and seismic data, a reconstruction of the disaster was made. A substantial part of the mountain flank on which the glacier tongue rested had suddenly collapsed. The detached area covers about 2.1 square kilometres. Based on recent elevation maps, an estimated volume of 110 to 130 million cubic metres, 80–90% of it debris, fell about 1.5 kilometres vertically. The enormous amount of potential energy was partly converted into heat by the high pressure and friction in the system. It is hypothesized that this heat partly melted the ice, reducing the viscosity of the mixture. The ground was also relatively wet because the monsoon was almost at its end. This added more water and created a highly mobile mixture of water and debris that carved its way through the valley, entraining more mass along its flow path.
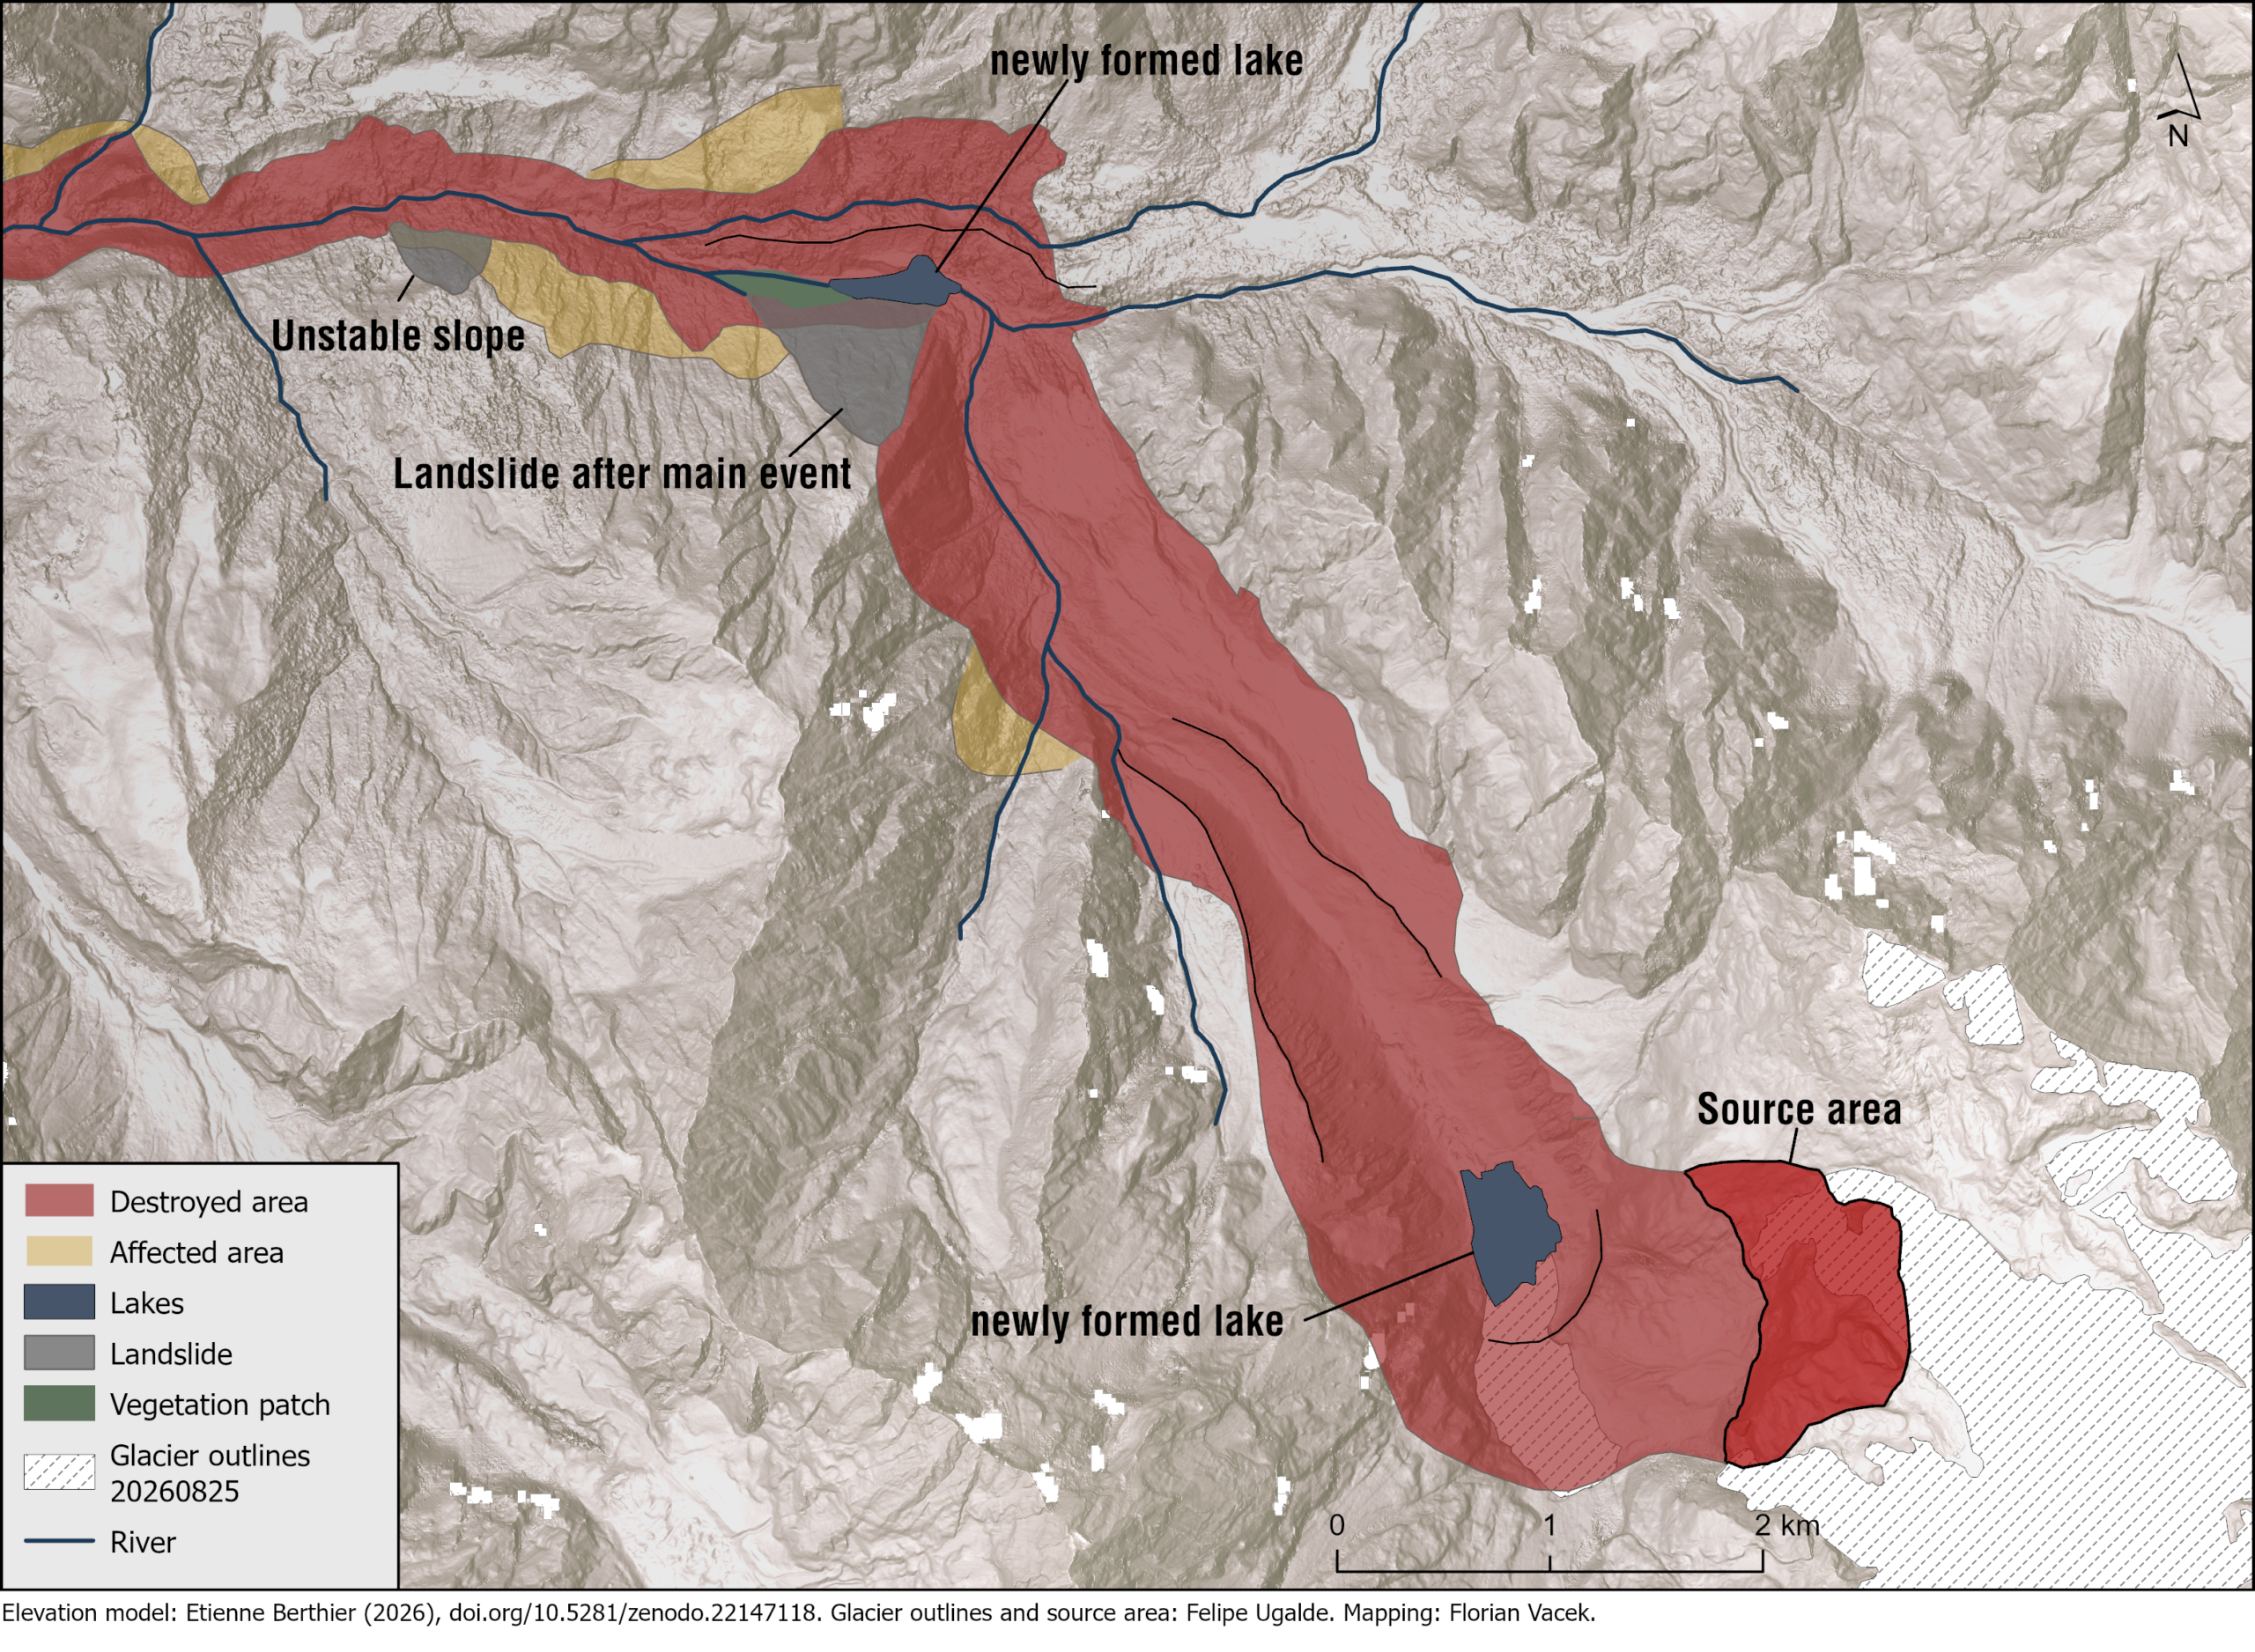
Figure 2: The morphological units in the source area of the collapse. Source: F. Vacek.
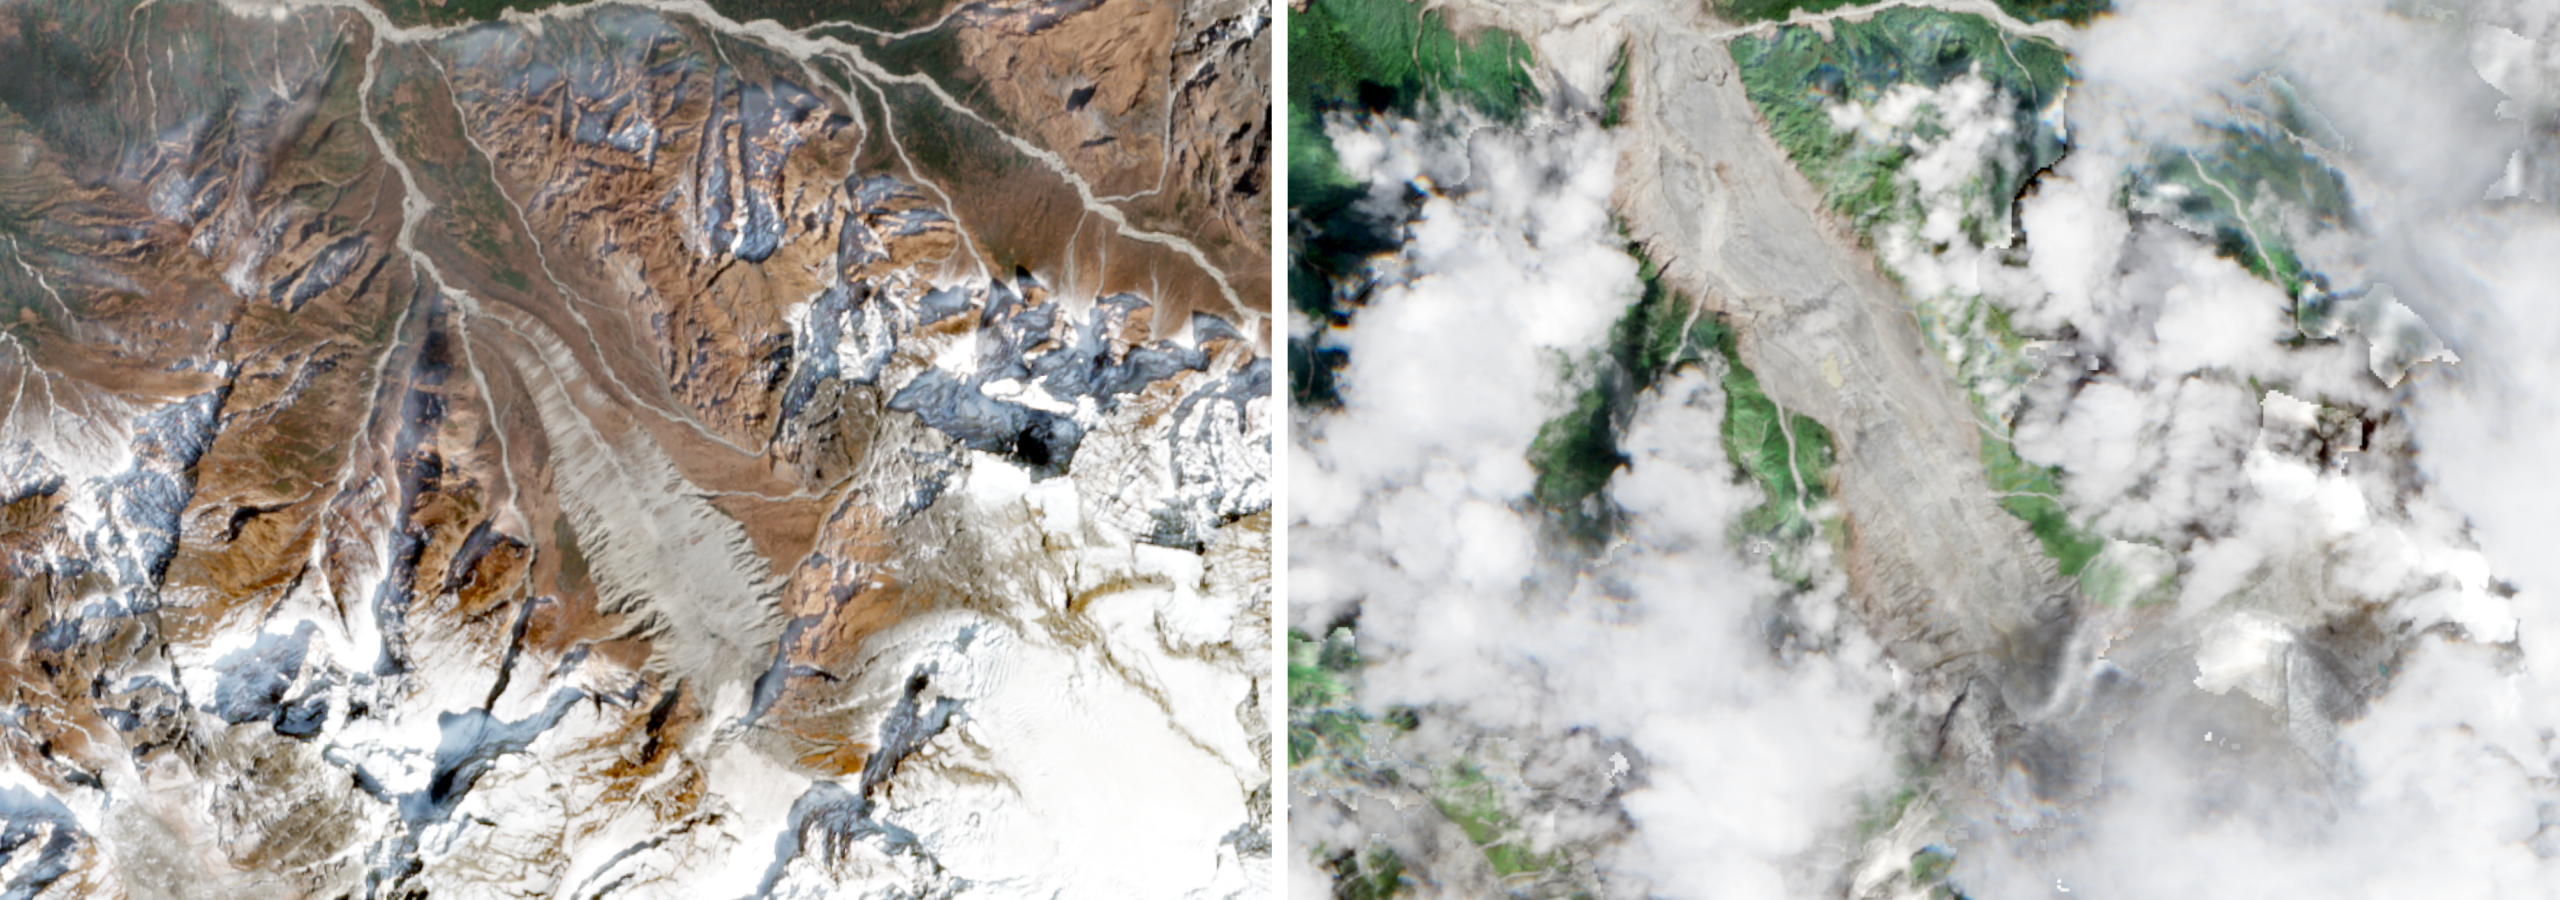
Figure 3: Satellite images of a trail of erosion in the upstream area after the disaster (left) and before it (right). Source: Copernicus.
A consequence of this abrupt erosion of the valley sides was that the slopes on either side of the valley became unstable. One landslide created a new lake near the source area. For a while there were fears that this lake, too, would drain suddenly, posing an extra risk to the survivors and rescue workers in the riverbed. In the end, the lake drained gradually and caused no further casualties.
The cause
Langtang Lirung is already being described as a repeat offender: eleven years earlier, during the 2015 Gorkha earthquake, the south side of Langtang Lirung was also the scene of a disaster. The earthquake triggered a rock-ice avalanche that wiped out the entire village of Langtang. Geological field measurements on the south side of Langtang Lirung show that it is made up of hard leucogranite sills alternating with weaker, thinly bedded layers of metapsammite (metamorphosed sandstone). We also see that the bedding is almost planar and dips steeply (Figure 4). These steep planes, alternating with weak layers, create ideal conditions for this kind of rock-ice avalanche. In addition, more than two hundred smaller earthquakes have occurred in the area since 2015, which may have further weakened the slope.
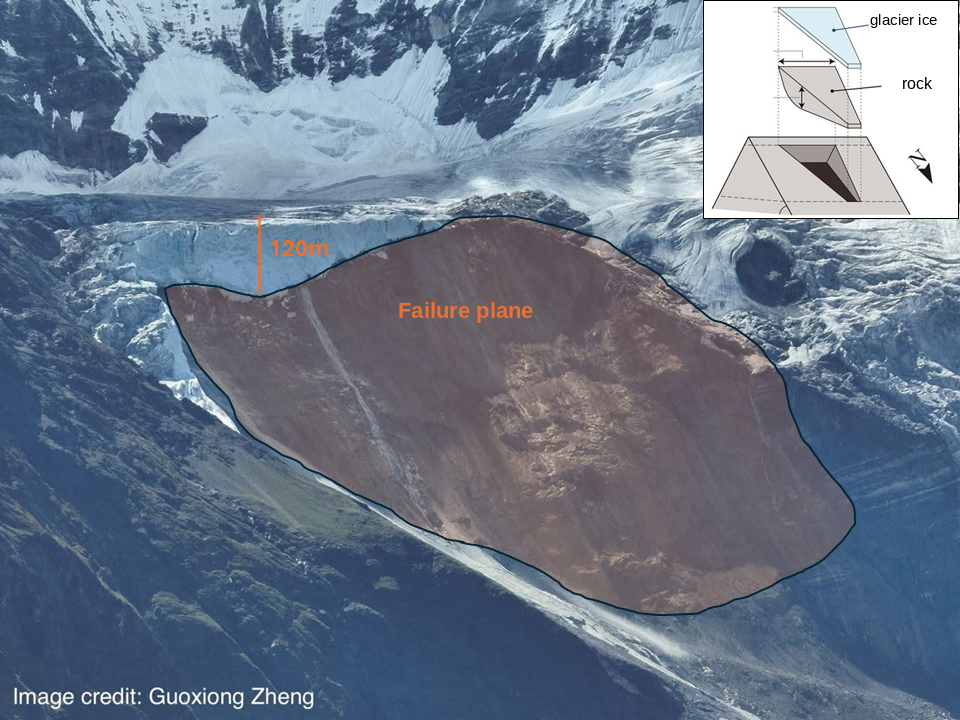
Figure 4: Failure plane beneath the former glacier tongue. Source: after Shugar et al. (2021).
On top of this bedrock lies a glacier. It has been retreating since the end of the Little Ice Age (around 1850), but since 2015 the rate of retreat has doubled compared with the years before. As a result, the glacier tongue has withdrawn further up the steep mountainside, to an altitude of 5,100 m. This retreat reduces the buttressing effect of the glacier on the underlying rock, making the slopes less stable.
As the glacier retreats, new slopes are exposed at the surface and subjected to ongoing weathering. Permafrost thaw and freeze–thaw cycles accelerate as the zero-degree isotherm moves upward. And as more precipitation falls as rain instead of snow, water can also move more quickly through fractures in the rock. These processes play out over several years, preconditioning the slope for failure. Photos of the failure plane in the aftermath show clear signs of iron oxidation, which indicate that these processes are likely occurring here. We are seeing this accelerated slope instability in mountain regions worldwide. This year, well-known routes up Mont Blanc and the Matterhorn were already life-threatening early in the season because of frequent rockfall.
Researchers from the mountain hydrology group at Utrecht University carry out meteorological measurements in the Langtang valley, one valley south of the disaster area. These show that the average freezing level lies between 5,000 and 6,000 m in this area. This average has shifted further upward in recent years, a direct consequence of rising temperatures. During the monsoon, the temperature drops by 5 to 6 °C per kilometre of ascent. One degree of warming therefore shifts the freezing level upward by 170–200 m. Over the period 2006 to 2024, the freezing level rose by an average of 8.7 metres per year.
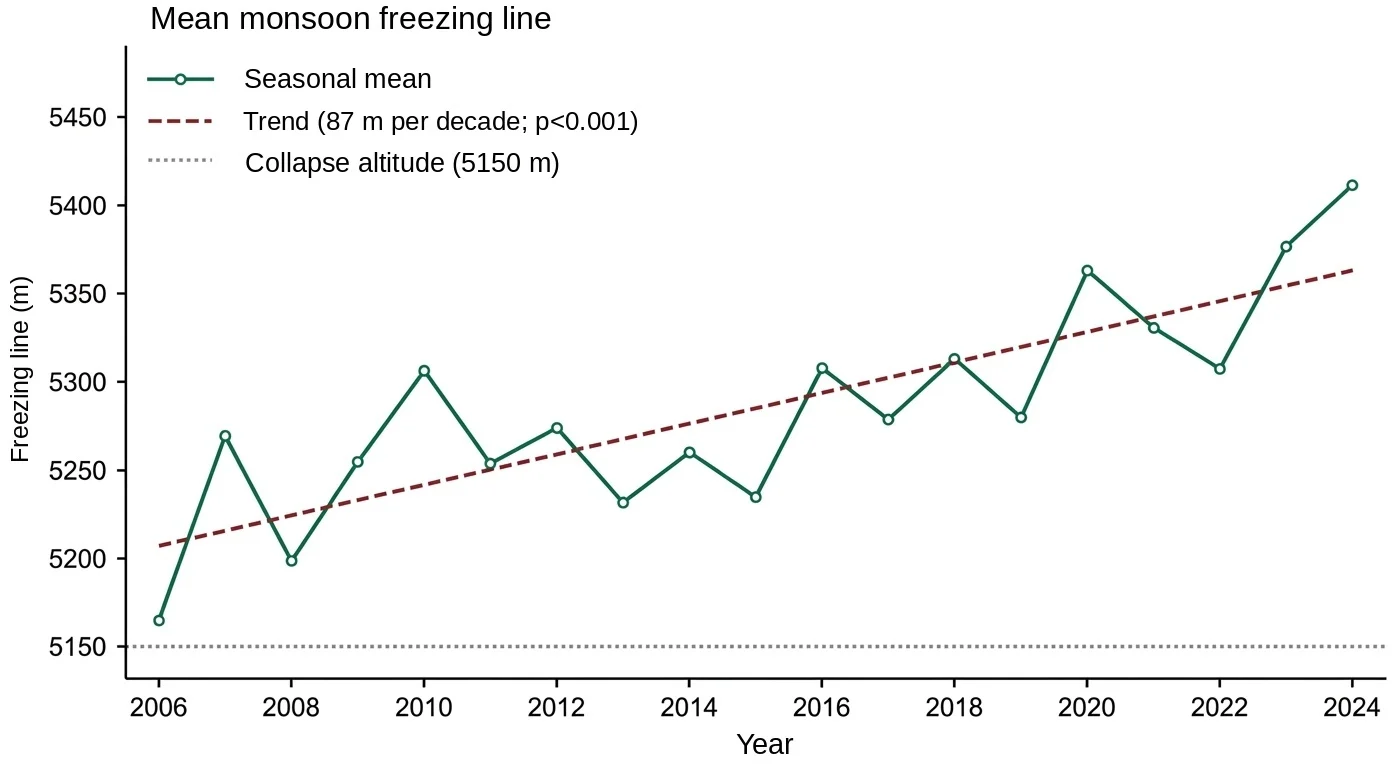
Figure 6: Seasonal mean freezing level (metres above sea level) during the monsoon over the period 2006–2024. Based on the WRF weather model. Source: W.W. Immerzeel, R. Wijngaard.
In addition, an unusually large amount of snow fell in this area in October 2025, and the months before the disaster were exceptionally warm. Ongoing research is examining whether the resulting meltwater may have been a direct trigger.
All these processes can occur side by side and operate on different timescales. The geological setting created the preconditions for this disaster. But climate change is accelerating the weathering processes that further destabilize these slopes, making them more likely to fail. Disasters like this are becoming more frequent, and this trend is expected to continue.
A central question in climate change attribution is what standard of proof we should apply. Should we attribute a disaster to climate change only when its role has been established beyond doubt, in line with the legal principle of ‘innocent until proven guilty’? For events like this, where data are scarce, that would be extremely challenging. Or should the burden of proof be reversed, so that those who deny the role of climate change in this disaster must demonstrate with a hundred percent certainty that it played no part? Another option is to apply a balance of probabilities, attributing the event to climate change when it is more likely than not to have been the trigger.
Whether this standard could be used in an actual climate lawsuit, such as a possible compensation claim by Nepal against the largest emitters, or a claim on the UN Fund for responding to Loss and Damage, remains an open question. In the coming months, further research on the disaster is expected to clarify whether, and to what extent, climate change played a role. It will be interesting to follow how these findings develop and how they might be weighed in a legal context.
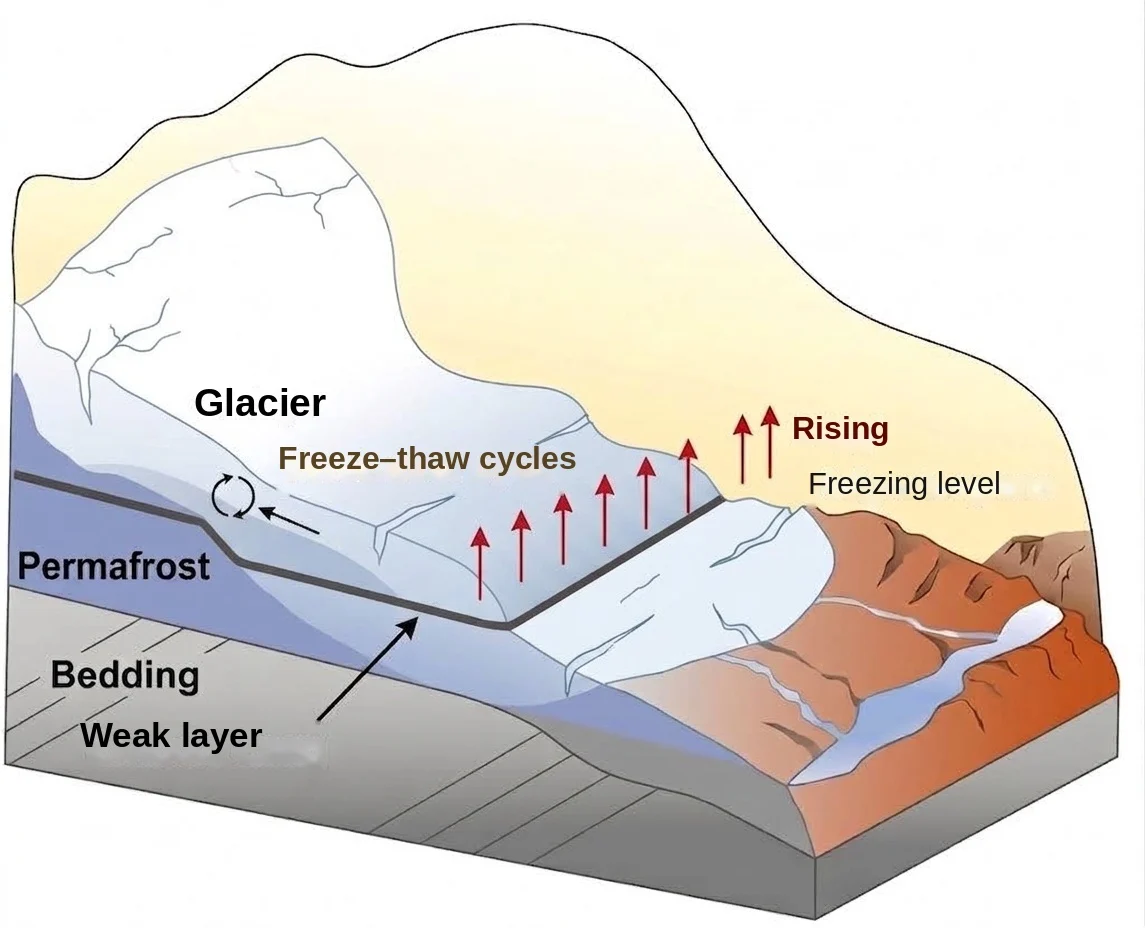
Figure 7: Schematic representation of the processes contributing to the collapse of the mountain slope at Langtang Lirung. Source: after Ye et al. (2026).
Could the disaster have been foreseen?
A more relevant question for the Nepalese living in the affected area is whether this disaster could have been foreseen. Analysis of the source area shows that the slope had moved 15 cm compared with the previous year. In hindsight, that could have been a warning sign. But Nepal has thousands of glaciers, and glacier ice on weak slopes like these can move 10 to 200 metres per year. That makes it difficult to monitor the rock beneath it using satellite imagery.
The biggest problem is the lack of continuous ground-based measurements, which are hard to collect in such inaccessible terrain. And even if we detect movement in the rock beforehand, it remains difficult to predict exactly when the collapse will occur. Frequent false alarms cause people to lose trust in such systems and stop taking warnings seriously.
Still, we see that ground observations combined with satellite observations are an effective way to anticipate situations like this. In the municipality of Blatten, in Switzerland’s Lötschental, villages were evacuated last year after increasing rockfall and movement of the mountain flank. Using InSAR, a technique that uses radar observations from satellites, displacements could be measured with millimetre precision. Unlike optical imagery, radar is not blocked by cloud cover. Although these villages were completely destroyed, only one person ultimately died. This shows that applications like these deserve more attention in vulnerable mountain regions such as the Himalaya in the future.
References
- Hetényi, G. (2026). Devastating earthquake-triggered flood in the Himalaya. OROG3NY, 26 August 2026.
- https://www.youtube.com/watch?v=CyWsxPKVSRQ&t=2569s
- Shugar, D.H. et al. (2021). A massive rock and ice avalanche caused the 2021 disaster at Chamoli, Indian Himalaya. Science 373(6552). DOI: 10.1126/science.abh4455
- Ye, J. et al. (2026). Freeze-thaw cycles control successive glacier landslide hazards in Amney Machen Mountain. Springer Nature 23, 2117–2134.