
Welcome to ”Climate Change through a Geomorphological Lens”, a blog series exploring the changing climate from a geomorphological perspective.
This first post was inspired by a single figure in the Intergovernmental Panel on Climate Change’s Sixth Assessment Report [1]. It compares precipitation change per degree Celsius of warming across different climate models and observations for three time categories: global mean, 24-hour extremes, and sub-1-hour extremes. Figure 1 shows that observed changes per degree of warming are five times greater for sub-hourly extremes than for daily extremes. In other words, heavy rainfall increases roughly five times more for events lasting less than an hour than for events lasting a full day. In comparison, the regional climate model (RCM/CRM) shows only a small difference between daily and hourly rainfall. This gap matters because risk assessments often rely on daily rainfall data and regional-scale projections of erosion and landscape change, yet erosion responds to hourly rainfall that averages out in the daily rainfall data. Moreover, the hourly rainfall is just the trigger. The damage comes later, as landslides, debris flows, and sediment pulses reshape channels and create new hazards [7].
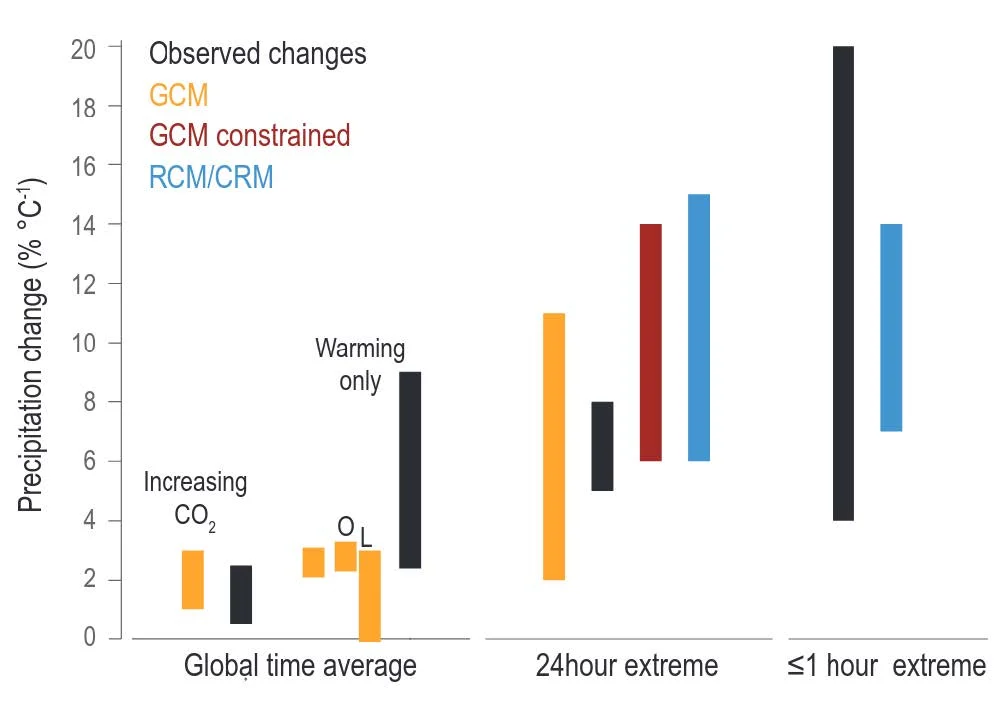
Figure 1: Precipitation change per degree of warming (% °C⁻¹) across three time scales. Rainfall changes intensify with shorter timescales — from about 2–3% per increase in degrees Celsius for the global mean to over 15% per increase in degrees Celsius for sub-hourly extremes. The colored bars compare estimates from observations (black), global climate models (GCM and GCM constrained, yellow and red), and regional climate models (RCM/CRM, blue). Source: IPCC 2021.
With our changing climate, understanding these short-term rainfall extremes is becoming more important. The key question is not only how much rain the landscape will receive, but also when it will fall and how the landscape will respond during these extreme events. This is not a hypothetical question. In just two hours on 29 May 2016, a small catchment in southern Germany – site of the devastating Braunschbach flash flood – received 131 mm of rain, with a peak five-minute intensity of 157 mm/h [4,5]. As a result, the Orlacher Bach transformed into a debris flow that buried part of the town under 42,000 m³ of boulders, gravel and mud. The resulting flow reached a height of 3.5 m and damaged more than 80 buildings, five of which were destroyed [4].
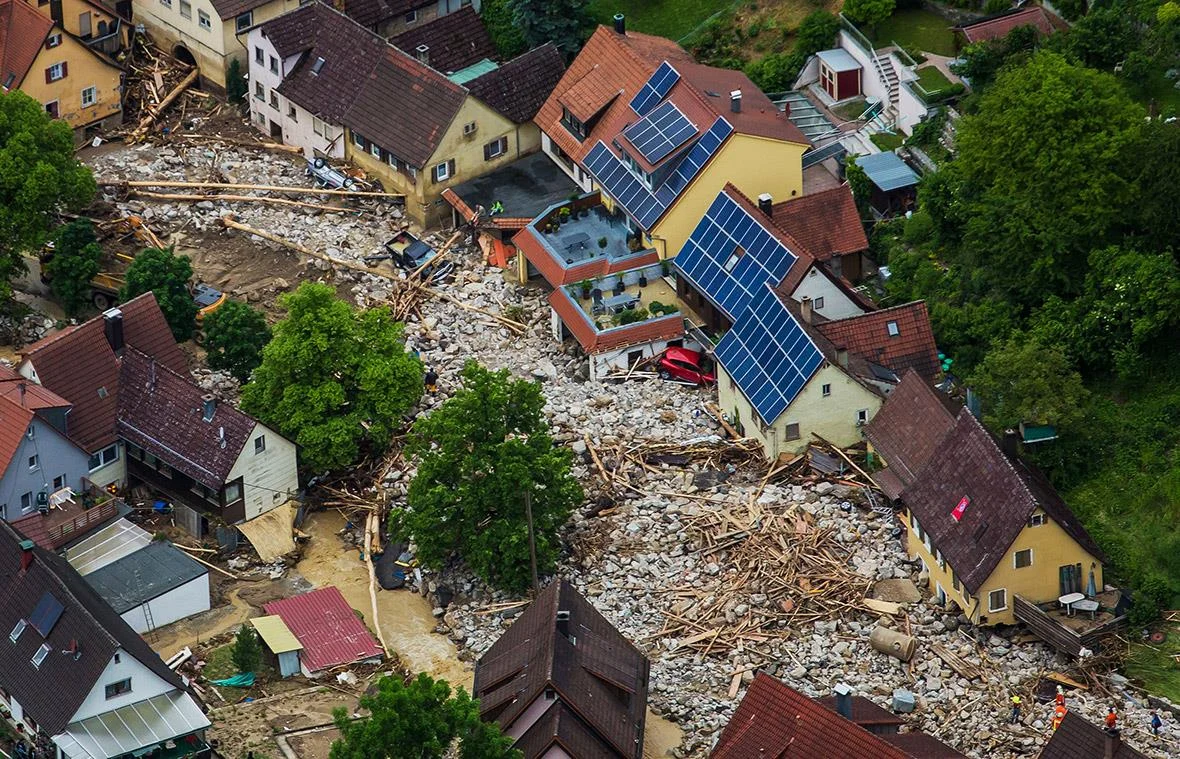
Figure 2. Damage caused by the 29 May 2016 flash flood in Braunsbach, Germany. Photo: Kai Pfaffenbach/Reuters, 30 May 2016.
Landscape Evolution Models (LEMs) help predict geomorphological changes over years to millennia, but they must capture the storm hours that move sediment [2]. However, high-resolution modelling requires large amounts of data and substantial computing power, making it impractical to replay every plausible extreme event at hourly resolution. Surrogate modelling offers a bridge: a few detailed process-based simulations can train a fast, inexpensive surrogate model, opening thousands of rainfall and landscape scenarios at a fraction of the cost [3]. It can also make sensitivity analysis of LEM parameters affordable, revealing which parameters most strongly control simulated output (e.g. discharge, sediment flux) [6]. The aim is not to perfectly reconstruct events whose details were never observed, but to use the available information to identify where, when, and under what rainfall conditions major geomorphic change is likely. This approach turns the missing hours of past disasters into information that can help prevent the next one.
References:
1. IPCC 2021 – Climate Change. The Physical Science Basis: Working Group I Contribution to the Sixth Assessment Report of the Intergovernmental Panel on Climate Change (1st ed.). Cambridge University Press. https://doi.org/10.1017/9781009157896
2. Coulthard, T., & Skinner, C. (2016). The sensitivity of landscape evolution models to spatial and temporal rainfall resolution. Repository@Hull (Worktribe) (University of Hull), 4(3), 757–771. https://doi.org/10.5194/esurf-4-757-2016
3. Donnelly, J., Abolfathi, S., Pearson, J., Chatrabgoun, O., & Daneshkhah, A. (2022). Gaussian process emulation of spatio-temporal outputs of a 2D inland flood model. Water Research, 225, 119100. https://doi.org/10.1016/j.watres.2022.119100
4. Laudan, J., Rözer, V., Sieg, T., Vogel, K., & Thieken, A. H. (2017). Damage assessment in Braunsbach 2016: data collection and analysis for an improved understanding of damaging processes during flash floods. Natural Hazards and Earth System Sciences, 17(12), 2163–2179. https://doi.org/10.5194/nhess-17-2163-2017
5. Öztürk, U., Wendi, D., Crisologo, I., Riemer, A., Agarwal, A., Vogel, K., López‐Tarazón, J. A., & Korup, O. (2018). Rare flash floods and debris flows in southern Germany. The Science of The Total Environment, 626, 941–952. https://doi.org/10.1016/j.scitotenv.2018.01.172
6. Skinner, C., Coulthard, T., Schwanghart, W., Wiel, M. J. V. D., & Hancock, G. R. (2018). Global sensitivity analysis of parameter uncertainty in landscape evolution models. Geoscientific Model Development, 11(12), 4873–4888. https://doi.org/10.5194/gmd-11-4873-2018
7. Yanites, B. J., Clark, M. D., Roering, J. J., West, A. J., Zekkos, D., Baldwin, J. W., Cerovski‐Darriau, C., Gallen, S. F., Horton, D. E., Kirby, E., Leshchinsky, B., Mason, H. B., Moon, S., Barnhart, K. R., Booth, A. M., Czuba, J. A., McCoy, S., McGuire, L. A., Pfeiffer, A., & Pierce, J. (2025). Cascading land surface hazards as a nexus in the Earth system. Science, 388(6754). https://doi.org/10.1126/science.adp9559

Richard Bready
The Grand Canyon just had a flash flood, following this: “About half an inch to 1 inch (1 to 2.5 cm) of rain fell within about 20 minutes on a rocky slope where there’s a steep drop in elevation, said National Weather Service meteorologist Darren McCollum in Flagstaff. The deluge was preceded by two smaller systems that drenched the area hours earlier.” (Associated Press)
The flood has knocked out the Grand Canyon’s only pipeline for water. All park facilities are closed.
“Heaven help us if the whole thing down there at the bottom has to be reconstructed,” said Jack Schmidt, director of the Center for Colorado River Studies at Utah State University. “Where are they going to get the money?” (AP again)
Questions of scale, granularity, and periodicity also trouble the Global Warming Potential numbers used in climate models, where CO2 reduction counts for more, toward longterm GWP reduction, than reduction of CH4, the chemical equivalent of short-term precipitation in potential for rapid damage.
Richard Bready
Update: “The most significant flooding was on Bright Angel Creek, which joins the river at Phantom Ranch. The normally clear and burbling brook was flowing at about 14 cubic feet per second at 11:20 on the morning of August 29; at 12:50 p.m. the gauge showed a flow of *347 cfs*; then the readings vanished as the gauge was overwhelmed by a torrent, disabling the gauge.”
Average figures for the week, of course, will conceal the event.