The Spring School on “Statistical analysis of hyperspectral and high-dimensional remote-sensing data using R” was organized by the GIScience group lead by Prof. Alexander Brenning and two researchers from his GIScience research group, Patrick Schratz and Dr. Jannes Münchow. The school brought together a diverse group of 28 researchers (e.g. geoscientists, forestry, environmental studies) at different scientific levels (graduate students, PhD, postdoc, professor) from all over the world as far as Chile, Peru, Turkey, and Bosnia & Herzegowina. Overall, eight german and 16 non-german participants (20 male, 8 female) took part in this event. During five days the participants were introduced to the theoretical background of hyperspectral remote sensing data and learned in numerous hands-on sessions how to analyse and illustrate spatial data in R. The Spring School was organized within the LIFE Healthy Forest project and supported by the Michael Stifel Center Jena. In this short blog-post I want to give you a quick overview of the many, many things we learned during this intense “spatial stats-and-R-week”.
 Participants and organizers of the Spring School on “Statistical analysis of hyperspectral and high-dimensional remote-sensing data using R” in Jena, © H. Petschko
On the first day of the summer school the participants obtained a theoretical introduction to hyperspectral remote-sensing data with examples focusing on the application of hyperspectral data in forest research. Marco Peña from the Alberto Hurtado University in Chile gave a lecture on “Introduction to hyperspectral remote sensing” which brought everyone to the same level. This very comprehensive introduction was followed by a talk on hyperspectral applications exemplified on a study on forests in the Bialowieza Forest in eastern Poland by Aneta Modzelewska from the Forest Research Institute in Raszyn. The last talk on the first day was by Dr. Henning Buddenbaum (University of Trier) on “Hyperspectral remote sensing for measuring biochemical leaf parameters in forests”. Dr. Buddenbaum is involved in the Science Advisory Group – Forests and Natural Ecosystems in the EnMAP mission, a German hyperspectral satellite mission aiming at monitoring and characterising the Earth’s environment globally.
The second day was filled with hand-on R sessions. In a first session by Patrick Schratz we learned about his “must know” features of R, namely Rmarkdown, the apply-family and pipes. This was followed by two session focusing on the usage of R as a GIS. Dr. Jannes Münchow, who developed the package RQGIS, an interface between R and QGIS which allows the user to access QGIS algorithms from within R. Afterwards we were introduced to the package mapview, an R package by Dr. Tim Appelhans. Mapview is a GIS-like interactive graphing tool that is directly accessible within RStudio (or the web browser, if you are not using RStudio). It is especially helpful if you want to quickly do a visual check whether a certain analysis has produced reasonable results.
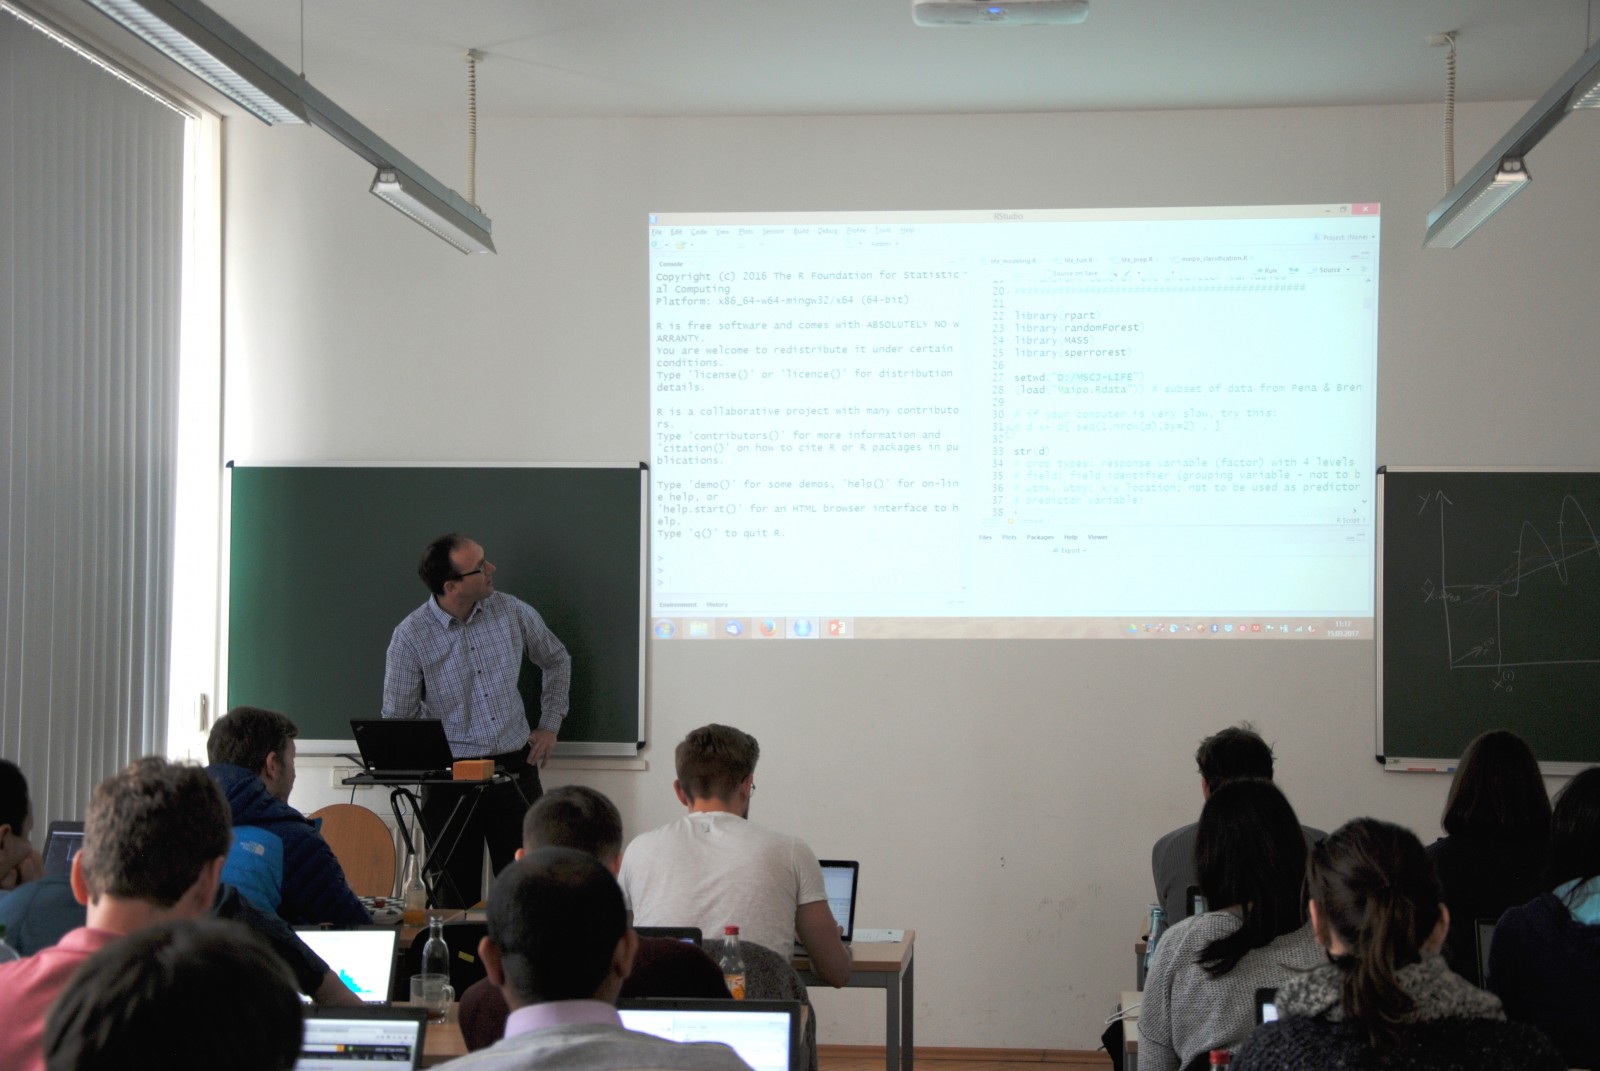
The third day started with a lecture and hands-on session on “Statistical and machine learning in remote sensing” by Prof. Alexander Brenning with a focus on linear discriminant analysis, support vector machine and random forest. A short overview of these statistical modeling methods and the application in R including a comprehensive tutorial can be found here. In the afternoon, Dr. Thomas Bocklitz presented a very different perspective in the application of spectral data analysis in histopathology. Afterwards, the participants had a chance to discuss their own research involving spatial modeling techniques or R-problem with the group and the experts from the GIScience group in Jena.
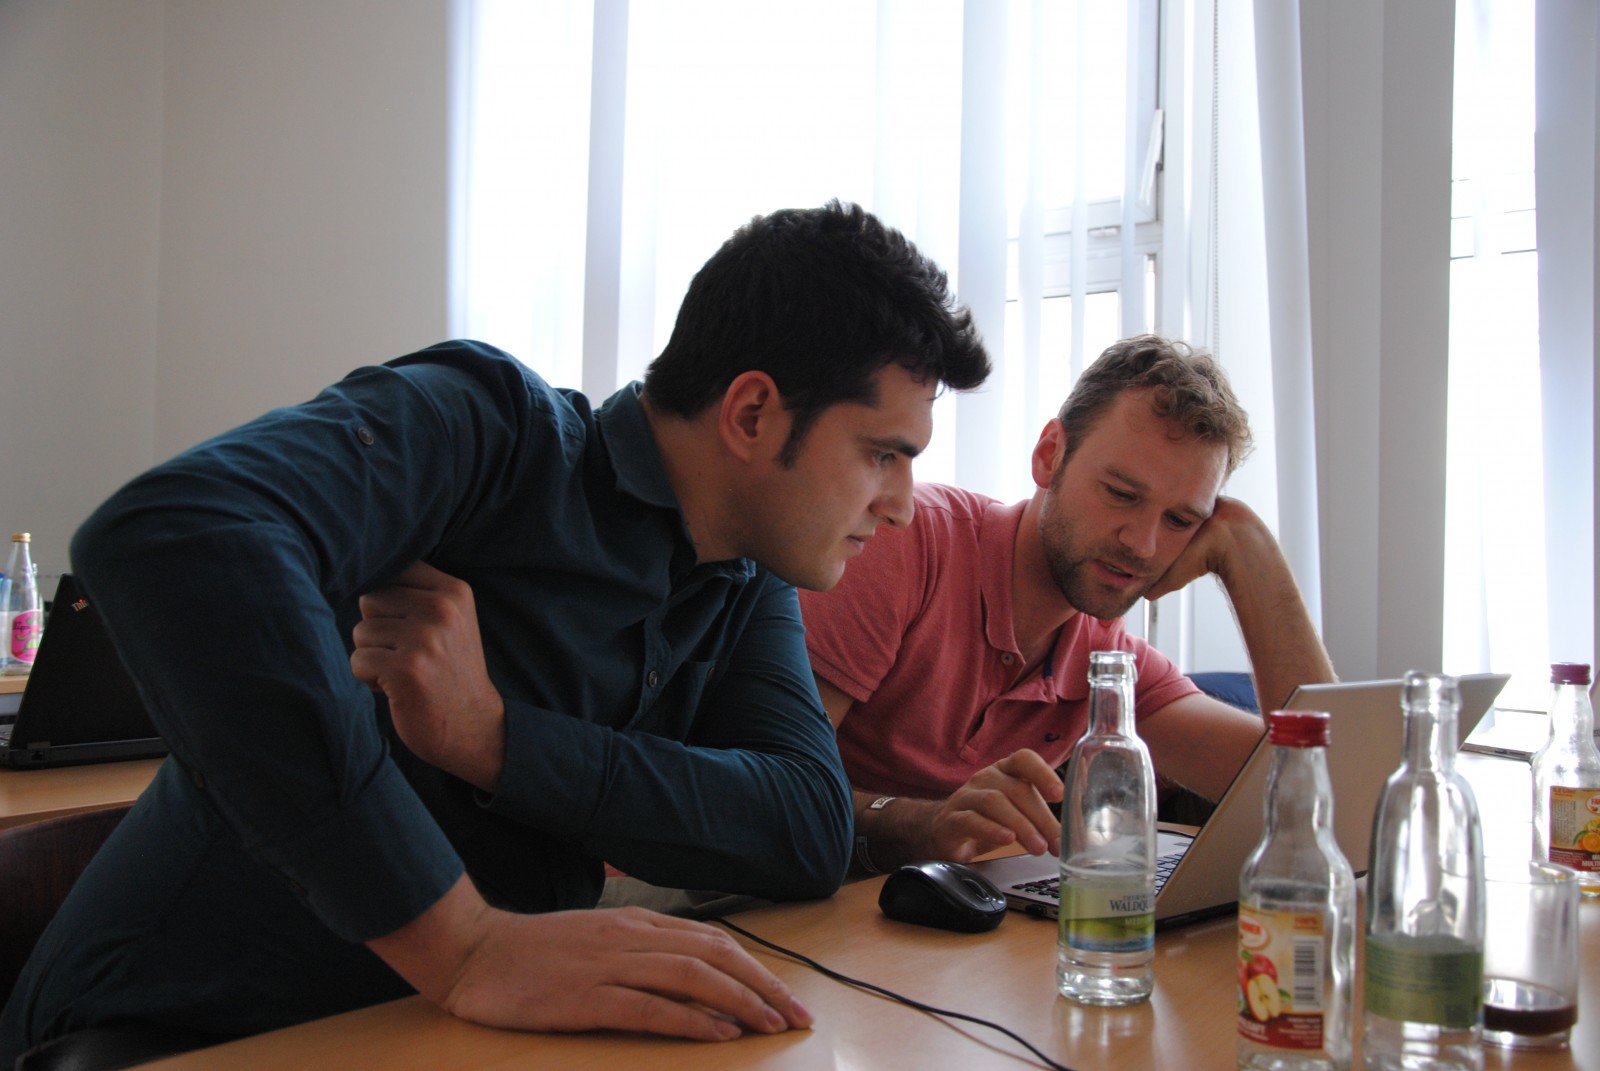 Solving R-problems with Dr. Jannes Münchow, © H. Petschko
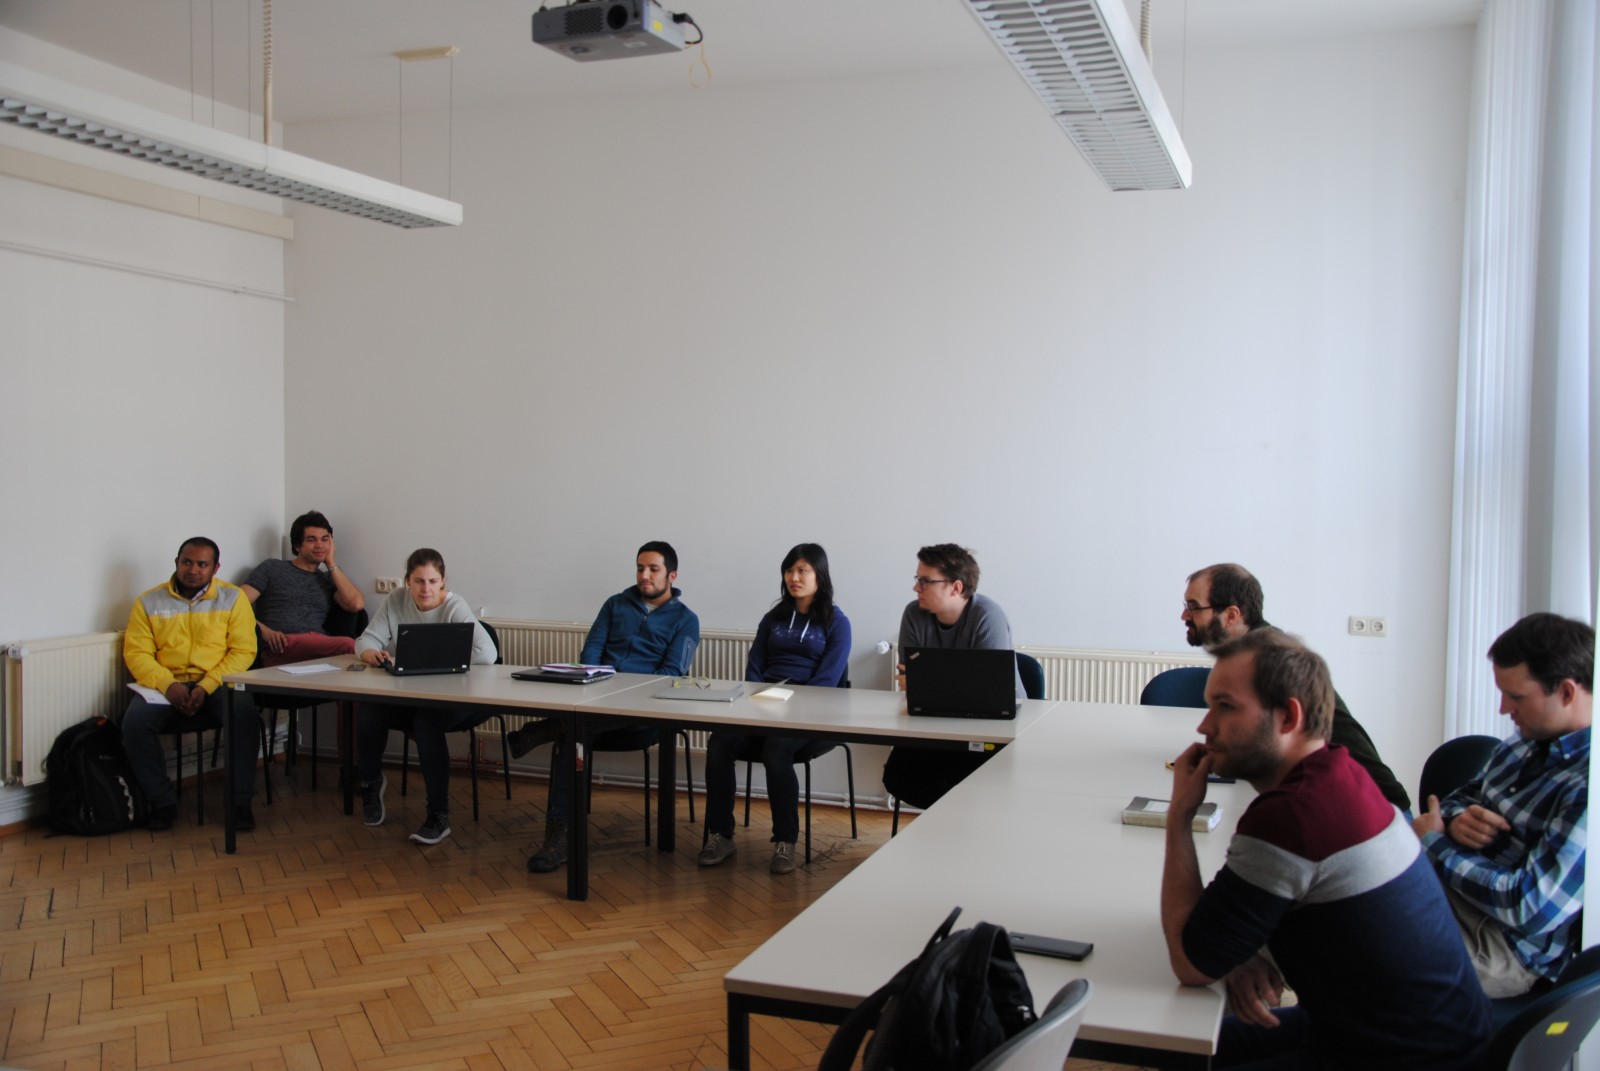 Open session during the Spring School to discuss research projects of the participants, © H. Petschko
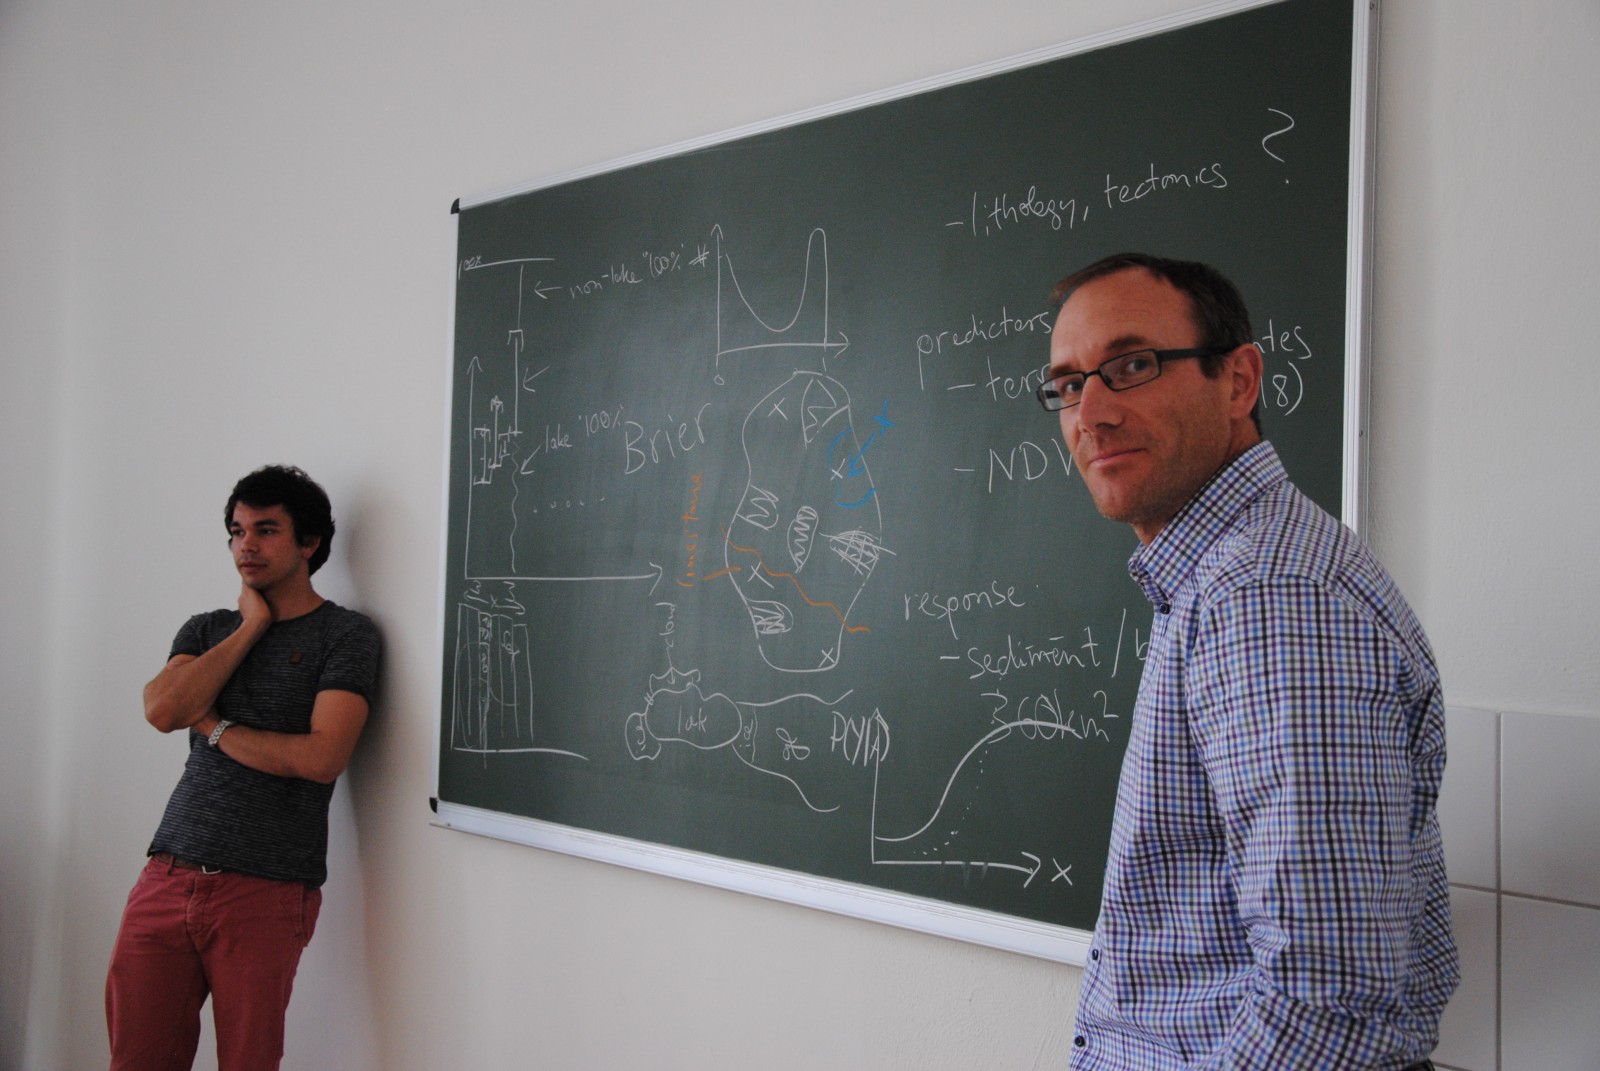 Discussion sampling designs with Prof. A. Brenning, © H. Petschko
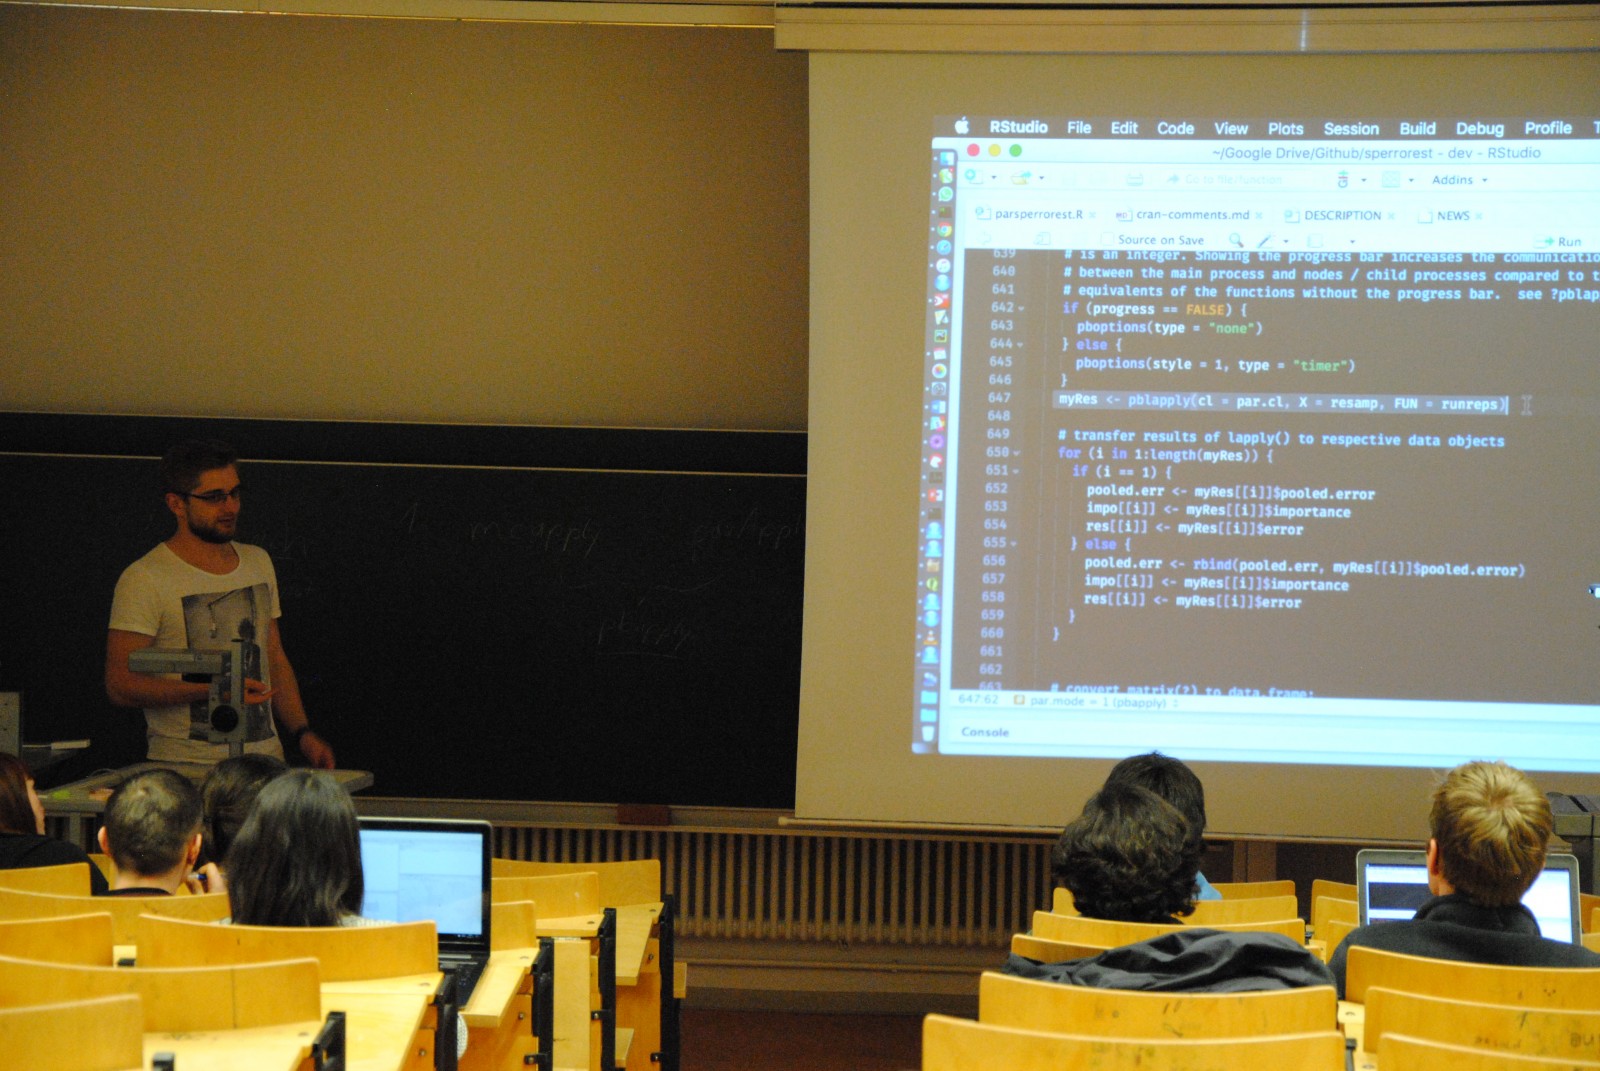 Introduction to parallel processing in R with Patrick Schratz, © H. Petschko
On the fourth day, Partick Schratz briefly introduced the hsdar developed by Dr. Lukas Lehnert from University of Marburg. It can be used for processing and analysis on hyperspectral data in R. Prof. Brenning focused in his second session further on the assessment of model accuracy (non-spatial and spatial validation methods, variable importance) using the sperrorest package and dealing with high dimensionality in linear regression.
 Lecture by Prof. A. Brenning on “Statistical and machine learning in remote sensing”, © H. Petschko
On the last day, we visited a monitoring site and a site with tornado damage (see images below) from 2016 in the Thuringian Forest together with three experts from the official authority “ThüringenForst”. In conclusion, the Spring School was a great event with many fruitful hands-on R-sessions during which the participants could learn helpful tricks in R, how to use R as a GIS and about statistical and machine learning in R. Hopefully there will be more academic “schools” like this one to follow in the future (maybe even with a thematic focus on geomorphology or natural hazards).
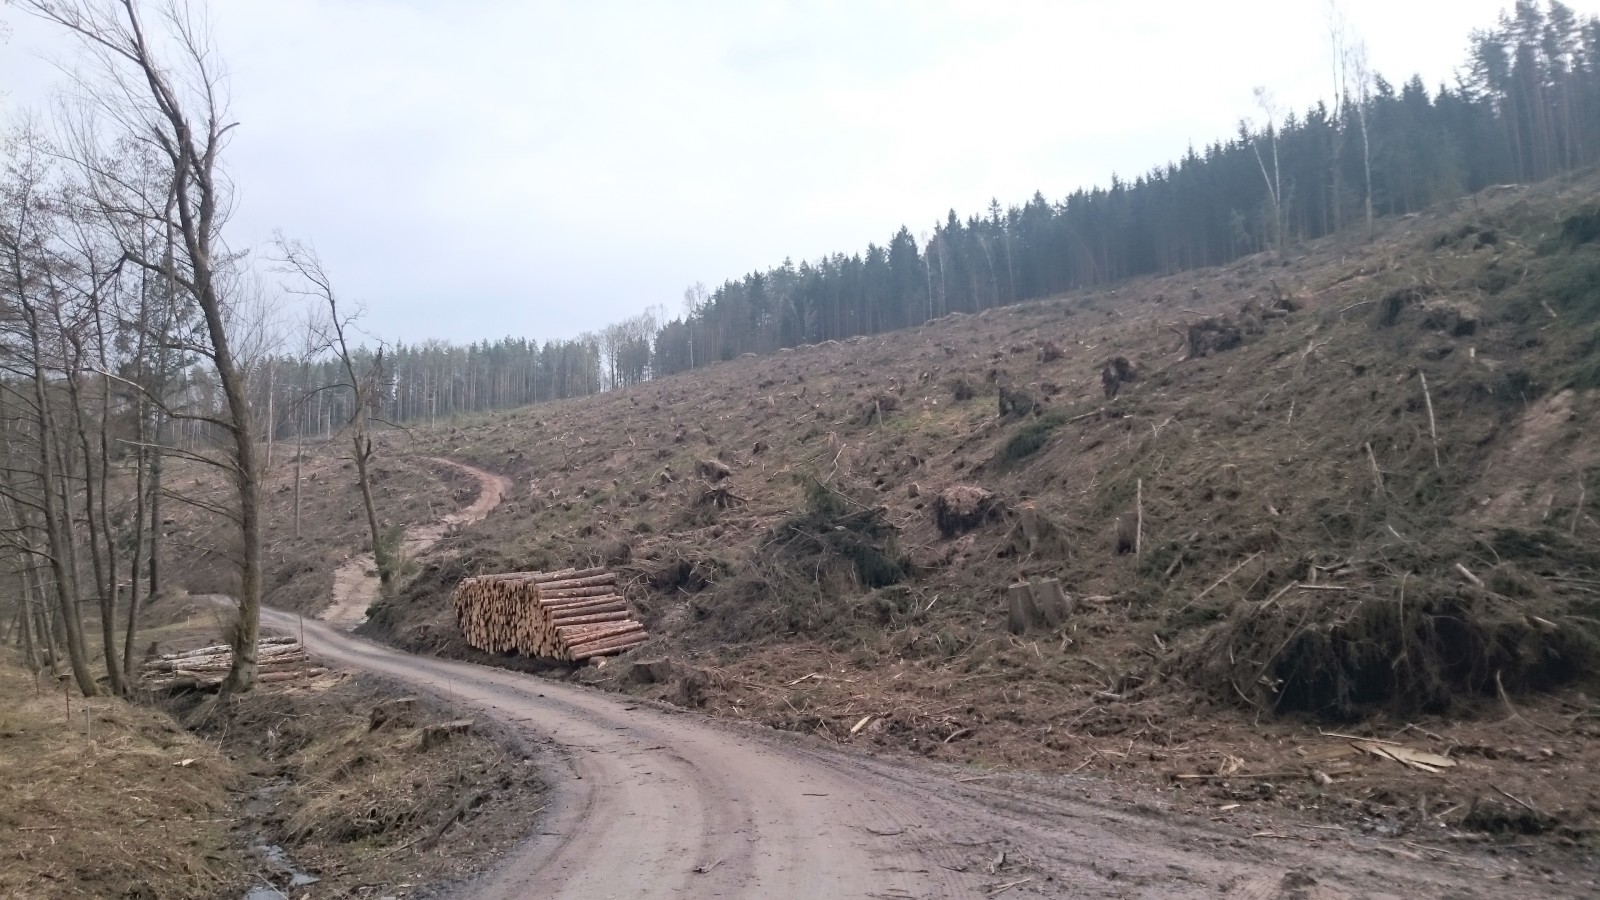 Tornado damage in the Thuringian Forest from September 2016 © P. Schratz
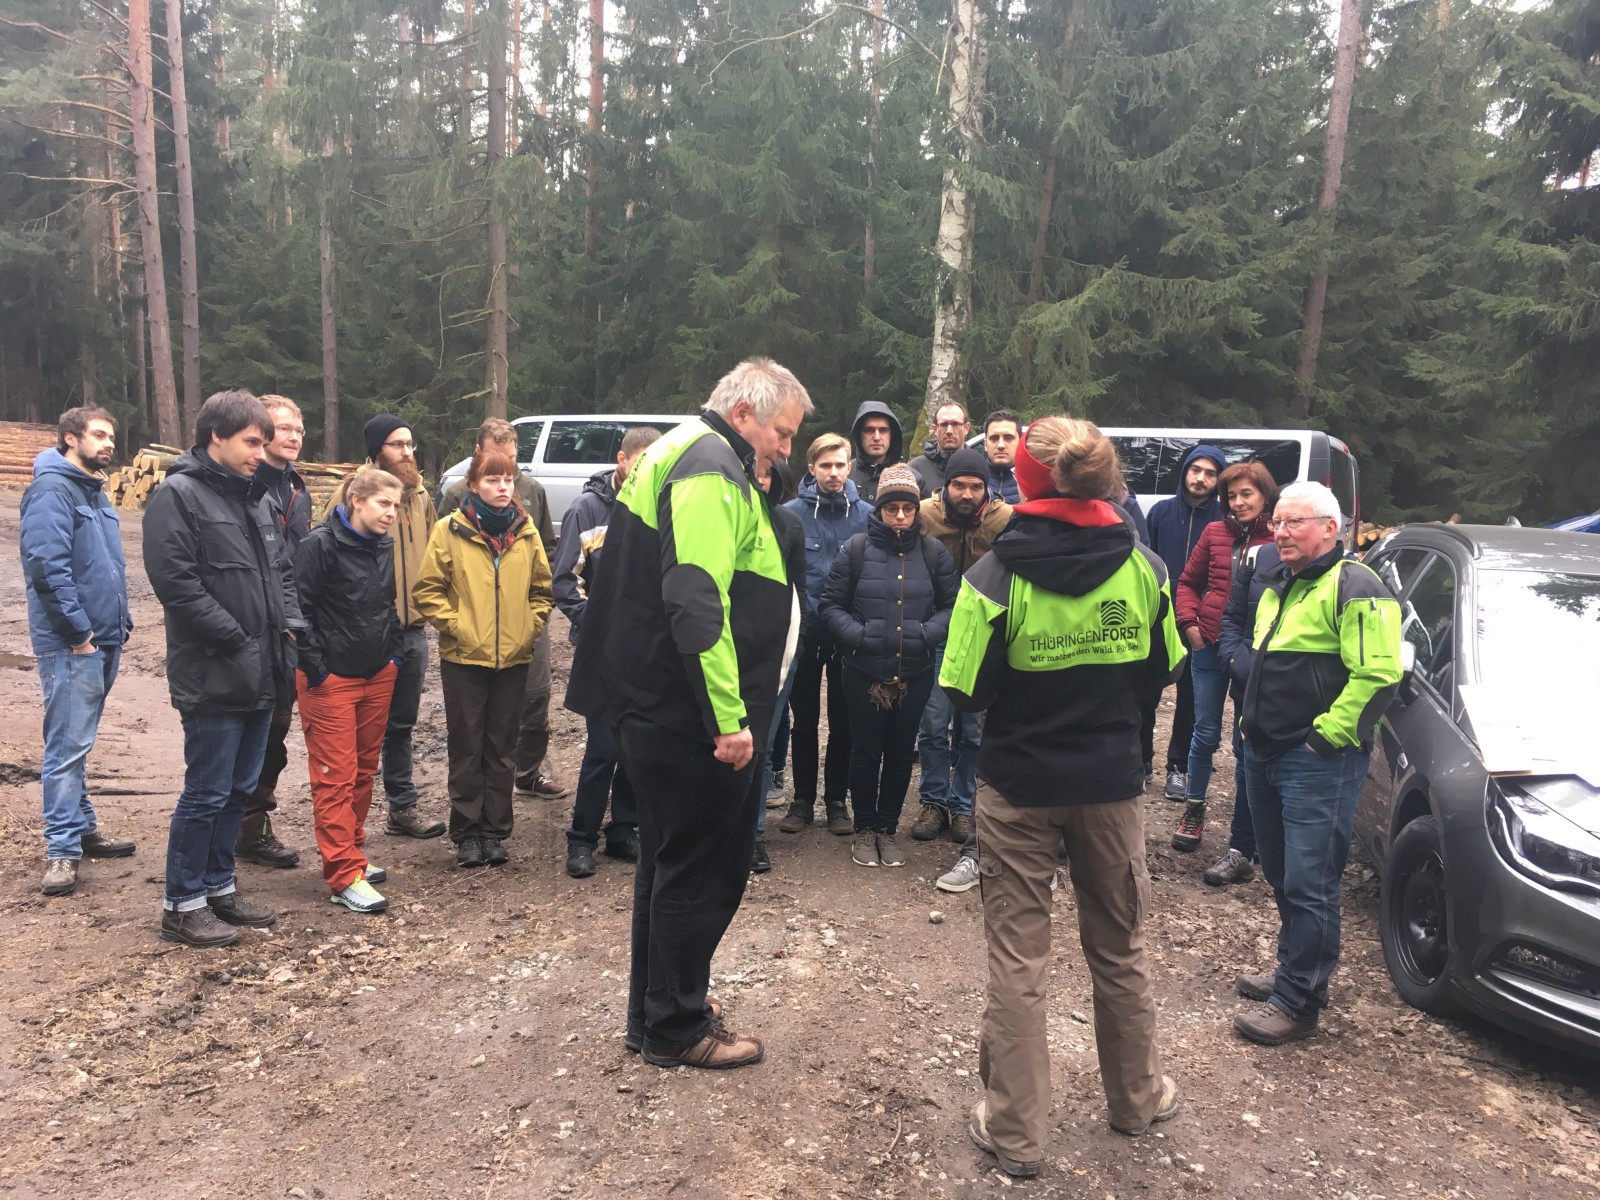 Field trip to the Thuringian Forest, © P. Schratz
written by Anna Schoch (PhD student from the University of Bonn)