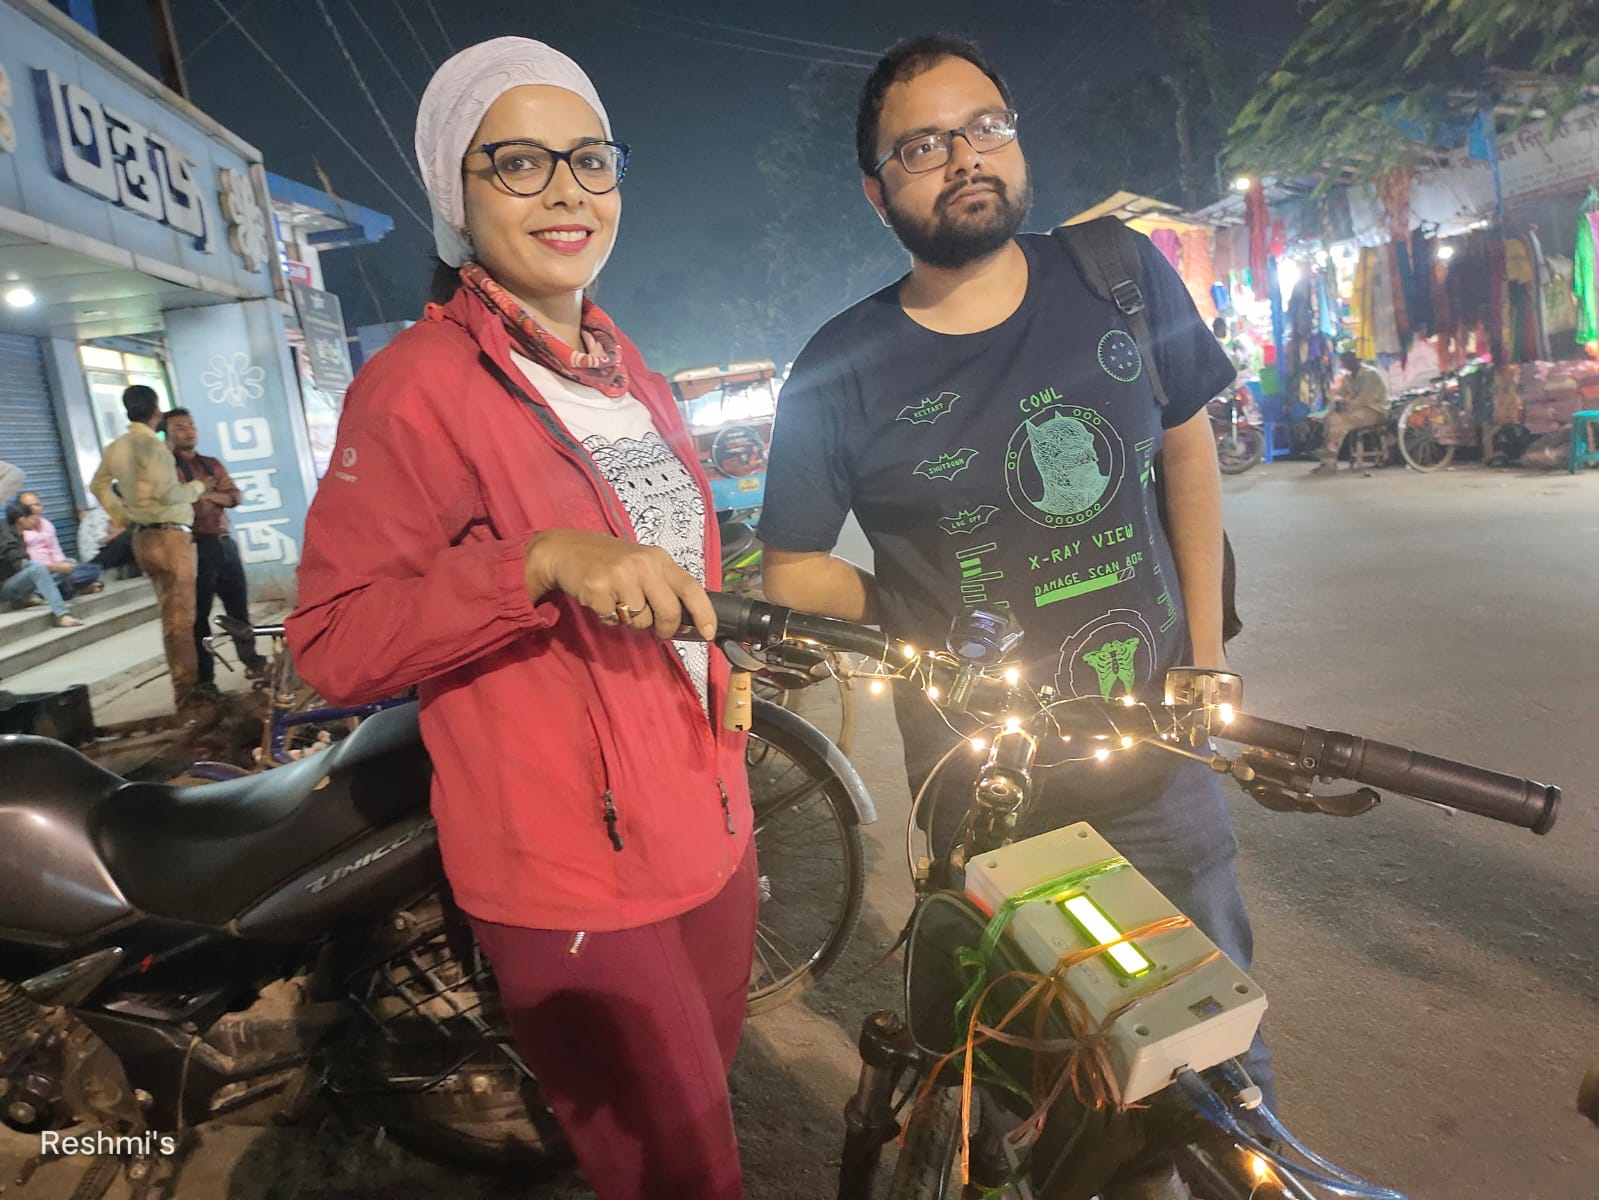
Fig 1: The bicycle-mounted low-cost sensor, riders and author
India is experiencing an “Air apocalypse” and the Global Burden of Disease study has estimated the death toll has reached 1.67 million in 2019. Almost 100% of the population is now exposed to PM2.5 level higher than WHO (World Health Organization) recommendations. However, common citizens are generally unaware of the seriously damaging effects of poor air quality, largely because of the lack of adequate air quality information dissemination. For a nation with a population of 1.38 billion and 4,000 towns/cities, only 322 automatic air quality monitoring stations exist. Among them, the national capital region, Delhi represents 2% population of India and has 25% of all air quality monitoring stations.
Low-cost sensor-based monitoring of ambient air quality has become increasingly popular over the recent years. It is promising to create a much-needed parallel monitoring network and provide direct information to the citizen. The low-cost and relatively robust technique comes with its own limitations like calibration shifts and, sensitivity but as the saying goes: “Half a loaf is better than no loaf”.
Dr. Soumendra Singh (SN Bose Center for Basic Science) and myself designed a set of low-cost air quality monitoring instruments with Plant Tower 5003 particulate matter sensor and integrate it with relative humidity/temperature, timestamp, and memory card module. The fabricated instrument runs with a power bank and the cost comes around 50$ per instrument (Fig 1).
City-wide measurement can be very challenging, as finding proper place for measurement and addressing logistical issues require significant effort. So, I opt for citizen science. I have selected Midnapore, a rapidly growing city with 0.2 million population (18 sq km area) in eastern India that represents a tier two city (the one that comes after million-plus city) and does not have a single automatic monitoring station. Why do I select Midnapore? Of course, because it’s my hometown and there are thousands of rapidly growing cities like Midnapore in India with similar population strength and area.
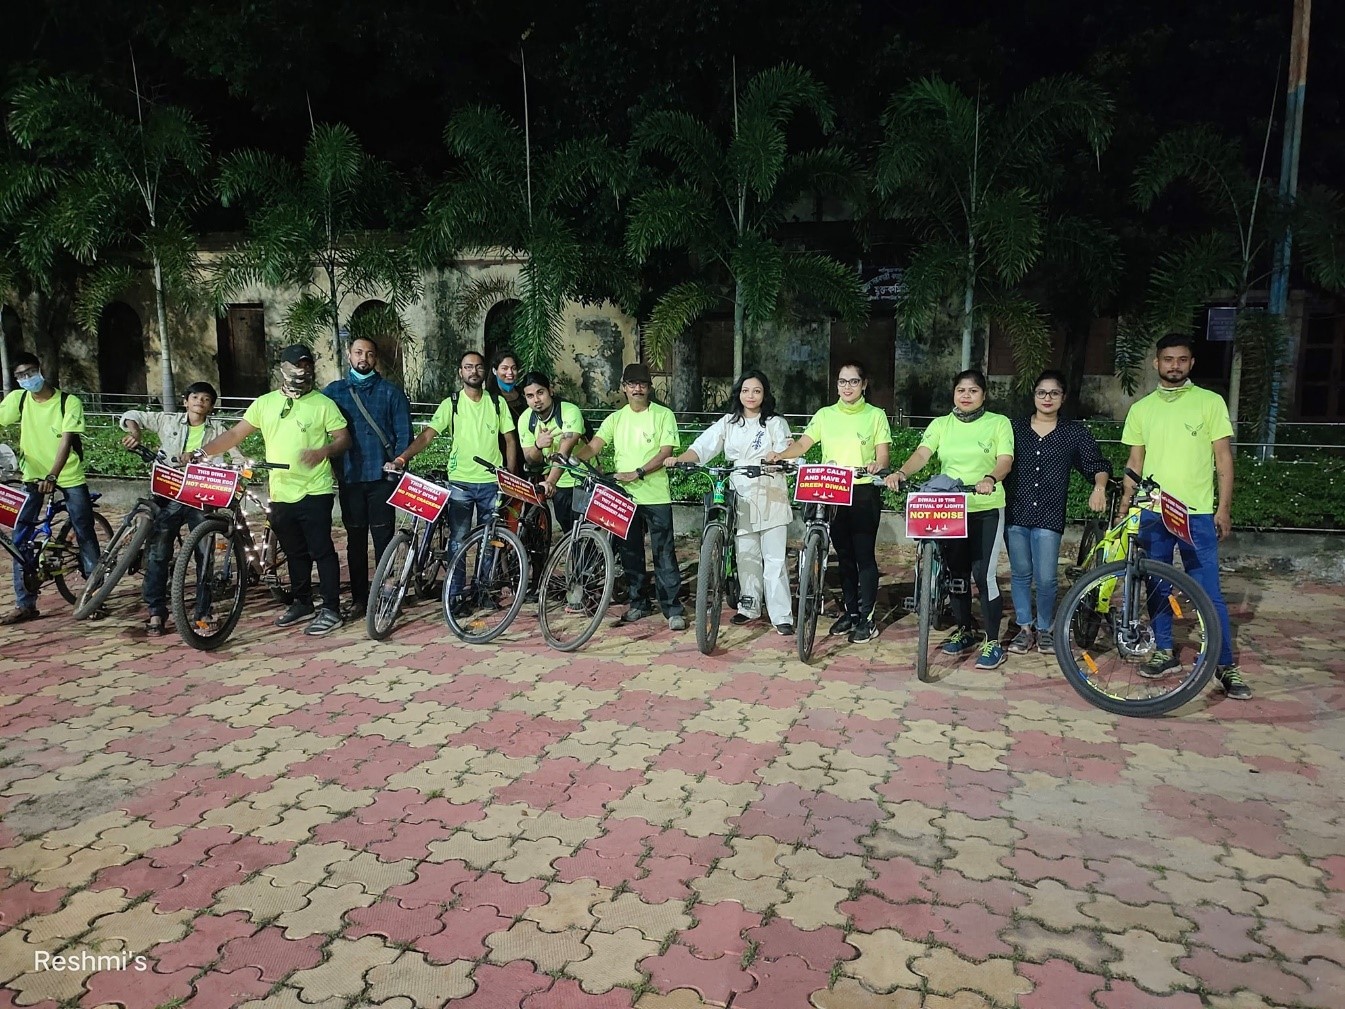
Fig 2: Some member of West Midnapore Cyclers Club during survey
Established in 2020, West Midnapore Cyclers Club has already created an identity for its extraordinary outreach involving 1,500 members (Fig 2). Their motto strongly encourages inclusive riding irrespective of socio-economic background. Therefore, the club consists of members who are livelihood cyclists and recreational cyclists. Led by Nabanita Mishra, a local high school teacher, the club member regularly conducts bicycle rides in and across the city. Initially, I installed the monitors in the bicycle of some members of the cyclist club and they started riding across the city during the peak evening traffic hours (Fig 3).
We create a map with the data and all the major and minor junction points and roads have 2-4 times PM2.5 than the national standards and 9-15 times that of WHO standards. Roads with eateries and roads with auto-routes (Auto is a three-wheeled car that runs on LPG/illegal oil) have a very high concentration than other roads.
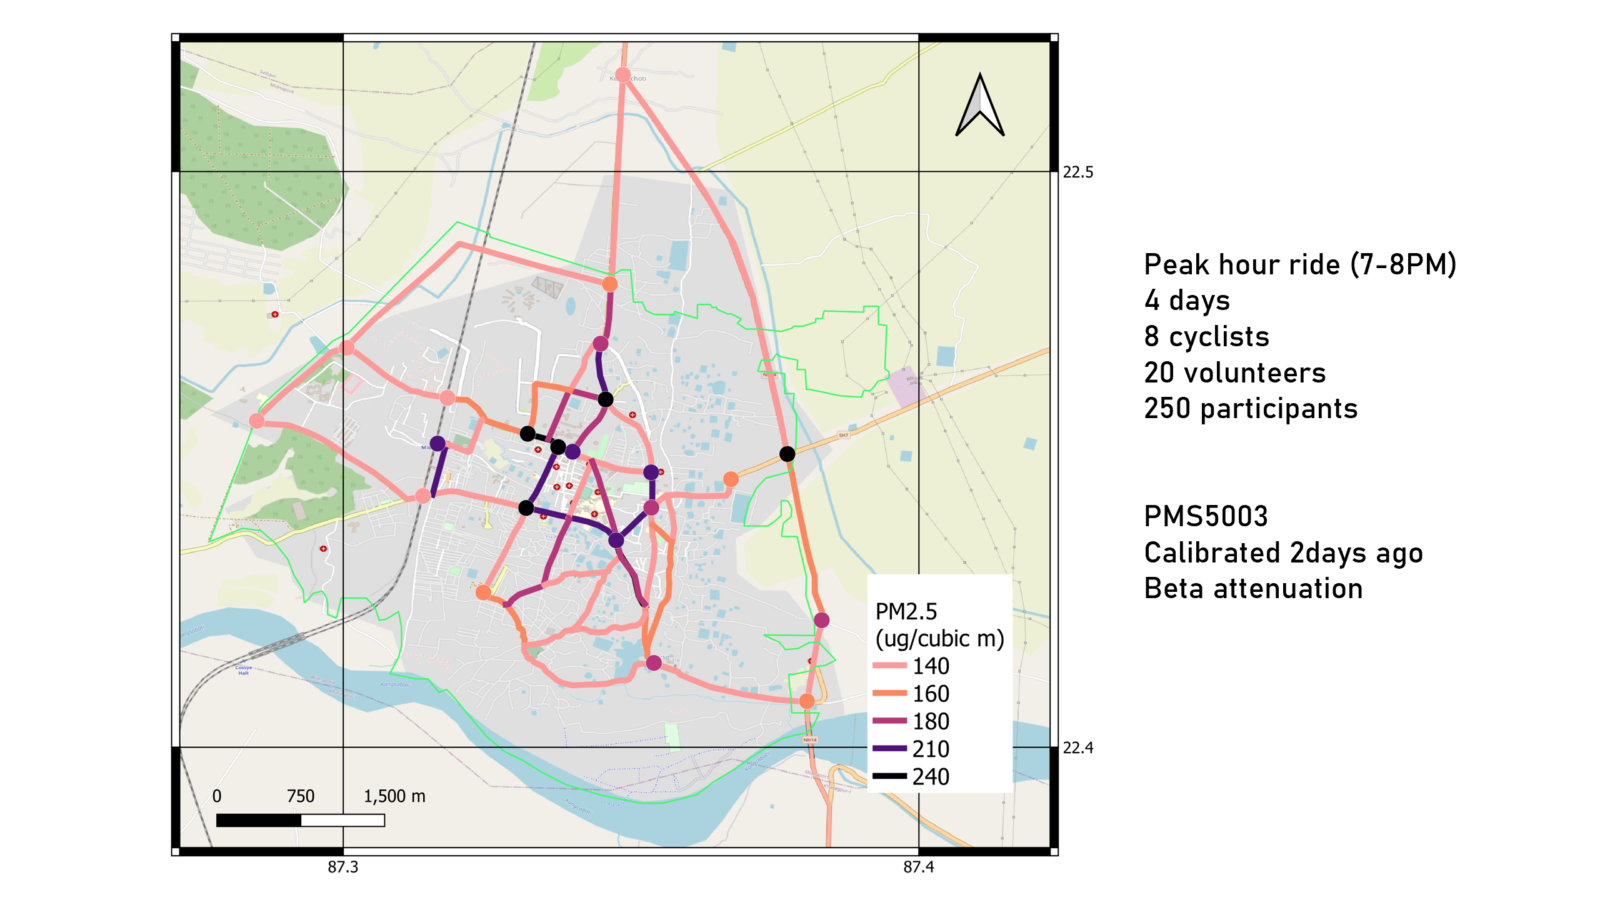
Fig3: PM2.5 from Low-Cost Sensor Cycle network over Midnapore
While talking to the bicycle club, I started to understand the cyclers club members not only know the city well, but they can help the rapid digitalization of the city. They know about the paved and unpaved road networks, they know areas where coal/wood is predominantly used for cooking, they know construction sites, all the restaurants, and other very relevant information to produce an emission inventory which is basically the amount of emission of PM2.5 from different sectors like vehicular, biomass, waste, construction, etc.
There are two things that are required when preparing an emission inventory; emission factors and activity. Emission factors are well studied in the literature and can tell e.g., if we burn 1kg of plastic waste, how much PM2.5 will be emitted. The things we usually don’t know are the activity data; which is the amount of plastic waste burning in different parts of the city. Traditionally emission inventory preparation is a long-term process where human and monitory costing is huge; in addition, it often relies on the extrapolation of outdated information like Census data.
There are a lot of activity data that can be easily acquired from a bicyclist network. For example, the usual practice is to assume that open burning accounts for 3.5% of the total waste generated. However, in reality, open burning is one of the major uncertain areas of air quality emission inventory and such assumptions are very unrealistic. With the help of the bicycle network, we are able to construct a detailed open burning map of the city which as compared to the conventional method shows a different estimation of PM2.5 emission (Fig 4). The pre-determined fraction (3.5%) of total waste underestimate open burning by a factor of 3.9 times.
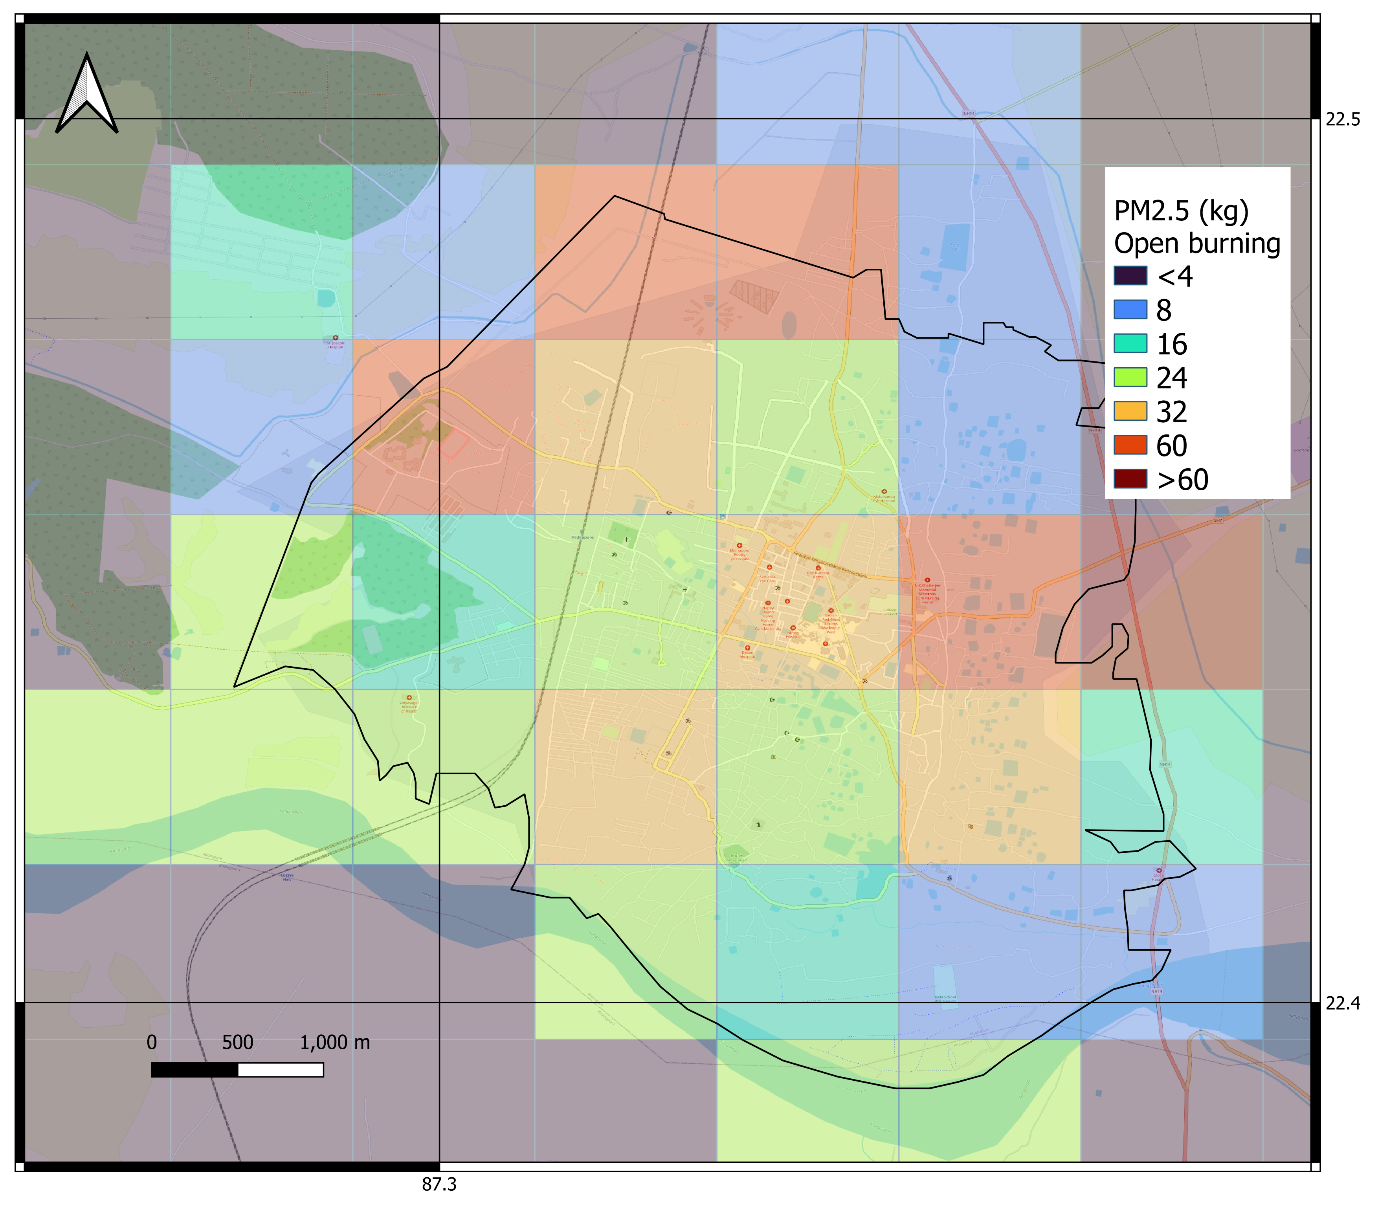
PM2.5 emission from open burning during winter over Midnapore
Other than the big chain of restaurants, the majority of the eateries are unregistered and a significant proportion of the eateries are mobile in Indian cities. The bicycle network was able to capture the eateries, their fuel type usage, locations, and route successfully (Fig 5). For the residential sector, the network was able to identify low-income households which prone to use woods and coal for cooking purposes. The activity data (per kg cooking fuel requires per household) is collected from the livelihood cyclist as most of them lived in low-income neighborhoods. Similarly, the bicycle network was able to provide detail information about construction activity, low-income neighborhood mapping, digitization of roads, vehicle count and other relevant data which are essential for preparation of emission inventory. Needless to say, such information is not present in governmental repository for most of the Indian cities.

Fig 5: Differential fuel usage in eateries in Midnapore
Measurement of air pollutants and preparation of emission inventories are primary information required for air quality management and with the help of a bicycle network (Fig 6), we have successfully improved our understanding almost free of cost. Utilization of existing resources is important and a scientifically designed citizen science program can help us to address the knowledge gap on air pollution in the global south.

Fig 6: Relevant emission inventory information from cycling network used in the study
Edited by Mengze Li and Athanasios Nenes.
Tasneem
Great work!
Subho
Essential study.
Abogado De Divorcio En Virginia
Thanks for sharing. Wonderful article. I got informative blog. Keep sharing.
praveen kumar Pothapakula
Cool!
Vin
This is very commendable. I totally recommend this for other cities with large populations.