The first week of the Climate Change summit in Bonn (COP 23 for those in the know) has been marked by Syria’s decision to sign the Paris Accord, the international agreement that aims at tackling climate change. This decision means that the United States would become the only country outside the agreement if it were to complete the withdrawal process vowed by President Trump. In this context ...[Read More]
Image of the Week – Sea-ice dynamics for beginners
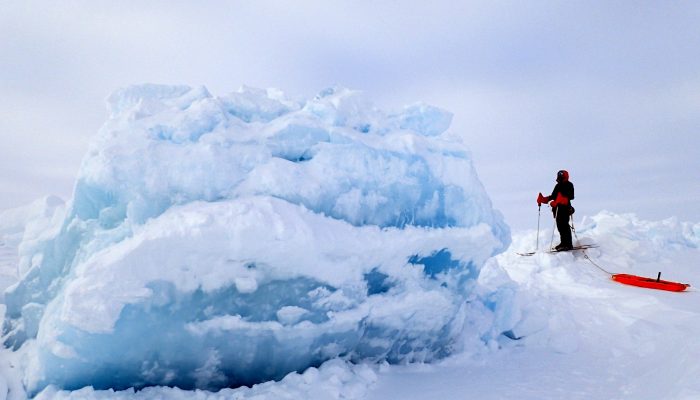
A block of ice in a pressure ridge. The scientist has to cross the ridge with equipment to continue measuring the sea-ice thickness on the other side. [Credit: Marius Bratrein, Norwegian Polar Institute]
When I ask school children or people who only know about sea ice from remote references in the newspapers: ‘How thick do you think is the Arctic sea ice?’, I often get surprising answers: ’10 meters? No, it must be thicker – 100 meters!’. It seems like sea ice, often depicted as a uniform white cover around the North Pole and as a key element in accelerated warming of the Polar Regions, imposes a ...[Read More]
Image of the Week – Of comparing oranges and apples in the sea-ice context
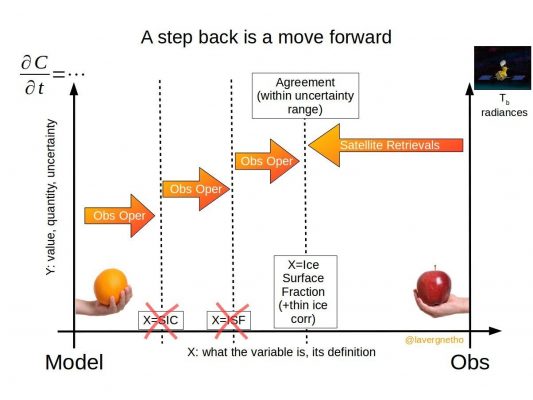
Fig. 1: Model-to-observation comparison of sea-ice variables might best be conducted at a middle-ground "location" (along the x axis) somewhere in between what the models compute (left) and what satellites observe at the top of the atmosphere (right). Obs Oper = Observation Operators, SIC = sea-ice concentration, ISF = ice surface fraction [Credit: Lavergne, 2017 ].
In the last fifty years, models and observations have enabled us to better understand sea-ice processes. On the one hand, global climate models have been developed, accounting for the sea-ice component in the climate system. On the other hand, satellite instruments have been developed to monitor the “real” sea-ice evolution. These satellite observations are often used to evaluate climate models. H ...[Read More]
Image of the Week — Think ‘tank’: oceanography in a rotating pool
To study how the ocean behaves in the glacial fjords of Antarctica and Greenland, we normally have to go there on big icebreaker campaigns. Or we rely on modelling results, especially so to determine what happens when the wind or ocean properties change. But there is also a third option that we tend to forget about: we can recreate the ocean in a lab. This is exactly what our Bergen-Gothenburg tea ...[Read More]
Image of the Week – Karthaus Summer School 2017
Glaciologists often undertake fieldwork in remote and difficult to access locations, which perhaps explains why they happily travel to similar locations to attend meetings and workshops. The Karthaus Summer School, which focuses on Ice Sheets and Glaciers in the Climate System, is no exception. The idyllic village of Karthaus, located in the narrow Schnalstal valley in Südtirol (Italy), has been h ...[Read More]
Image of the Week – The true size of Greenland
Greenland is a critical part of the world, which is regularly covered on this blog, because it hosts the second largest ice body on Earth – the Greenland Ice Sheet. This ice sheet, along with its small peripheral ice caps, contributes by 43% to current sea-level rise. However, despite being the world’s largest island Greenland, appears disproportionately large on the most common world maps (Fig. 2 ...[Read More]
Image of the Week: Petermann Glacier
Our image of the week shows the area around the calving front of Petermann Glacier through the spring, summer, and autumn of 2016. Petermann Glacier, in northern Greenland, is one of the largest glaciers of the Greenland Ice Sheet. It terminates in the huge Petermann Fjord, more than 10 km wide, surrounded by 1000 m cliffs and plunging to more than 1100 m below sea level at its deepest point. In 2 ...[Read More]
Image of the Week – Powering up the ground in the search for ice
In an earlier post, we talked briefly about below-ground ice and the consequences of its disappearing. However, to estimate the consequences of disappearing ground ice, one has to know that there actually is ice in the area of study. How much ice is there – and where is it? As the name suggests, below-ground ice is not so easy to spot with the naked eye. Using geophysical methods, however, ...[Read More]
Image of the Week – ROVing in the deep…
Robotics has revolutionised ocean observation, allowing for regular high resolution measurements even in remote locations or harsh conditions. But the ice-covered regions remain undersampled, especially the ice-ocean interface, as it is still too risky and complex to pilot instruments in this area. This is why it is exactly the area of interest of the paper from which our Image of the week is take ...[Read More]
Image of the Week – Bioalbedo: algae darken the Greenland Ice Sheet
Fig 1: This aerial image shows the surprisingly dark grey-brown colour of the Greenland Ice Sheet surface, around the ‘Black and Bloom’ camp. [Credit: 'Black and Bloom']
Most of the energy that drives glacier melting comes directly from sunlight, with the amount of melting critically dependent on the amount of solar energy absorbed compared to that reflected back into the atmosphere. The amount of solar energy that is reflected by a surface without being absorbed is called the albedo. A low albedo surface absorbs more of the energy that hits it compared to a high ...[Read More]