EGU Blogs

Polluting the Internet

The dark side of the atmosphere: the blog awakens

The dark side of the atmosphere: the blog awakens

Aerosol particles come in lots of different flavours and one of their most important properties is how they deal with incoming sunlight. Some are rather unwelcoming and send sunlight back to whence it came (space), which leads to a cooling of the atmosphere as the sunlight doesn’t reach the surface of the Earth. Others offer sunlight a warm(ing) embrace and absorb it, which heats up the atmosphere.

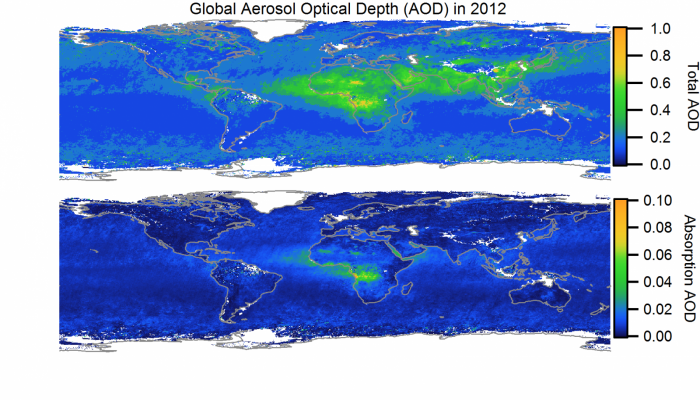
The relative amount of absorbing aerosol compared to the total aerosol burden in the atmosphere is the primary control on whether aerosol particles have a warming or cooling impact. Overall, aerosol particles are thought to cool climate but there are differences regionally and over the course of a typical year. We can see in the maps above that the absorbing aerosol is typically much smaller than the total amount of aerosol; the absorbing fraction is generally less than 5% of the total.

Regionally, the level of absorption and its relative contribution can be much larger, particularly where large-scale biomass burning occurs. Southern-West Africa sticks out in the above image where large-scale biomass burning occurs frequently. These open fires release large amounts of black carbon, which is the major absorbing aerosol species in the atmosphere. In addition, the fires can release so-called ‘brown carbon‘, which is a more weakly absorbing aerosol made up of organic material.

To complicate matters, biomass burning aerosol is also made up of the unaccommodating aerosols that scatter sunlight back to space. The competition between the scattering and absorbing aerosol species is quite intense and uncertain. The most recent Intergovernmental Panel on Climate Change (IPCC) report underlined our poor understanding of biomass burning aerosol, as its estimate of its impact didn’t pin down whether it cooled or warmed our atmosphere overall. The highlighted region over Southern-West Africa is a particularly complex and uncertain case.

Absorbing aerosol species are one of the hottest areas of research in aerosol science, as they have an uncertain contribution to climate warming (particularly on regional scales). Black carbon has received much attention on this front as a ‘short-lived climate forcer‘, plus there are significant health implications associated with it also. There are major questions relating to the impact of absorbing aerosol species on climate, which I will explore down the line on the blog and through my own research.

The dark side is clearly powerful. How powerful remains to be seen.

—————————————————————————————————————————————————————–

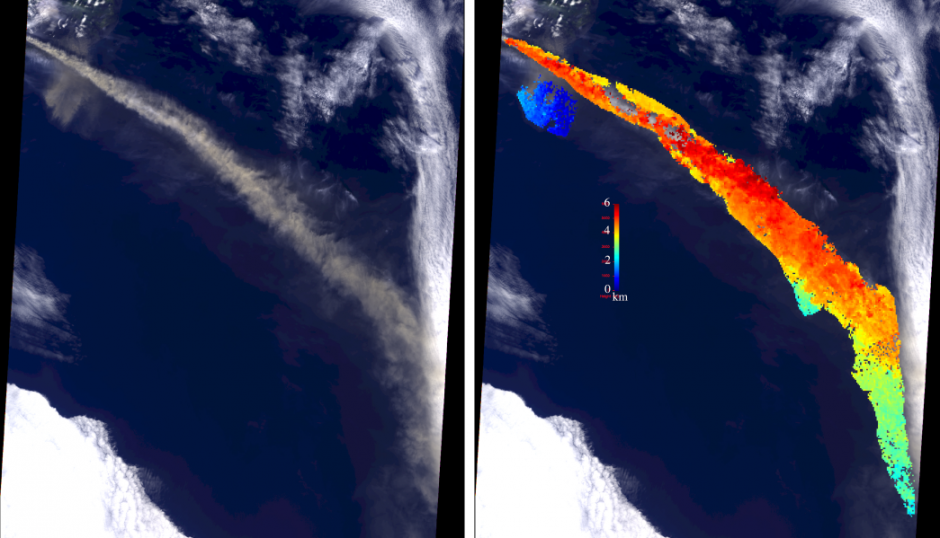
Multi-angle Imaging SpectroRadiometer (MISR) data was obtained from the NASA Langley Research Center Atmospheric Science Data Center.

Sand gets everywhere

Saharan dust is currently escaping the confines of the desert and making a break for it over the Atlantic Ocean towards South America.

Below is a true colour image from the MODIS instrument on the TERRA satellite from this morning (6th June). You can see the dust from the desert over the ocean; note the constrast between the darker blue ocean surface and the lighter shade where the dust resides.

Blah.

Image of the dust plume on 6th June 2014 from the Moderate Resolution Imaging Spectroradiometer (MODIS) instrument on the TERRA satellite. Image courtesy of NASA. The strip of bright light across the image is due to sun glint, where sunlight reflects off the ocean surface. Click on the image for a larger view.

Below is the same image but with Aerosol Optical Depth (AOD) overlaid. This provides a measure of the total amount of aerosol particles in the atmosphere. The red portions are values above 0.7, which is quite elevated (anything above 0.3 would be fairly polluted).

Such incidences aren’t particularly unusual and the dust actually acts as a natural fertiliser for the ocean! Dust from the Sahara has also been observed to reach the Amazon rainforest. There are some more satellite images here on the OMPS blog.

Blah.

Image of the dust plume on 6th June 2014 from the Moderate Resolution Imaging Spectroradiometer (MODIS) instrument on the TERRA satellite. Aerosol optical depth from MODIS is overlaid to highlight the location of the dust. Image courtesy of NASA. Click on the image for a larger view.

Dust from the Sahara is also moving across western Europe heading for the UK based on this forecast from the University of Athens, which was highlighted by the Defra Twitter account.

https://twitter.com/DefraUKAir/status/474884744514375680/photo/1

This follows the pollution episode that struck the UK in early April, where Saharan dust combined with pollution from continental Europe and the UK. On this occasion though, thunderstorms are expected during Saturday, which will likely reduce any build-up of pollution and also wash out the dust from the atmosphere.

A sprinkling of dust might be found on cars in the south-east should the forecasts pan out. Dust gets around.

EGU 2014: Measuring aerosol climate impacts from Space

In order to understand past climate change and to better project future changes, we need to understand how humans disturbed the radiative balance of our planet. Aerosols are one component of this disruption. The final report from the Intergovernmental Panel on Climate Change (IPCC) physical science basis concluded that aerosols dominate the uncertainty in the total anthropogenic radiative forcing.

Radiative forcing refers to the change in the energy balance of the climate system; carbon dioxide traps energy within our atmosphere, which leads to a warming effect. Aerosols on the other hand stop sunlight from reaching the surface of the Earth, which leads to less energy being retained by the atmosphere and leads to cooling.

I summarised what the IPCC report said about aerosols here, with some further analysis here.

There were several talks at the EGU on Friday that looked to better constrain the important climate relevant properties of aerosol particles in the atmosphere by observing them from space.

Layer cake

Ralph Kahn from NASA’s Goddard Space Center presented measurements of aerosol properties from the Multi-angle Imaging SpectroRadiometer (MISR) instrument, which flies on the TERRA satellite. His abstract is available here.

The MISR instrument views the Earth from nine different angles as it orbits, which allows it to identify 3-D properties of aerosol particles in the atmosphere. One such example that was presented was from Iceland’s Eyjafjallajökull volcano, which famously closed large swathes of European airspace (disrupting EGU 2010 in the process). Such an eruption is an ideal natural laboratory for assessing aerosol properties from satellites with several of the talks during the day making use of it.

The image below shows how MISR was able to measure the height of the plume of ash thrown into the atmosphere by the eruption. The colouring on the left of the image shows the height of the plume; notice how the plume starts out higher (from 4-6km) and then sinks lower (below 3km).

Blah.

Satellite image of the plume of volcanic ash from the Eyjafjallajökull eruption from 7 May 2010. The image on the left is the natural colour image, while the version on the left has the plume height measured by MISR overlaid. Source: NASA/GSFC/LaRC/JPL MISR Team, retrieved from here.

In terms of volcanic ash, such information is useful for aircraft safety. From a climate perspective, the height of aerosol layers in the atmosphere can strongly influence the strength of the radiative forcing and the vertical distribution of aerosol is something that is represented poorly in climate models.

Cloudy with a chance of aerosols

Jens Redemann from the Bay Area Environmental Research Institute and the NASA AMES research center in the USA presented work that took advantage of a collection of satellites that fly in formation high above the Earth. His abstract is available here.

The satellites are known as the ‘A-Train’ and by combining the data from multiple instruments operating in quick succession, he was able to extract more detailed and valuable information than could be achieved with any one single instrument. Their calculations for clear-sky conditions agreed well with model-based results used in the 2007 IPCC report, with more work planned to compare with more recent model estimates.

However, there were more significant differences when looking at so called all-sky conditions i.e. when clouds are added to the mix. Several of the other talks in the session considered methods to improve retrievals of aerosol properties in the vicinity of clouds, with some encouraging results. The famous image of the Earth taken from Apollo 17 is known as the ‘Blue Marble’ but as an atmospheric scientist, I’m often more struck by how white the globe is when observing it from space. This is an important consideration for assessing the role of aerosols when it comes to climate change.

Anthropogenic, vegetable or mineral

Both Kahn and Redemann presented work aimed at categorising aerosol particles into different types e.g. urban pollution, biomass burning smoke, desert dust. Different types of pollution tend to have differing properties, so distinguishing between them can improve estimates of aerosol climate effects.

Another important distinction is separation into natural and human-caused components, so that the anthropogenic influence can be characterised. This is complicated though by human sourced pollution interacting with natural emissions; such aerosol particles are dazed and confused about their origins.

Such information would be particularly valuable as there is a large degree of diversity in climate model estimates of the various aerosol types, even though their estimate of the overall aerosol burden in the atmosphere is quite similar. Such discrepancies are troubling for future projections of climate change as they will introduce significant errors.

I love it when a plan comes together

Ralph Kahn ended his talk with a call for renewed focus to combine satellite and measurements made more directly (known as in-situ) in order to determine aerosol radiative effects independently of climate models. 

Bringing all of this information together is a big opportunity to better constrain the aerosol radiative forcing, which will greatly improve our ability to project future climate changes at both the global and regional scale.

EGU 2014: Air pollution in the Anthropocene

One of the key strands of the EGU so far this year has been discussion of the proposed new geological time period known as the Anthropocene. This concept was first proposed by the ecologist Eugene Stoemer in the 1980’s, with Nobel Prize Winner and atmospheric chemist Paul Crutzen bringing renewed attention to the term in the early 21st Century. It refers to the concept that the impact of humans on our environment is worthy of its own epoch.

I attended the EGU press conference ‘Are we living in the Anthropocene?’ on Tuesday, where atmospheric chemist John Burrows presented work on how air pollution is a clear fingerprint of human influence on the atmosphere, with subsequent impacts on our environment. You can see a couple of written summaries of them here and also a podcast by the Barometer, which I featured on here.

He illustrated this with several global maps of air pollutants such as nitrogen dioxide and aerosol particles. Nitrogen dioxide is mainly emitted by human activities, particularly vehicles. Fires are another significant source via human activities. I’ve included an example below from a paper on measuring NO2 from space, which showed a weekly cycle in the amount of NO2 in the atmosphere. Major population centres are easily identifiable as red colours in the plot below, while concentrations reach a minimum over marine areas. NO2 has direct health consequences when breathed in and is part of the cocktail of emissions that can go on to produce tiny aerosol particles.

The Global Ozone Monitoring Experiment (GOME) on board the ESA-satellite ERS-2

Nitrogen dioxide (NO2) from the Global Ozone Monitoring Experiment (GOME) on board the ESA-satellite ERS-2. Red colours are major NO2 emission sources.
Source: S. Beirle et al., 2003, Atmospheric Chemistry & Physics (available open access here).

Another illustration is of deforestation and agricultural fires in South America. Such fires occur every year, with a distinct seasonal cycle which peaks in the ‘dry’ season. The plots show monthly averaged aerosol optical depth measured by the MODIS instrument on NASA’s TERRA satellite. This is a measure of the amount of aerosol in a vertical column through the atmosphere.

Fire.

Aerosol optical depth over South America during the fire season from 2010-2012. Source: NASA’s TERRA mission via the Giovanni Data and Information Services Centre.

The smoke builds up over large areas of the continent and has potentially significant implications for climate, weather, human health and ecosystem development. There is also a large degree of variation from year-to-year, with the peak in 2010 being due to a substantial drought in the Amazon. Such conditions provoke more burning as it is tough to burn rainforests when it is raining! Furthermore, the lack of rain means that removal of the smoke from the atmosphere is reduced, so the smoke can form a dense layer of pollution. The burning is often more intense also as the forest environment is more susceptible to fire.

Biomass burning occurs on particularly large scales across South America, Africa and Indonesia and reflects a considerable environmental and atmospheric fingerprint by human activity. Deforestation has drastically changed the face of the Amazon Rainforest over the past 40 years, which I’ve written about previously here.

Atmospheric sleuthing

Air pollution provides a clear, distinct and global signature of human influence on our atmosphere and is known to have significant implications for our environment. This fingerprint is just one of many that has potentially led us into the Anthropocene. Identifying the issues is just one part of problem; tackling them is quite another.