EGU Blogs

Climate

Spoiling the view

Probably the most obvious manifestation of air pollution comes when looking out of the window and scanning the horizon – does the landscape go on for miles or is the view reduced? The build-up of air pollution can often dramatically reduce visibility via a shroud of haze.

On a recent trip to the Turkish Mediterranean coast near Antalya, the impact of air pollution on visibility was abundantly apparent. Below are two photographs I took of the view.

View of

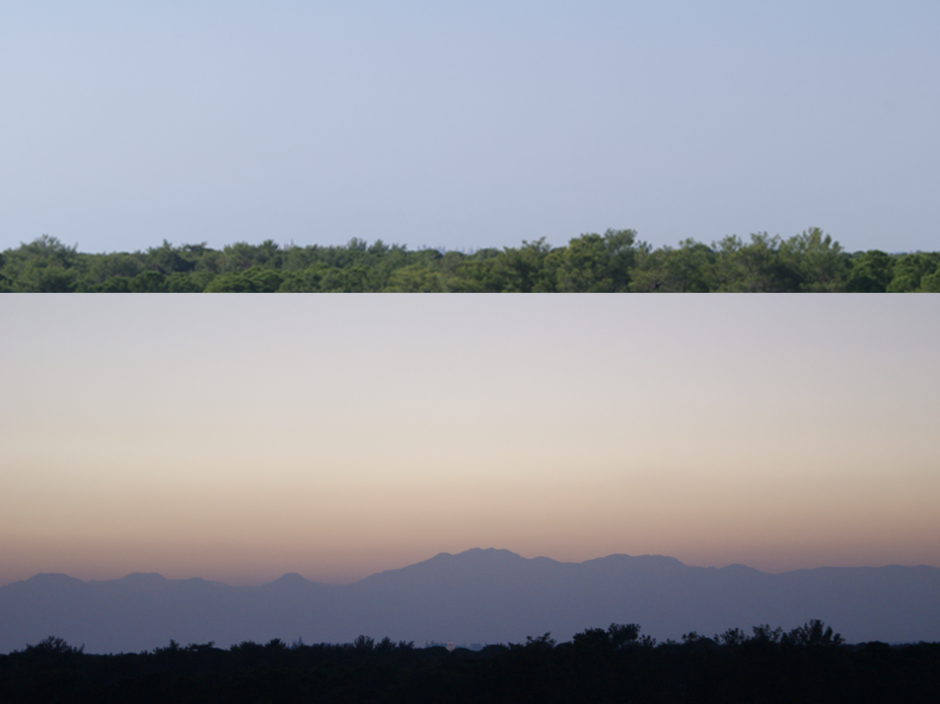
View of the Beydağları Mountains in Antalya Province, Turkey. The top image is from the morning of 11th November 2013, while the bottom image is at sunset on the 12th November 2013. Photographs by Will Morgan (me).

The photographs look out to the west from the hotel I was staying in. In the top picture, there is little to see aside from a few tall buildings just observable beyond the trees in the foreground. In the bottom image though, the Beydağları Mountains can be seen, although the view is still hazy. The mountains were approximately 20 miles (32 km) away, so to not be able to see the mountains at all in the top picture requires a large amount of haze. During the ten day trip, views like the top image were far more common.

Antalya province is surrounded by the Taurus Mountains, with the Mediterranean sea to the south, so it forms a bowl-like basin where air pollution can build. It is also very sunny, which gives atmospheric chemistry an extra kick to form air pollution. This cocktail is similar to other pollution hotspots such as Mexico  City and Los Angeles.

The other key feature is that temperature inversions are common in Antalya. Typically, the temperature cools in the lowest part of the atmosphere with height but these inversions see a reversal of this trend within the first few hundred metres, which prevents air rising and mixing efficiently. You end up with a basin with a lid on it, so when pollutants are emitted into this, they find it difficult to disperse. This is like mixing a squash or cordial with water and only filling the glass half way with water – the amount of cordial (pollutant emissions) remains fixed but the reduced water level (temperature inversion) sees the concentration rise. Below is a video of a demonstration of temperature inversions, which actually refers to air pollution in Denver.

Click here to display content from YouTube.
Learn more in YouTube’s privacy policy.

The apparent major source of air pollution in Antalya is the burning of low-quality coal and domestic wood burning, which is particularly prevalent during the winter. I also noticed small fires from agricultural and trash burning during my stay. Summer temperatures typically exceed 30°C, so air conditioning is common rather than central heating systems. Evening and overnight temperatures during the winter drop below 10°C, so some form of heating is required.

The impact of air pollution on visibility is clear in the region and the health implications are also known, with Doctors warning about the risk from air pollution. Just this week, there were news reports warning that Antalya would experience poor air quality this winter.

Tackling the challenge is not easy though, especially given that the geographical and meteorological conditions in the region can’t be controlled. Antalya illustrates the interplay between these natural factors and our own role in pollutant emissions, which presents particular difficulties when trying to improve air quality. This interplay is prevalent across the globe.

An aerosol is born: solving the nucleation recipe

One of the most fundamental aspects of aerosols that we are continually striving to understand is how they are actually born. One pathway that aerosol particles can take is a process known as “nucleation“. This nucleation process is where new particles are formed by gaseous molecules getting together and deciding that they’ve had enough of the gas-phase and would prefer to be tiny aerosol particles instead. Aerosol particles are pretty small at the best of times, but these are really tiny; the initial particles are around 100,000 times smaller than the width of a human hair!

Many of the important steps in the birth of these particles occur when they are less than 2-nanometres in diameter. If the conditions are suitable, these newly formed particles can then grow to larger sizes (50-100 nanometres). It is at this point that these particles get interesting from a climate point of view as they can serve as the seeds for clouds. Newly formed particles from nucleation represent a large fraction of the building blocks of clouds (known as cloud condensation nuclei) – potentially around half of the cloud condensation nuclei in our atmosphere come from nucleation.

Nucleation in our atmosphere has been observed regularly across the globe, ranging from remote forests to heavily-populated cities.  However, our understanding of the nucleation recipe has been limited, as it proved extremely difficult to actually measure the first steps of nucleation. This is where a new study in Nature steps in.

The cleanest box in the world

The study reports on the latest series of experiments using the ‘cleanest box in the world‘ at CERN for a project known as CLOUD. The experiments take place in a 26 m3 stainless steel box (or chamber if you prefer the fancy terminology), that has very precise controls for temperature and delivery of whatever cocktail of gases the scientists wish to introduce. The chamber is able to simulate cosmic rays using the CERN Proton Synchrotron, a 628 metre long particle accelerator.

The idea with chambers such as this is to recreate conditions similar to the real atmosphere in the laboratory, where things can be controlled more precisely and annoyances like the weather don’t get in the way. These sorts of experiments are ideal for improving our understanding of particular mechanisms, such as how are aerosol particles born?

View inside the CLOUD chamber. Image courtesy of CERN.

For many years, it was known that the nucleation recipe required the presence of sulphuric acid in order to occur. However, experiments in the laboratory did not agree with our observations in the real atmosphere, while there were also theoretical limitations on nucleation involving only sulphuric acid. CLOUD has been able to show how important other molecules are.

The first major result from the project was published in Nature in 2011 and demonstrated that ammonia was a crucial ingredient for nucleation.  The most recent Nature paper presented results showing that a cousin of ammonia, known as amines, promotes even more nucleation. Both ammonia and amines are produced predominantly by agricultural activities, such as fertiliser application and animal husbandry. It turns out that cows are one of the keys to nucleation!

A crucial finding of the new study is that only a relatively small addition of amines to the nucleation recipe is required to close the gap between laboratory and atmospheric measurements. Adding a dash of amines to the mix increases the rate of nucleation by more than a 1,000 compared to the previous results for the ammonia system. The level of amines required is also comparable to typical values measured in the atmosphere, although relatively few measurements exist at present. Nonetheless, it suggests that amines play an important role in nucleation in our atmosphere.

Intergalactic planetary

Adding amines to the mix gets the laboratory results into the same ballpark as the atmospheric observations but the results suggest that some ingredients are still missing…

CERN is able to simulate the addition of ions from Galactic Cosmic Rays to the mixture, with ions known to enhance nucleation. The work done at CLOUD so far suggests that these ions play a limited role in the lower part of the atmosphere. The studies have stressed though that the impact of ions on other systems needs to be studied and that some remote areas in the mid-troposphere may be more susceptible to ion-induced nucleation.

The major remaining candidate is organic compounds, which are known to play a role in nucleation based on atmospheric observations. We know that organic compounds are a major player for aerosols across the globe and they are often the dominant ingredient. Much of the more recent work from CLOUD that has been presented at scientific conferences has focused on these organic compounds. The indications are that they play a crucial role in both the initial particle formation and their growth.

The growth of these particles is crucial for their potential climate impact – if they don’t grow, they won’t become the seeds for clouds. CLOUD has been doing a lot of work on these “growth” experiments, with plans to connect the whole process to actual clouds (rather than tortured acronyms).

The CLOUD experiments have thus far hugely improved our understanding of the nucleation recipe and there will likely be further important discoveries. The climate implications of these new mechanisms will come under great scrutiny  in the future. In terms of the experiments themselves, probably the most important aspect is that the chamber is incredibly clean – given CERN’s association with the so-called “God-particle“, it seems that cleanliness really is next to Godliness.

The role of aerosol uncertainty in climate change

For those who follow [pun intended] the world of climate science on Twitter, you’ll very likely have noticed a string of tweets from a meeting at the Royal Society on the “Next steps in climate science“. The programme (PDF here) has included a wide range of topics relating to climate science and has included a number of scientists who heavily contributed to the recent IPCC Working Group One assessment report.

I put together a Storify of the discussion relating to a talk by Dr Oliver Boucher from the Met Office Hadley Centre on the role of aerosols in the session on “How large are uncertainties in forcings and feedbacks and how can they be reduced?” – the discussion can be accessed below or by clicking here.

Image of the global aerosol distribution produced by NASA. The image was produced using high-resolution modelling by William Putman from NASA/Goddard. The colours show the swirls of aerosol particles formed from the numerous sources across the globe. The colours show aerosol particles as dust (gold/brown), sea-spray (blue), biomass burning/wildfires (green) and industrial/urban (white).

Image of the global aerosol distribution produced by NASA. The image was produced using high-resolution modelling by William Putman from NASA/Goddard. The colours show the swirls of aerosol particles formed from the numerous sources across the globe. The colours show aerosol particles as dust (gold/brown), sea-spray (blue), biomass burning/wildfires (green) and industrial/urban (white). Trying to untangle all of this is extremely challenging!

The event itself has been an excellent distraction example of scientists communicating with a wide audience and is yet another example of social media adding something extra to scientific meetings. I wasn’t able to attend but I found the discussions on Twitter interesting, engaging and thought provoking. Many thanks to the speakers, tweeters and the Royal Society.

http://storify.com/willtmorgan/how-large-are-uncertainties-in-forcings-and-feedba?

Biomass burning birthday

Last September I spent a month in Brazil for a research project aiming to study the pollution produced by deforestation fires in the Amazon Basin. The fires are mainly started by people for agricultural needs or land clearing for buildings and infrastructure. These fires produce huge amounts of smoke that blanket vast regions of South America during the “dry” season, which can lead to significant affects on weather, climate and people’s health. The name of the project was SAMBBA (South American Biomass Burning Analysis) and I’ve written a little about it previously here. There are several aspects to the project but my major role was on board the Facility for Airborne Atmospheric Measurement’s BAe-146 research aircraft. I was a mission scientist, which basically means I get to tell the pilots where to fly (subject to standard aircraft operating procedures like avoiding mountains, severe storms and not running out of fuel).

The Amazon usually conjures up images of pristine rainforest and giant meandering rivers but in the quest for air pollution, we were based in Porto Velho, which is the capital of Rondonia – a global poster-child for deforestation. Recently, a project involving Google, the U.S. Geological Survey (USGS), NASA and Time published an extraordinary series of satellite images from the Landsat program showing how the surface of the Earth has changed since the program began in 1984. One of the areas highlighted was Rondonia and the images showed how dramatically the landscape has changed over several decades. While deforestation began there in the 1970’s, the changes detailed in the images from Landsat are clear to see and are shown below. In 1984, the typical ‘fish-bone’ pattern of deforestation is already evident as pathways into the Amazon rainforest are cleared and tributaries of fire branch out from these. By 2012, the deforestation has spread out to envelop large swathes of areas that were previously rainforest.

Comparison of deforestation of part of the Amazon rainforest in Rondonia state, Brazil from 1984 and 2012. The area pictured is to the south and south-east of Ji Parana and covers an area of approximately 60 x 120 miles. Images are from Google. An interactive version where you can expand the view and also visit other areas of the globe is available here, which is worth doing as it gives a feel for the scale over which the deforestation occurs.

This tweet by the EGU twitter account reminded me that it is a whole year since one of our most successful flights of the campaign, which took place in Rondonia. The image below shows the view of the fire we flew through from a satellite, with the smoke plume extending over 80km downwind and also a side-on view of the fire that I took from the aircraft. The fire was to the south-west of Porto Velho in a protected area, where you wouldn’t usually expect to see fires. After travelling to the home of deforestation in Brazil, the largest fire we found was actually a wildfire!

Satellite (top) and side-on view taken from Bae-146 research aircraft (bottom) of a large fire plume that was sampled in Rondonia on 20th September 2012 during SAMBBA. The red line overlayed on the satellite image is 80km long, with the fire plume visible to the left of the line. The satellite image is from NASA’s Terra mission.

The key thing we were trying to investigate during the flight was how the properties of the smoke plume changed as it blew downwind. This is the crucial intermediate step between the actual initial conditions on the ground where the fire starts and the regional build up of smoke haze that affects weather and climate. To do this, we performed a series of flight patterns including:

  1. Flying across the plume at regular intervals along the length of the plume e.g. above the fire, 20km from the fire, 40km from the fire etc.
  2. Flying directly up the length of plume, which is a particular challenge for the pilots as the plume doesn’t generally follow a straight line and you can’t actually see anything.

With these measurements, we can can compare how the properties of the smoke change with distance from the fire. We can combine this information with measurements just a few hundred metres above the fire, as well as flights in older regional pollution to understand the entire life cycle of fires in this region and compare it with other types of fire in various areas of the globe.

We’ve been working hard over the past year analysing the data from this flight and all of the other SAMBBA flights and hopefully there will be much more of the actual science story to tell on this over the next 12 months and more. Stay tuned.