On rare occasions I hear about a story that must be told. This story is one of those and I feel that it deserves attention from the broader geoscience community.
We have all heard of the L’Aquila verdict against the Italian seismologists concerning the devastating earthquake in 2009. If you haven’t, read these articles by Chris Rowan. At the time the guilty verdict was handed down the entire geoscience community felt stunned that such a thing could have happened. The prevailing attitude was that it should not be possible to accuse and convict scientists for practicing responsible science. However, the old adage goes: those who don’t learn from history are doomed to repeat it. This brings me to the topic of this post, which was a very near miss by the Italian justice system against four geochemists from the University of Siena.
I originally heard of the story at Goldschmidt 2013 in Florence during a presentation by Dr. Luigi Marini and I wrote a short note about it in my daily summary of the conference on this blog. After the conference I asked Dr. Marini for more information as I felt the details of this case needed to be heard. I recently heard back from Dr. Marini that the case has now been resolved in favour of the geochemists and I am now free to write about their story on this blog.
The story begins, in December 2002, with several geochemists from the University of Siena being asked by the Italian Ministry of Defense to perform a geochemical-environmental study in the Sardinian Poligono Interforze Salto di Quirra (PISQ), comprising the two firing ranges of Perdasdefogu and Capo San Lorenzo.
Numerous different military activities were carried out at the PISQ since July 1st, 1956, including: (i) launch of rockets (ii) release of bombs from airplanes and helicopters (iii) use of artillery, from land and ships (iv) tests of pressurized pipes.
According to media and some local associations, Depleted-Uranium (DU) ammunitions were used in the PISQ and caused the so-called “Quirra Syndrome”. The “Quirra Syndrome” refers to an apparently greater-than-normal incidence of illnesses in the local population and military personnel that served at the Quirra base. It occurs mainly as cancers and natal genetic malformations. However, the “Quirra Syndrome” has not been confirmed by the Italian national health authority, the Istituto Superiore di Sanità (ISS).
So one of the goals of the Siena geochemists was to determine if DU had been used in tests.

Google screen capture of Sardinia. Quirra, which is the subject of the study, is the red pointed location.
On the face of it the task seems simple enough: analyze soil, plants and water for U and its isotopic ratio and other potential contaminants from the munitions range (of which are there many). However, the complicating factor in all of this is that fact that adjacent to the firing range is an abandoned mine site called Baccu Locci. The Baccu Locci mine contains significant quantities of arsenopyrite and galena, which are arsenic and lead bearing minerals. Both arsenic and lead are known to have detrimental effects on the environment and humans. So the real question then becomes which is it? Mine waste or DU or other military contaminants? Furthermore, historical records from PISQ say no DU was used in the region, however, lots of other munitions with their own suite of toxic components may have been. Therefore, isolating a single cause of the possible impacts on the environment and humans becomes very complex indeed.
Taking a quick step back let’s review some of the basic science in question here.
What is DU?
DU stands for depleted uranium and it was the central contaminant discussed in the case. Uranium comes in many isotopes but the two most common are 238U and 235U. Most uranium found in nature is ~99.2% 238U and ~0.7% 235U. However, most nuclear reactors use fuel that is enriched in the isotope 235U to around 20% as it is more easily fissionable than natural uranium. A by-product of the enrichment process is uranium that is missing its 235U and has a larger proportion of 238U than is normally found in nature. This uranium is said to be depleted as it has had the 235U removed. This DU can then be used for other applications outside of the nuclear industry as it has the rare property of being one of the most dense metals known. This property makes it used in a wide variety of industries but particularly in military applications as a tip for missiles, armour penetrating bullets and other types of scary munitions. DU munitions have been used in Desert Storm, Bosnia, Kosovo and recently in Iraq and Afghanistan and at numerous munitions test sites around the world.

US Navy personnel inspect linked belts of DU tipped ammunition (Wikimedia Commons)
The problem is that when DU munitions are used the uranium is blown into millions of tiny particulates that can spread on the wind and introduce widespread contamination to the environment. DU contamination is a serious issue. The radiological risks of DU are low in comparison to many other radionuclides due the long half life of 238U and the low energy alpha particles that it emits although they cannot be ignored altogether if the concentration of DU is high. The far greater risk from DU, however, is the high toxicity of the uranium metal itself as it attacks the kidneys in people similar to metals such as lead and cadmium. DU exposure has been linked to cancer, birth defects and other diseases for people living in contaminated areas and diseases afflicting veterans of the Gulf War as it acts in concert with other contaminants from these former war zones.
Acid Mine Drainage
Acid mine drainage is a phenomenon that many geochemists work with every day. In brief it occurs when sulphide minerals like galena (PbS), pyrite (FeS2) or arsenopyrite (FeAsS) are left exposed to open atmosphere and precipitation. What happens is a chemical oxidation reaction in which the sulphide minerals such as galena (PbS), pyrite (FeS) or arsenopyrite (FeAsS) react with air and water to release sulphuric acid and free metal ions. In the case of galena you get lead or arsenic from arsenopyrite.

An extreme example of acid mine drainage from a mine in Spain. (Wikimedia Commons)
Indeed, Frau et. al. (2009), found significant evidence of contamination from Baccu Locci Mine wastes in streams leading from the region, which is a tributary of the larger Quirra River that flows through the village into the Tyrrhenian Sea. The paper found elevated concentrations of lead, cadmium, zinc and arsenic near mine wastes, however, concentrations decreased downstream due to dilution and precipitation of insoluble lead-arsenic minerals. These heavy metals could have detrimental effect on the health of local residents.
OK, so back to the case.
The researchers from the University of Siena did what was asked of them and analyzed over 1500 samples for a variety of contaminants, including the 235U/238U ratio (on selected samples), totalling 25,000 results. Their findings were that there was no contamination from DU in the region and that the 235U/238U was on par with the natural 235U/238U ratio. However, they did find elevated levels of arsenic and lead around the former mine site and in catchments draining it.

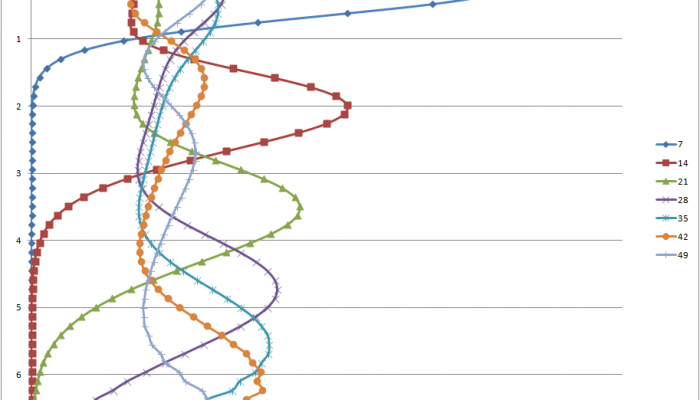
Distribution map of uranium concentrations in top-soils of the two firing ranges of Perdasdefogu and Capo San Lorenzo and nearby areas (from the Siena University report, 2004).
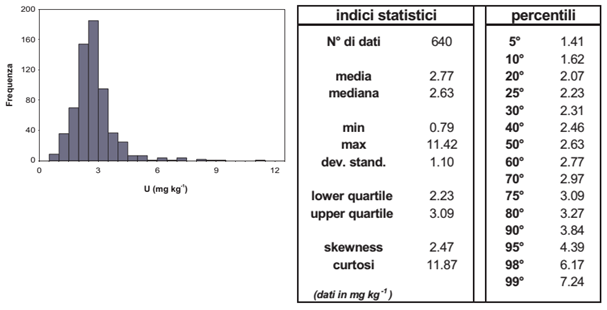
Histogram (left) and statistical parameters of uranium concentrations in the top-soils of the two firing ranges of Perdasdefogu and Capo San Lorenzo and nearby areas (from the Siena University report, 2004).
Furthermore, one of the supporters of the Quirra syndrome conducted health related modelling using a code called HOTSPOT and found that in order to cause the anomalous number of cancers observed in Quirra between 80-140 tons of DU had to have been used, which is an absolutely huge amount (Zucchetti 2005).
These results met with extreme opposition from the local prosecutor who acted on the advice of a nuclear physicist from the University of Brescia who felt that geochemistry was not the proper way to investigate this problem and that the University of Siena scientists were hiding something. Indeed, the physicist felt that thorium was the true culprit and that geochemists were not qualified to analyze for radioactive contamination. (I obviously take great exception to this notion as a radioisotope geochemist and user of an accelerator mass spectrometer). Anyway, the geochemists were charged with two crimes in connection with their results:
- Not stating the danger of anomalous concentrations of thorium present at the firing ranges.
- Using knowledge the geochemists had gained from their previous work on DU in Kosovo to select methods that prevented them from detecting depleted uranium at PISQ.
In answer to the first charge the geochemists provided results of Th analyses for soils in the Quirra region. These show that there are no Th anomalies present in the soil. Therefore, the notion that Th is somehow the hidden, skulking culprit in all of this is simply not the case.
In answer to the second charge that the geochemists knowingly sampled in such a way as to conceal the detection of DU one simply has to look at the aims of the two investigations. In Kosovo the Siena scientists were sampling a small area with known DU contamination and a documented history of DU use. This makes it much simpler to find DU and sample for it. On the other hand, in Quirra, the use of DU has not been confirmed and the study area was far larger. This means that instead of a small scale, targeted sampling campaign the appropriate investigation tactic was a broad, large scale sampling effort that attempted to give an overview of contamination in the region. If DU was found a more detailed look could then be performed in that specific site. However, since no DU was found no more sampling was necessary.
Ultimately, the court appointed an independent expert to examine the results of the University of Siena geochemists in the light of these two charges before proceeding to trial. The expert found that the methods used by the University of Siena researchers were completely reasonable and that there was no evidence of a Th or DU anomaly. Thus on July 11, 2014 the case against the geochemists was dismissed and they were completely exonerated as the victims of unjustified persecution.
This entire episode was certainly very hard for the scientists from the University of Siena. In addition, it should also serve as a cautionary tale for the larger scientific community. This story can only breed hesitation and reticence on the part of scientists to participate in such efforts to help the public. Such aggression on the part of the local prosecutor is a warning to other scientists to stay away from the Quirra region and avoid the potential liability that comes with it. On a larger scale, this trial warns scientists outside of Italy that participating in issues involving human health, or ones that are emotionally charged, can be a bad thing. This lesson is not one that helps people. By telling scientists that if we don’t like your results we’ll attack you personally only turns us away and ultimately enhances ignorance and short sighted decision making. It will be a sad day indeed when I or others turn down a project because of the liability risk involved when we could actually be helping the public interest by practicing responsible science. I hope that this is not what Italy or other nations are coming to.
Thanks for reading! I would also like to acknowledge Dr. Luigi Marini for keeping me updated over the past several months as the trial progressed and his permission to blog about such an important issue.
References
Cristaldi M, Foschi C, Szpunar G, Brini C, Marinelli F, Triolo L. Toxic emissions from a military test site in the territory of Sardinia, Italy. Int J Environ Res Public Health. 2013;10(4):1631–46.
Frau F, Ardau C, Fanfani L. Environmental geochemistry and mineralogy of lead at the old mine area of Baccu Locci (south-east Sardinia, Italy). J Geochemical Explor. 2009;100(2-3):105–15.
Marini L. – Goldschmidt Abstracts 2013. Mineral Mag. 2013;77(5):1661–817. Available from: http://goldschmidt.info/2013/abstracts/finalPDFs/1685.pdf
Zucchetti M. Environmental Pollution and Health Effects in the Quirra Area, Sardinia Island (Italy) and the Depleted Uranium Case. J Environ Prot Ecol. 2006; 7(1): 82-92