A recently published paper (by myself and colleagues from uOttawa and Environment Canada) investigates the environmental fate of the long lived radioisotope of iodine, 129I, which was released by the Fukushima-Daichii Nuclear Accident (FDNA). Within 6 days of the FDNA 129I concentrations in Vancouver precipitation increased 5-15 times above pre-Fukushima concentrations and then rapidly returned to background. The concentrations of 129I reached were never remotely close to being dangerous, however they were sufficient to distinguish the impact of the FDNA on the region.
Subsequent sampling of groundwater revealed slight increases in 129I concentration that were coincident with the expected recharge times. This suggests that a small fraction of the FDNA-derived 129I may have been transported into local groundwater after infiltrating through soils.
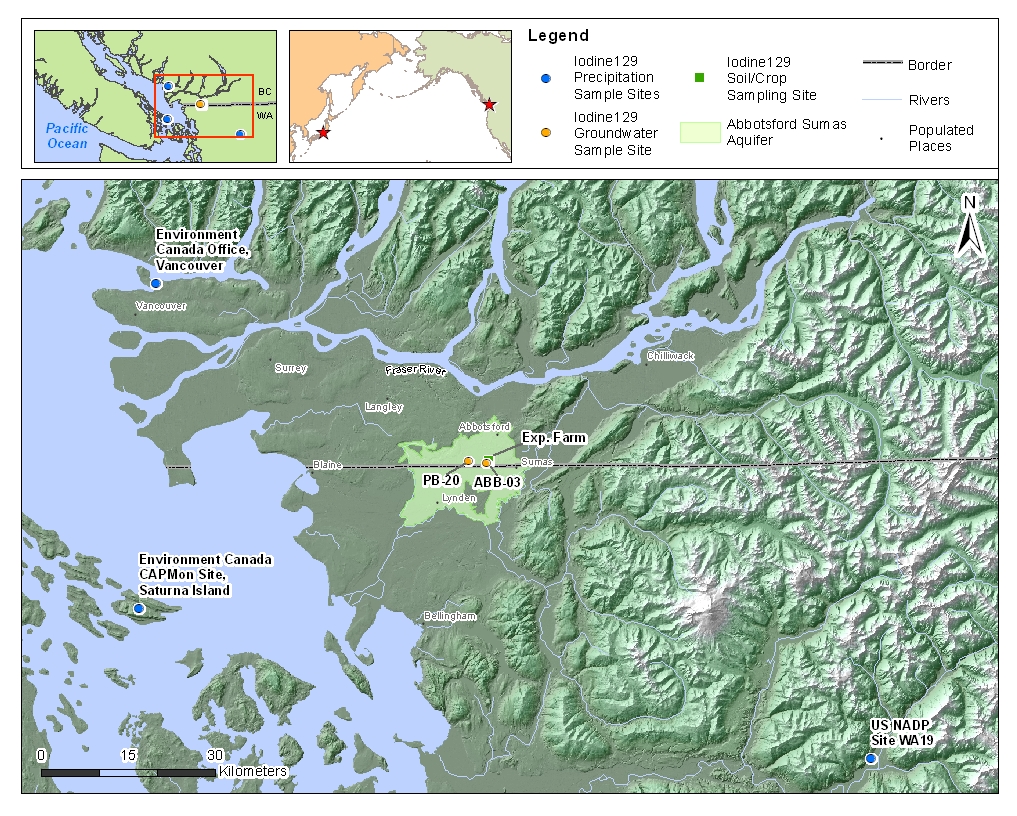
Sample map showing location of all three precipitation sampling locations as well as the location of both wells used for groundwater sampling. The surface expression of the Abbotsford-Sumas Aquifer is shaded.
What is iodine-129 and where does it come from?
Iodine-129 is the longest lived isotope of iodine with a half-life of 15.7 million years. It is radioactive and occurs everywhere throughout the environment. It is produced in three ways. The first two are natural and the third is by the nuclear industry.
The natural production of 129I occurs in the atmosphere and in soil/rocks. The atmospheric production happens when a cosmic ray proton hits a xenon-129 nucleus and removes a neutron, replacing it and creating an iodine-129 nucleus. The production in soil and rocks happens when a uranium-238 nucleus spontaneously fissions and one of the halves it releases has a mass of 129 ala, iodine-129.
The anthropogenic production occurs because when uranium fissions in a nuclear reactor sometimes one of the parts is 129I. This anthropogenic production is by far the largest source in the environment as substantial amounts have been released by nuclear fuel reprocessing. This 129I that has been released can trace a host of environmental processes and inform us about what happens to 129I or the much more dangerous, 131I. The current levels of 129I are much too low to pose a health threat to humans or the environment, but do allow 129I to be used as an environmental tracer.
129I from Fukushima is present in Vancouver, B.C. rain
The purpose of this research was to discover the fate of 129I in the released by Fukushima, which although a small amount, was isolated in time and space. We measured the 129I deposition in rain and its subsequent movement though soils and see if it reached groundwater. The results tell us about the impact of Fukushima, how 129I moves, where it is attenuated, and how quickly contaminants in this aquifer move from the ground surface to the water table. This knowledge can then be applied to understand 129I behavior in other settings such as nuclear waste repositories and watersheds or it can be used to learn about the behavior of other types of contaminant in this aquifer and how vulnerable it is to contamination.
The results in rain show an increase in 129I concentrations of up to 220 million atoms/L*. This increase was seen ~6-10 days after the emission from Fukushima began and are 5-15 times higher than rain samples collected before Fukushima. Following this increase 129I concentrations returned to background with a few weeks. This agrees with other studies monitoring the fallout of Fukushima derived radioisotopes [Wetherbee et al., 2012]. Furthermore, atmospheric back trajectory modelling shows trajectories for air parcels arriving in Vancouver from over the Pacific ocean and Japan.
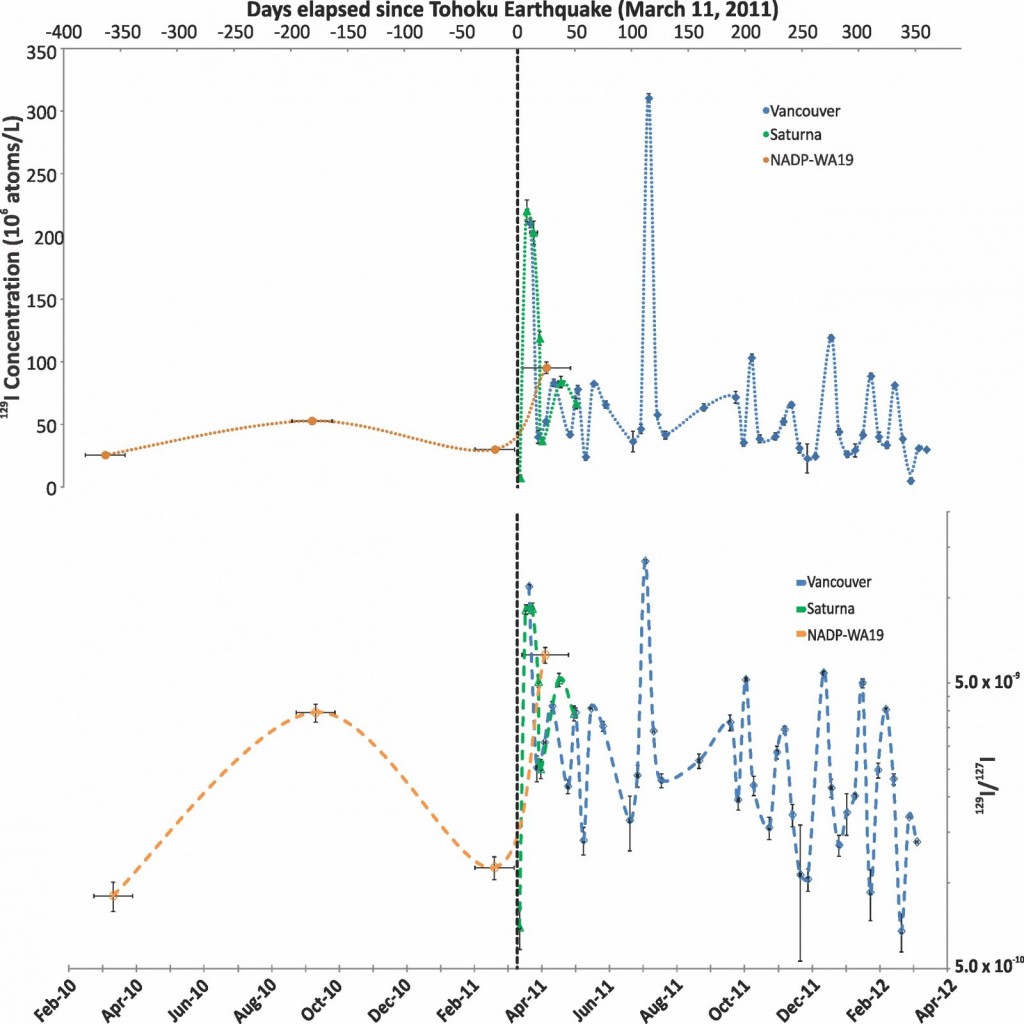
Variation in the concentration of 129I and the 129I/127I ratio in precipitation from Vancouver, Saturna Island and NADP site WA19 over time. The time range that each NADP sample integrates is displayed using horizontal error bars. 1σ error is contained within data points if not visible. The dashed vertical line shows the date of the FDNA relative to samples.
We also calculated the mass flux of 129I from Fukushima. That is the actual quantity of 129I that was deposited on the region in grams, or in this case in atoms/m2. This was calculated by simply multiplying the concentration of 129I in rain by the amount of rain that fell. We found that only about 15% of the annual 129I deposition in the Vancouver region could be directly linked to Fukushima affected rain events. The total mass deposited by Fukushima was ~0.0000000000002 (2 x 10^-13) grams. This is a negligibly small quantity with respect to radioactive risk.
Despite the fact that the deposition of 129I from Fukushima was infinitesimally small it was still measurable. Therefore, the question became where did it go and can we learn about local groundwater resources using 129I as a tracer?
129I variation in groundwater may be due to Fukushima
The results in groundwater show very small 129I concentration increases. Two different wells were sampled. The first had a recharge time, which is the time it takes for water to move from the water table to the well screen, where it is sampled, of 0.9 years and the second had a recharge time of 1.2 years [Wassenaar et al., 2006]. The exact time it takes for water and dissolved contaminants to travel through the unsaturated zone was unknown. However, the sediments of this aquifer are very coarse and are known for their ability to rapidly transport contaminants, such as nitrate [Chesnaux and Allen, 2007]. Therefore, if we were going to see 129I from Fukushima this was an ideal location.
The increases in groundwater 129I concentrations were seen in two different wells (ABB03 and PB20) located close to one another. The two wells also had slightly different recharge times. The first was 0.9 years and the second was 1.2 years. The 129I anomaly in the first well occurred at 0.9 years and in the second well at 1.2 years. These 129I anomalies, which occurred exactly when the recharge age predicted they would, suggests that some of the 129I deposited by Fukushima was reaching the wells and causing these increases.
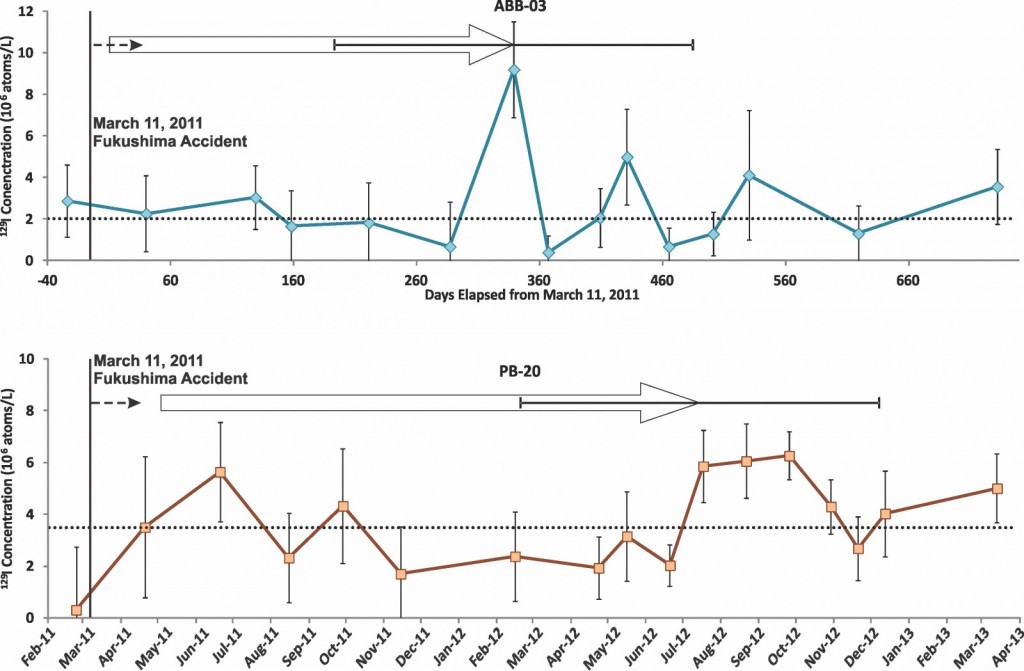
Temporal variation in the concentration of 129I in groundwater in ABB03 and PB20. The solid vertical line shows the date of the Fukushima accident and the dashed horizontal line shows the median of each dataset respectively. The 3H/3He ages from [Wassenaar et al., 2006] of groundwater in each well and their uncertainty is pictured as the solid arrow which is aligned with the 129I anomaly possibly caused by the FDNA. The dashed arrow covers a 40 day (0.11 year) time span and represents a possible vadose zone transport time.
The time it took for 129I to reach the water table in the model was then added to the previously dated recharge time to get an estimate for how long it might take 129I from Fukushima to reach the wells we sampled. The results show that it is indeed possible for 129I deposited in rain to infiltrate through the unsaturated zone and reach the wells in time for us to detect it. However, this rapid transport assumes that certain flow paths exist to rapidly conduct 129I due to the heterogeneous lithology of the unsaturated zone. There is evidence of such flow paths [McArthur et al., 2010].
To summarize,
- Within a week of the FDNPP accident elevated 129I concentrations were observed in precipitation. This agrees very well with work on other radionuclides in air filters and rain.
- 129I concentrations in rain returned to background within a few weeks. However, discrete pulses of elevated 129I occurred for another several months.
- Elevated 129I concentrations were measured in two wells and corresponded with the expected recharge times indicating that 129I from Fukushima can be traced into groundwater.
- Vadose zone modeling has shown that 129I can be rapidly transported to the water table and reach the well screen in accordance with groundwater ages.
- We propose 129I transport is enhanced by preferential dispersion of 129I that exists due to the heterogeneous nature of the vadose zone.
- This results in variability in groundwater 129I concentrations that preserve the variability in the input of 129I via washout with some dampening of the signal due to attenuation and dilution.
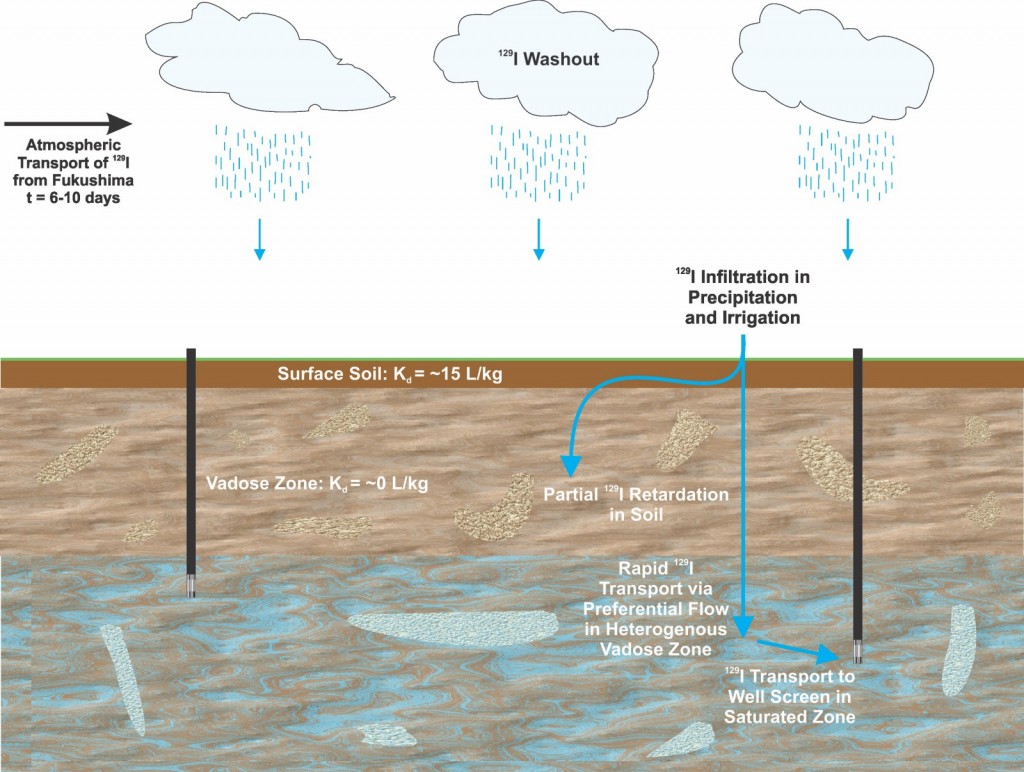
Conceptual model showing the possible transport pathways of Fukushima derived 129I which was deposited via precipitation. A fraction of this 129I was rapidly transported through a heterogeneous vadose zone via preferential flowpaths to groundwater where minor 129I variation was detected. The remainder was retarded or attenuated in the vadose zone during transport.
Thanks for reading, if you have any questions or concerns please leave a comment or send me an email to discuss further!
*Note: 100 million atoms/L of 129I is equivalent to an activity of 0.00000014 (1.4 x 10^-7) Bq/L. These quantities are extremely low level and only the most sensitive analytical methods in the world can detect them. This amount of radioactivity is several orders of magnitude lower than the natural background radiation produced by naturally occurring radionuclides in soil and the atmosphere. For more on naturally occurring radioactivity see here. Even a clean rainfall has about 1 Bq/L of tritium (radioactive hydrogen), which remains from atmospheric weapons testing in the 1960’s
Access the full paper here: http://onlinelibrary.wiley.com/doi/10.1002/2015WR017325/abstract
References
Chesnaux, R., and D. M. Allen (2007), Simulating Nitrate Leaching Profiles in a Highly Permeable Vadose Zone, Environ. Model. Assess., 13(4), 527–539, doi:10.1007/s10666-007-9116-4.
McArthur, S. A. Q., D. M. Allen, and R. D. Luzitano (2010), Resolving scales of aquifer heterogeneity using ground penetrating radar and borehole geophysical logging, Environ. Earth Sci., 63(3), 581–593, doi:10.1007/s12665-010-0726-9.
Wassenaar, L. I., M. J. Hendry, and N. Harrington (2006), Decadal geochemical and isotopic trends for nitrate in a transboundary aquifer and implications for agricultural beneficial management practices., Environ. Sci. Technol., 40(15), 4626–32.
Wetherbee, G. A., D. A. Gay, T. M. Debey, C. M. B. Lehmann, and M. A. Nilles (2012), Wet Deposition of Fission-Product Isotopes to North America from the Fukushima Dai-ichi Incident, March 2011, Environ. Sci. Technol., 46(5), 2574–2582.
