EGU Blogs

Geology Jenga

Lake mud can offer a crucial long-term perspective on flooding

Lake mud can offer a crucial long-term perspective on flooding

The severe flooding that has hit much of northern England during the last few weeks (and northeastern Scotland right now) has generated significant discussion and debate about why floods happen, how often they occur and what we can do about it. The fact is there’s no simple answer to any of these questions: the hydrometeorological cycle is a complex beast and our actions have altered it in myriad ways, from contributing to a warming climate, modifying flow pathways and building in less-than-ideal locations. I recently co-authored a piece at The Conversation that offers some wider context to these discussions.

https://commons.wikimedia.org/wiki/File:Wetherby_Bridge_during_the_December_2015_floods_%2826th_December_2015%29_001.JPG

Wetherby Bridge, 26 December 2015. Photo by: MTaylor848 (WikiCommons).

https://commons.wikimedia.org/wiki/File:York_Floods_2015_-34.jpg

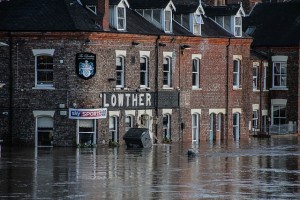
Flooding in York, 27 December 2015. Photo by: Richard Scott (WikiCommons).

While the physics dictating that a warmer atmosphere can hold more moisture is long established, attributing single weather events to climate change and detecting whether floods are becoming more frequent and/or severe floods here in the UK remains tricky business (e.g., Pall et al. (2011) Nature, Trenberth (2011) Wiley Interdisciplinary Reviews: Climate Change or Trenberth et al. (2015) Nature Climate Change, Watts et al. (2015) Progress in Physical Geography). One complicating factor that is widely accepted is that the short duration of existing hydrological records – typically a few decades or less for river gauging stations – means attempts to identify an anthropogenically-triggered signal from natural variability have produced ambiguous results.

This is where sediment sequences may be able to contribute some valuable data, as floods can leave behind an imprint that is sedimentologically different to the material that accumulates day-to-day on a lake bed or on a floodplain. The field of palaeohydrology has a long history but emphasis has really been placed on lake sediment sequences in the past few years. Two recent comprehensive reviews of the state of lacustrine palaeoflood research (Schillereff et al. (2014) Earth-Science Reviews and a book chapter from Gilli et al. (2012)) highlight much impressive work coming from the European Alps, Scandinavia, North America and indeed globally.

There are a number of crucial considerations: how certain can we be that a distinct layer of sediment was in fact deposited by a historical flood? Do all floods leave an imprint? If not, must an event reach a certain discharge for a detectable deposit to be preserved?

When I started my PhD investigating palaeoflood records from British lakes, I quickly discovered another significant barrier: the difficulty of distinguishing flood layers in lakes that accumulate homogeneous sediments, typically fine-grained, organic-rich material – in other words, squishy brown gloop. These sorts of lakes are common in the UK and globally prevalent, especially in temperate regions.

My ex-PhD supervisors and I published a paper in Geology this month (Schillereff et al. ‘Hydrological thresholds and basin control over paleoflood records in lakes‘) that successfully demonstrates a method to obtain palaeoflood records from such lakes (please note the paper is Open Access). Working at Brotherswater, a small lake in the eastern English Lake District, we were able to confirm the provenance of coarse-grained samples (i.e., they were deposited during high river flows), establish the hydrological threshold at which a sedimentary imprint is preserved (i.e., what discharge is required) and ultimately, we hope, provide a blueprint for acquiring palaeoflood records from these sorts of systems elsewhere in the world.

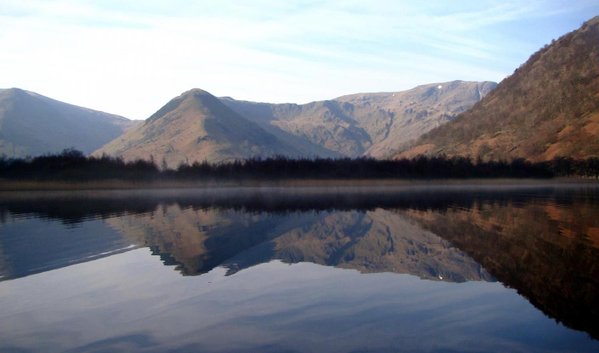
The view south across the catchment of Brotherswater. Photo by: D. Schillereff.

The view south across the catchment of Brotherswater. Photo by: D. Schillereff.

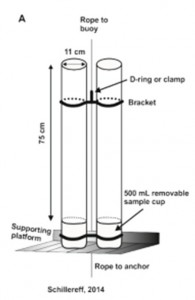
What did the work involve? We installed sediment traps (tubes with exchangeable containers at the bottom – see diagram) in the lake for 18 months enabling us to directly measure the calibre of particles delivered to the lake as incoming river discharge fluctuates through the year. We then looked at sediment cores from the same location; these were made up of material that had accumulated at the lake bed since ~1960 and some of these samples were characterised by very coarse material.

Schematic of the sediment traps installed in Brotherswater. Source: Schillereff, 2014.

Schematic of the sediment traps installed in Brotherswater. Source: Schillereff, 2014.

Statistical analysis of these data indicated there were different groupings of particle sizes that we linked to separate hydrological processes. The coarsest group, or end member, appears in sporadic samples and we infer its appearance to be indicative of a major flood. Our dating of the sediment enables us to pinpoint the timing of each flood and comparing their occurrence with local river flow records has enabled us to establish the discharge threshold that will result in a sedimentary deposit being preserved.

The next image, Figure 3 in our paper, hopefully explains the processing. The left-hand triplet of graphs are the particle size distributions of all samples; the black line (furthest right) in the middle plot represents the coarse fraction. The middle (sediment traps) and right-hand (cores) pairs of graphs depict the contribution each end-member makes through time. The black bars periodically reach well over 50%; material of this calibre almost certainly must have been delivered during high discharges, so we can use its appearance as a palaeoflood signature.

End-member modelling of particle size data from sediment trap and core samples. See text for explanation. Source: Schillereff et al. (2016)

End-member modelling of particle size data from sediment trap and core samples. See text for explanation. Site A is closer to the inflow, site B is in the lake centre. Source: Schillereff et al. (2016)

Having established more confidently the characteristics of palaeoflood laminations, we can begin to examine long sediment cores and count the frequency and calculate the magnitude of floods that have occurred during past centuries and ideally millennia. This work is progressing nicely and we plan to submit our findings from Brotherswater and other regional lakes that place the recent Cumbrian floods (2005, 2009, 2015) in a longer-term context for peer-review this year.
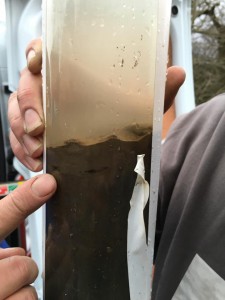
Sediment core extracted from Bassenthwaite Lake, Cumbria, on 7 January 2016. The light-coloured band at the surface most likely reflects material deposited by the severe flood triggered by Storm Desmond in early December. Photo courtesy of R. Chiverrell, University of Liverpool.

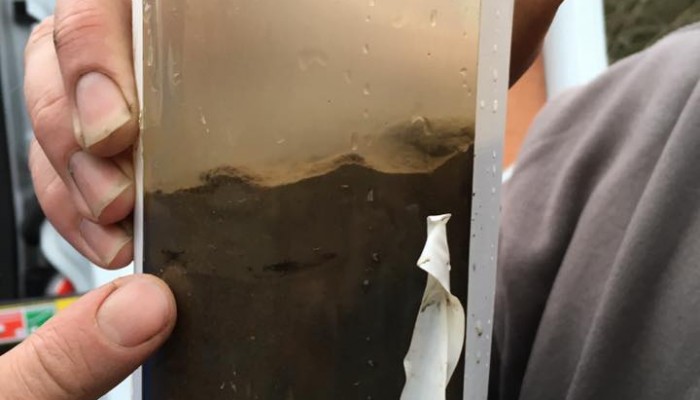
Sediment core extracted from Bassenthwaite Lake, Cumbria, on 7 January 2016. The light-coloured band at the surface most likely reflects material deposited by the severe flood triggered by Storm Desmond in early December. Photo courtesy of R. Chiverrell, University of Liverpool.

Yet another way we are altering Earth’s natural functioning

Yet another way we are altering Earth’s natural functioning

So it has been a while since I last blogged, attributed to various excuses – fieldwork, moving job, moving house – but moving forwards I intend to spend more time discussing the myriad aspects of geoscience I find fascinating. One good example is a recent paper from Janice Brahney (University of British Columbia) and colleagues in Global Biogeochemical Cycles entitled ‘Is atmospheric phosphorus pollution altering global alpine Lake stoichiometry?’, which builds on their recent examining the influences rising atmospheric emissions of nitrogen (N) and phosphorus (P), driven by human activity, are having on lake ecosystems by taking a global look.

This is a topic I’ve taken real interest in over the last couple of years as it merges research on lakes (I worked on lake sediment records of environmental change for my PhD) with investigating biogeochemical cycling of macronutrients, which was the focus of my recent Postdoc on the LTLS Macronutrient Cycles project.

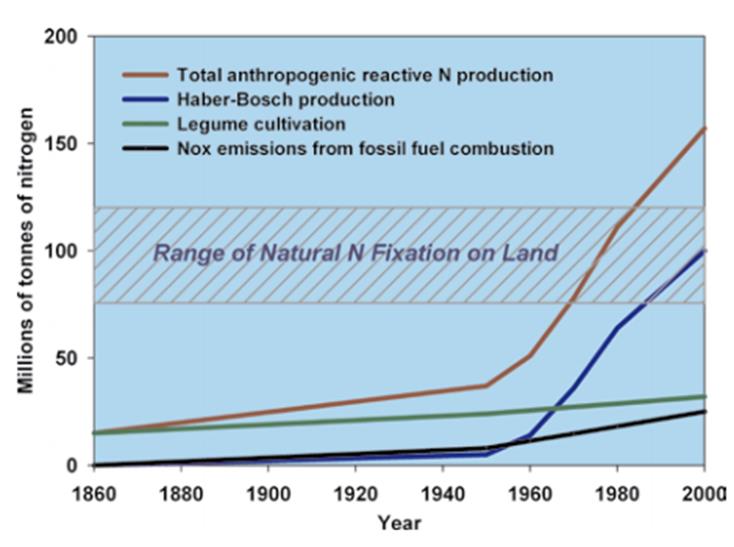
Anthropogenic changes to the nitrogen and phosphorus budgets have predominantly occurred through the 20th Century: the supply of reactive N (the form that supports plant growth) has exploded since the 1950s, especially in the northern hemisphere, led by industrial expansion and use of fertilisers in agriculture (Haber-Bosch process). Phosphorus, a macronutrient equally vital for primary productivity and biodiversity richness, has also seen emissions from the land surface to the atmosphere rise, a product of farming releasing soil dust and plant particles and ash from biomass burning (natural and large-scale clearance).

Comparison of natural N fixation to anthropogenic inputs through the 20th Century. Source: UNEP (2007) Reactive Nitrogen in the Environment.

Comparison of natural N fixation to anthropogenic inputs through the 20th Century. Source: UNEP (2007) Reactive Nitrogen in the Environment.

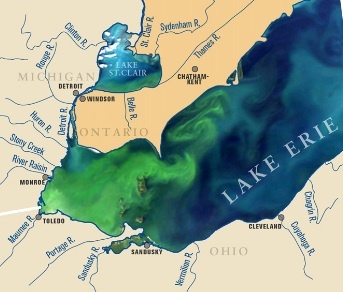
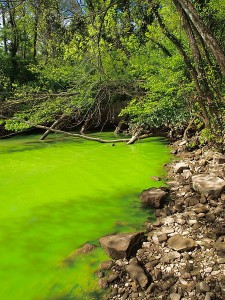
The threat from increased N and P moving across the land surface is well known; agricultural fertilisers flushing into rivers leading to eutrophication in some aquatic systems, for example. I had not fully appreciated the scale and potential implications of enhanced atmospheric emissions (and subsequent deposition on land) until more recently – and it seems there has been a lack of research in this area.

MODIS satellite image of Lake Erie on 3 September 2011 highlighting the algal bloom . Source: NOAA.

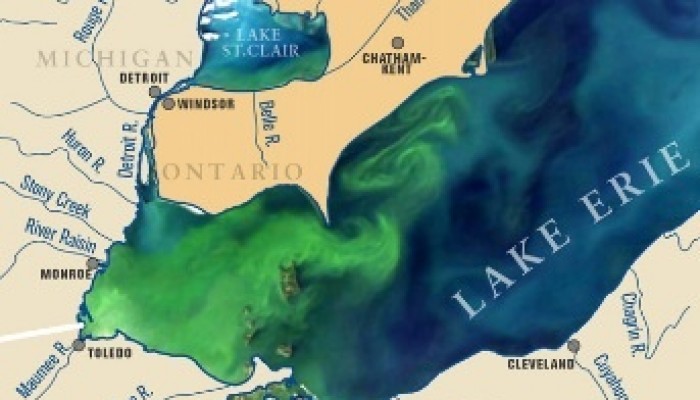
MODIS satellite image of Lake Erie on 3 September 2011 highlighting the extent of algal blooms. Source: NOAA.

Eutrophication on the Potomac River. Source: Alexandr Trubetsky, WikiCommons CC-BY-SA-3.0

Evidence of eutrophication on the Potomac River. Source: Alexandr Trubetsky, WikiCommons CC-BY-SA-3.0

I was surprised to learn while working on the LTLS project that, in the case of phosphorus, very few measurements are made worldwide of the fraction made up of large particles (>10 µm) that occurs as dry deposition, highlighted by some LTLS colleagues last year as being an important component to the global budget: Tipping et al. 2014. As a result, the potential adverse or positive effects of the rising atmospheric deposition on ecosystem health and functioning remain unclear.

So, what did Brahney and colleagues find? They compiled a dataset of N and P concentrations for over 700 upland, oligotrophic (having a low natural nutrient status) lakes primarily in Europe and North America, supplemented by one in India and a handful in South America. Strong, statistically significant relationships were identified between concentrations of N and P being deposited on a lake and the stoichiometry (the ratio of nutrients that dictates biochemical processes, in this case N:P) of its water column. This indicates that nutrient availability in lakes is more tightly linked to atmospheric supply than is typically realised.

The authors also conducted an atmospheric modelling analysis, simulating the transport and deposition of N and P at the global scale to reconstruct changes through time and identify the mechanisms involved. Their model results indicate N and P deposition worldwide is now 1.9 and 1.4 times greater than prior to the 20th Century, respectively, with greater N deposition in the northern hemisphere and P deposition in regions across Africa and South America that have experienced major burning events, presumably for clearance.

Tropical forest fire. Source: Wikicommons, Ramos Keith, public domain.

Tropical forest fire. Source: Wikicommons, Ramos Keith, public domain.

In short, they have found evidence that enhanced atmospheric deposition of N and P is changing the water chemistry of lakes worldwide. Legislation has led to N deposition in industrialised countries beginning to decline in the past couple of decades. Phosphorus, on the other hand, continues to follow an increasing trajectory and remains in the lake system for longer. Recall that they analysed upland, in many cases alpine, lakes located some distance from human settlement and unlikely to experience direct disturbance. Nevertheless, atmospheric cycling appears to be a mechanism enabling human activity to modify the nutrient dynamics in these lakes. Investigations at individual lakes has shown nutrient enrichment has myriad effects, some positive but mostly negative, on a lake’s productivity and species richness. In a worst case scenario, acute enrichment has led to toxic algal blooms and fish kills.

The author’s final remarks highlight that projected population growth, increased demand for food and more prevalent drought episodes may well lead to continued P emission and deposition; we really need to know more about what this might do to global aquatic ecosystems.

The coolest way to visualise how planets work

The coolest way to visualise how planets work

It’s not always easy visualising the complex processes which operate on planet Earth. Even more difficult, at least for me, is explaining them to others. That’s why I’m always on the look out for tools that might just help me with that and which I can share with others too. Enter the NASA Visualisation Explorer, and the Scientific Visualization Studio (SVS), which I came across recently.

The first of the two is a cool little app which can you get straight on your mobile device. You can keep up with all of NASA’s most recent findings and search for animations, visualisations and images of the Earth and Sun. I’ve unashamedly taken from the page intro here, but I think it does a great job of explaining what the site aims to do:

“The NASA Visualization Explorer the coolest way to get stories about NASA’s exploration of the Earth, sun, moon, planets and universe.”

Next up, the SVS: If you ask me, a great communication tool, packed with more images, animations and visualisations, which are created by the SVS in collaboration with researchers and scientists. You could literally spend hours exploring the content on the site. The best bit? All the visualisations (of which there are more than 5,500) are free to download!

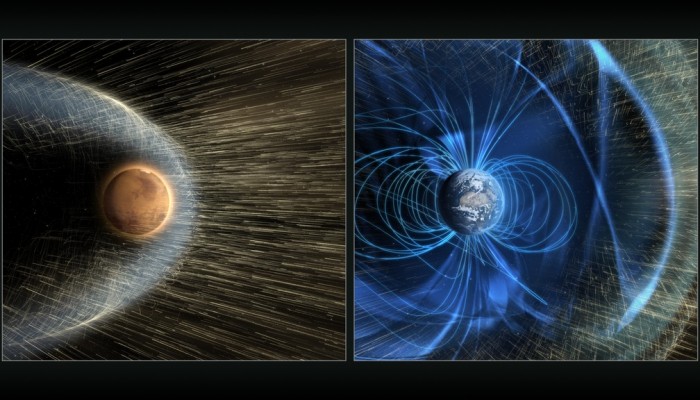
To showcase just one example of what you can look forward to on the site (just a warning, you could spend hours exploring the content!), I’ve downloaded one of my current favourites: a video showing solar wind hitting Mars’ magnetic field. The video, is part of a series of resources associated with the recent discoveries by the Mars Atmosphere and Volatile Evolution (MAVEN) mission about how Mars lost it’s atmosphere.

Click here to display content from svs.gsfc.nasa.gov

MAVEN has been able to determine that solar wind – a stream of particles, mainly protons and electrons, flowing from the sun’s atmosphere at a speed of about one million miles per hour – stripped the red planet of it’s atmosphere. The findings have huge implications about how crucial it is that the Earth has sustained its magnetic field throughout its lifetime -something which I’ve written about before (and is closely related to my PhD, so I was v. excited about these recent findings).

An Andy Warhol Moment for Liverpool’s Geomagnetism Group – dating the formation of the Earth’s Inner core

An Andy Warhol Moment for Liverpool’s Geomagnetism Group – dating the formation of the Earth’s Inner core

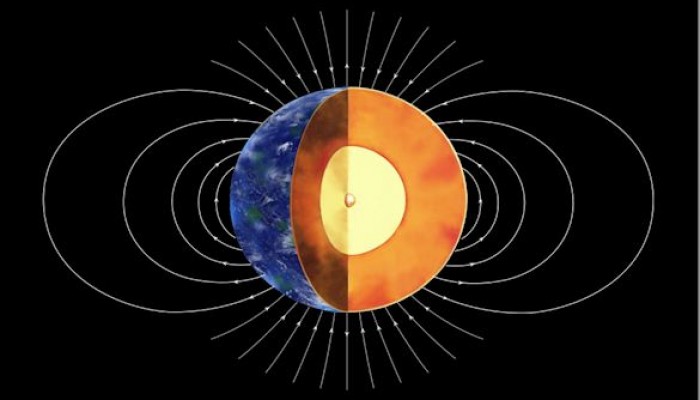
This week, my PhD supervisor, Andy Biggin, had a paper out in Nature. The findings of this new research point towards the Earth’s inner core being older than we’d previously thought. Recent estimates, suggest that the Earth’s solid inner core started forming between half a billion and one billion years ago. However, Andy’s (and co-workers) new measurements of ancient rocks as they cool from magma have indicated that it may actually have started forming more than half a billion years earlier.

I’m not going to go into the details of the findings, you can learn more about those from the paper itself and also from the press coverage (BBC news and an article in The Conversation by Andy himself). Instead, below you’ll find a blog post which Andy originally posted on the Liverpool Geomagnetism Group blog (I reproduced it here with his permission). I found it interesting because it explores (from a scientists’ perspective) the sometimes difficult relationship between research and media coverage. One way to inspire future generations of scientists is by getting new and exciting research in the public eye; something not always easy when researching the workings of the inner Earth – it just doesn’t have the mass appeal and wow factor of volcanoes, earthquakes and tsunamis! The new research has had plenty of media coverage, as Andy describes below, and it’s exciting, not only for palaeomagnetism, but also the broader public as it shed’s light on how the Earth formed and came to be as it is now.


Pop-artist Andy Warhol famously stated that: “In the future, everyone will be world-famous for 15 minutes”. I suspect yesterday may be the closest we will ever get to proving him right.

A paper on which I am lead-author claims that we have may have pinned down the point in Earth’s history when the inner core first started to freeze at the centre of the Earth to between 1 and 1.5 billion years ago.  I already thought this was big news so was a bit deflated when Nature decided not to run with the excellent picture (above) created by Kay Lancaster (cartographer at the University of Liverpool) on its cover or even feature it in its press release.

Nevertheless, our excellent press officer at Liverpool helped produce a great press release which saw a story featured on the popular Phys.org website from the outset and an article in one of Spain’s top newspapers El Pais.

Things were a bit slow-burning for a while – except in India and Finland. Then the break-though – a beautiful piece by Simon Redfern for BBC news online! I checked and it was even linked to the front page of BBC news (though you did have to scroll down a LONG way to get it…).

This was quickly followed up by a piece on the Daily Mail which our press officer tells me is the “most read online news site in the world”. A number of other things have followed including a post on one of my favourite blogs – IFLScience.

Then, just as I was packing up to go home, I received a phone call from the BBC World Service who wanted a short interview. I obliged in the evening and my nervous responses aired a few hours later. You can listen to the podcast here (it is the very last feature – “And finally…”). They refer before and after the interview to the finding as being that the magnetic field is much older than previously thought – incorrect in this specific case but relevant to another recent finding, albeit one that Liverpool people were not involved in making.

More informative is a piece I wrote for “The Conversation”. There has only been one comment at the time of writing – hopefully they will improve…

A summary from our press office indicates that there are 39 news outlets and counting featuring the story  and tweets still coming through every few minutes. The coverage extends over at least 11 countries ranging from USA to China,  Argentina to Pakistan so, while I can, I am claiming (brief) world fame for our research!

By Andy Biggin, Lecturer at the University of Liverpool

This article was originally posted in Geomagnetism.org, you can view the post here.