The severe flooding that has hit much of northern England during the last few weeks (and northeastern Scotland right now) has generated significant discussion and debate about why floods happen, how often they occur and what we can do about it. The fact is there’s no simple answer to any of these questions: the hydrometeorological cycle is a complex beast and our actions have altered it in myriad ways, from contributing to a warming climate, modifying flow pathways and building in less-than-ideal locations. I recently co-authored a piece at The Conversation that offers some wider context to these discussions.
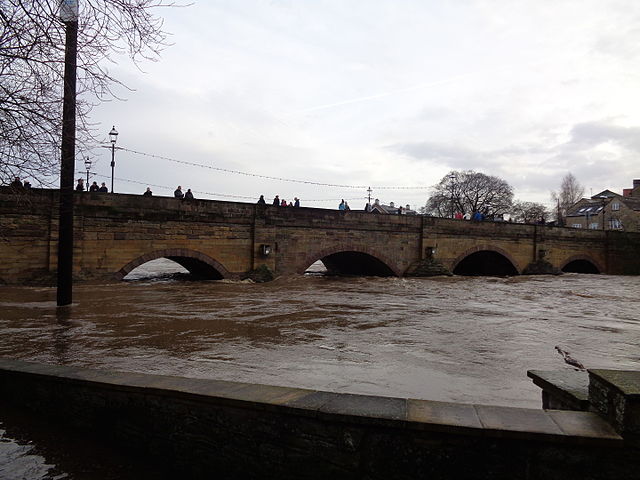
Wetherby Bridge, 26 December 2015. Photo by: MTaylor848 (WikiCommons).
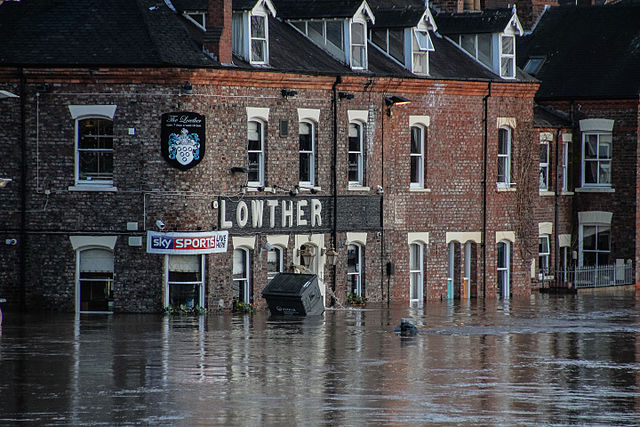
Flooding in York, 27 December 2015. Photo by: Richard Scott (WikiCommons).
While the physics dictating that a warmer atmosphere can hold more moisture is long established, attributing single weather events to climate change and detecting whether floods are becoming more frequent and/or severe floods here in the UK remains tricky business (e.g., Pall et al. (2011) Nature, Trenberth (2011) Wiley Interdisciplinary Reviews: Climate Change or Trenberth et al. (2015) Nature Climate Change, Watts et al. (2015) Progress in Physical Geography). One complicating factor that is widely accepted is that the short duration of existing hydrological records – typically a few decades or less for river gauging stations – means attempts to identify an anthropogenically-triggered signal from natural variability have produced ambiguous results.
This is where sediment sequences may be able to contribute some valuable data, as floods can leave behind an imprint that is sedimentologically different to the material that accumulates day-to-day on a lake bed or on a floodplain. The field of palaeohydrology has a long history but emphasis has really been placed on lake sediment sequences in the past few years. Two recent comprehensive reviews of the state of lacustrine palaeoflood research (Schillereff et al. (2014) Earth-Science Reviews and a book chapter from Gilli et al. (2012)) highlight much impressive work coming from the European Alps, Scandinavia, North America and indeed globally.
There are a number of crucial considerations: how certain can we be that a distinct layer of sediment was in fact deposited by a historical flood? Do all floods leave an imprint? If not, must an event reach a certain discharge for a detectable deposit to be preserved?
When I started my PhD investigating palaeoflood records from British lakes, I quickly discovered another significant barrier: the difficulty of distinguishing flood layers in lakes that accumulate homogeneous sediments, typically fine-grained, organic-rich material – in other words, squishy brown gloop. These sorts of lakes are common in the UK and globally prevalent, especially in temperate regions.
My ex-PhD supervisors and I published a paper in Geology this month (Schillereff et al. ‘Hydrological thresholds and basin control over paleoflood records in lakes‘) that successfully demonstrates a method to obtain palaeoflood records from such lakes (please note the paper is Open Access). Working at Brotherswater, a small lake in the eastern English Lake District, we were able to confirm the provenance of coarse-grained samples (i.e., they were deposited during high river flows), establish the hydrological threshold at which a sedimentary imprint is preserved (i.e., what discharge is required) and ultimately, we hope, provide a blueprint for acquiring palaeoflood records from these sorts of systems elsewhere in the world.
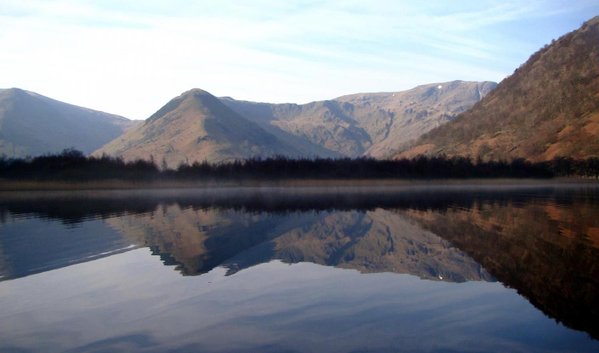
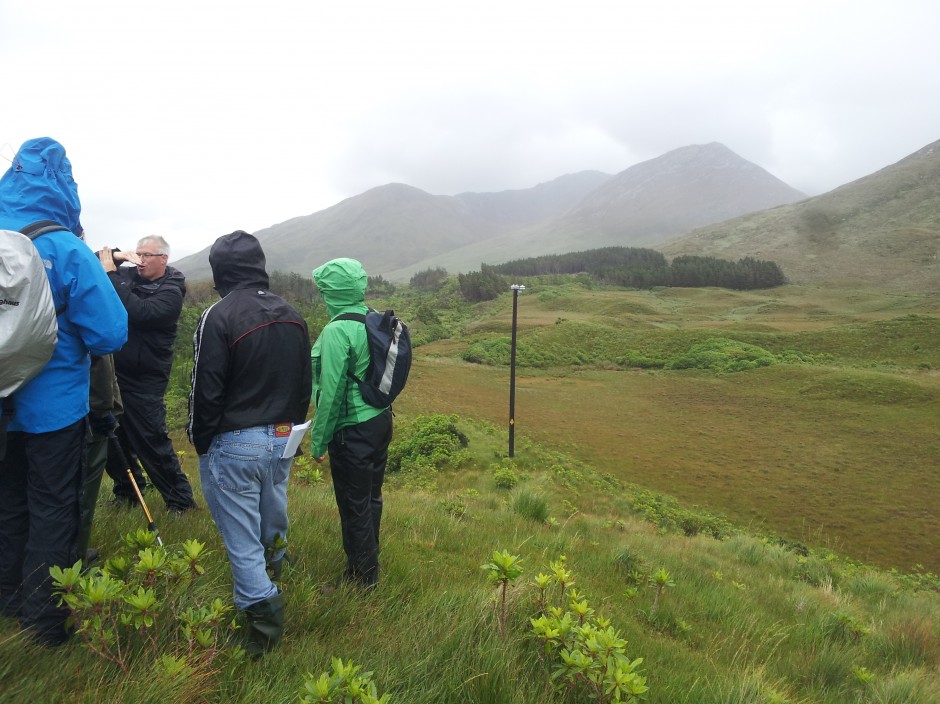
The view south across the catchment of Brotherswater. Photo by: D. Schillereff.
What did the work involve? We installed sediment traps (tubes with exchangeable containers at the bottom – see diagram) in the lake for 18 months enabling us to directly measure the calibre of particles delivered to the lake as incoming river discharge fluctuates through the year. We then looked at sediment cores from the same location; these were made up of material that had accumulated at the lake bed since ~1960 and some of these samples were characterised by very coarse material.

Schematic of the sediment traps installed in Brotherswater. Source: Schillereff, 2014.
Statistical analysis of these data indicated there were different groupings of particle sizes that we linked to separate hydrological processes. The coarsest group, or end member, appears in sporadic samples and we infer its appearance to be indicative of a major flood. Our dating of the sediment enables us to pinpoint the timing of each flood and comparing their occurrence with local river flow records has enabled us to establish the discharge threshold that will result in a sedimentary deposit being preserved.
The next image, Figure 3 in our paper, hopefully explains the processing. The left-hand triplet of graphs are the particle size distributions of all samples; the black line (furthest right) in the middle plot represents the coarse fraction. The middle (sediment traps) and right-hand (cores) pairs of graphs depict the contribution each end-member makes through time. The black bars periodically reach well over 50%; material of this calibre almost certainly must have been delivered during high discharges, so we can use its appearance as a palaeoflood signature.
End-member modelling of particle size data from sediment trap and core samples. See text for explanation. Site A is closer to the inflow, site B is in the lake centre. Source: Schillereff et al. (2016)
Having established more confidently the characteristics of palaeoflood laminations, we can begin to examine long sediment cores and count the frequency and calculate the magnitude of floods that have occurred during past centuries and ideally millennia. This work is progressing nicely and we plan to submit our findings from Brotherswater and other regional lakes that place the recent Cumbrian floods (2005, 2009, 2015) in a longer-term context for peer-review this year.
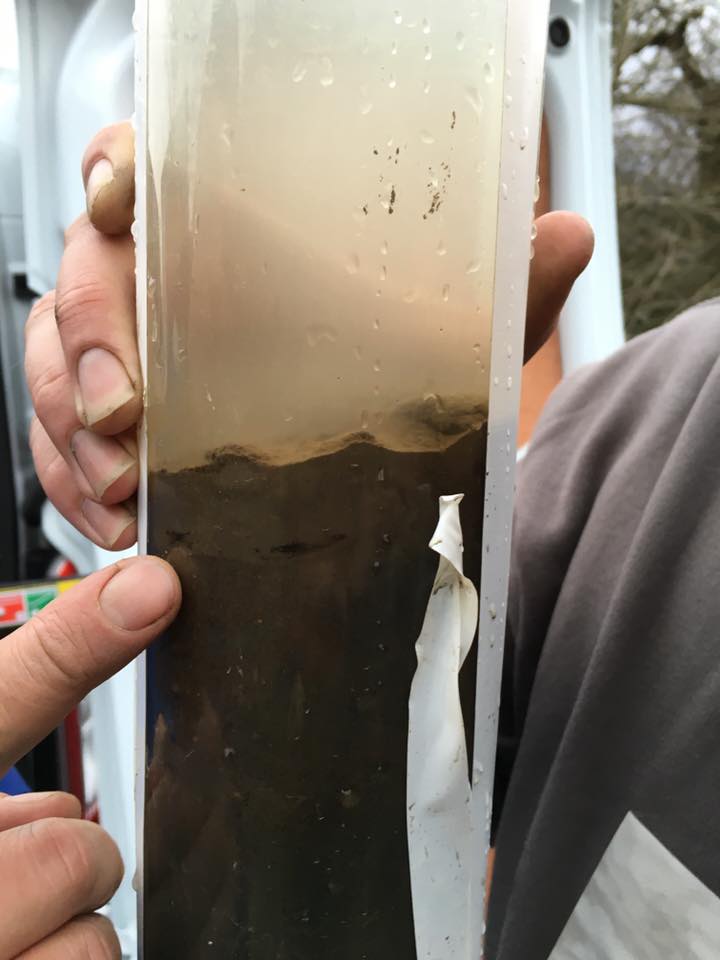
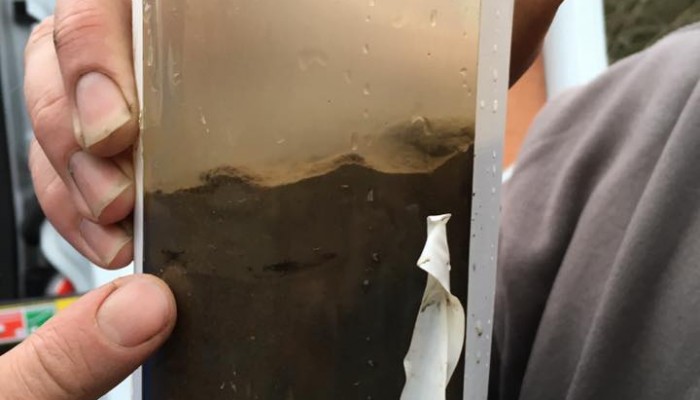
Sediment core extracted from Bassenthwaite Lake, Cumbria, on 7 January 2016. The light-coloured band at the surface most likely reflects material deposited by the severe flood triggered by Storm Desmond in early December. Photo courtesy of R. Chiverrell, University of Liverpool.