So it has been a while since I last blogged, attributed to various excuses – fieldwork, moving job, moving house – but moving forwards I intend to spend more time discussing the myriad aspects of geoscience I find fascinating. One good example is a recent paper from Janice Brahney (University of British Columbia) and colleagues in Global Biogeochemical Cycles entitled ‘Is atmospheric phosphorus pollution altering global alpine Lake stoichiometry?’, which builds on their recent examining the influences rising atmospheric emissions of nitrogen (N) and phosphorus (P), driven by human activity, are having on lake ecosystems by taking a global look.
This is a topic I’ve taken real interest in over the last couple of years as it merges research on lakes (I worked on lake sediment records of environmental change for my PhD) with investigating biogeochemical cycling of macronutrients, which was the focus of my recent Postdoc on the LTLS Macronutrient Cycles project.
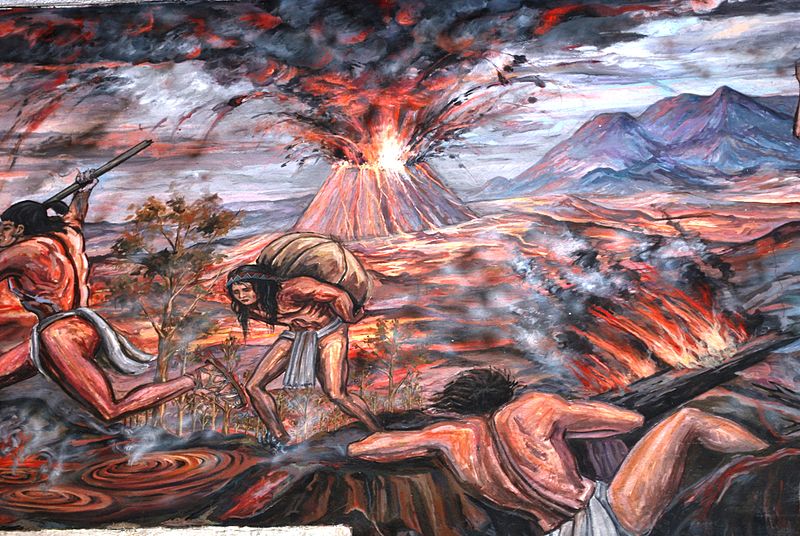
Anthropogenic changes to the nitrogen and phosphorus budgets have predominantly occurred through the 20th Century: the supply of reactive N (the form that supports plant growth) has exploded since the 1950s, especially in the northern hemisphere, led by industrial expansion and use of fertilisers in agriculture (Haber-Bosch process). Phosphorus, a macronutrient equally vital for primary productivity and biodiversity richness, has also seen emissions from the land surface to the atmosphere rise, a product of farming releasing soil dust and plant particles and ash from biomass burning (natural and large-scale clearance).
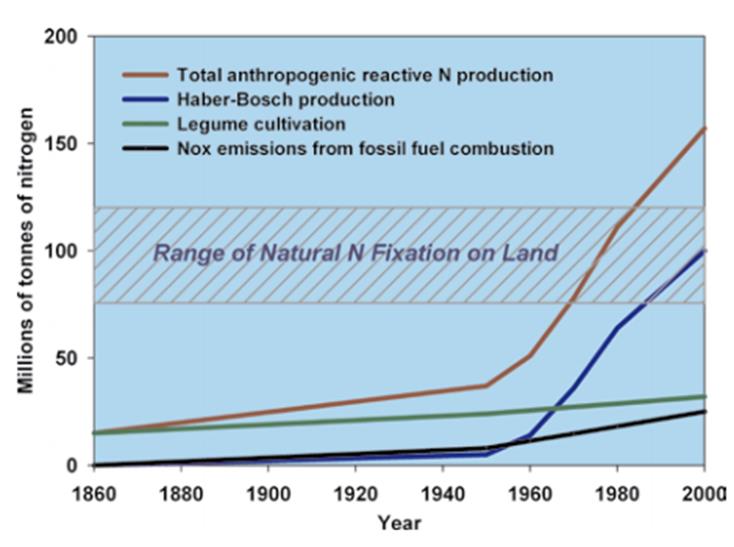
Comparison of natural N fixation to anthropogenic inputs through the 20th Century. Source: UNEP (2007) Reactive Nitrogen in the Environment.
The threat from increased N and P moving across the land surface is well known; agricultural fertilisers flushing into rivers leading to eutrophication in some aquatic systems, for example. I had not fully appreciated the scale and potential implications of enhanced atmospheric emissions (and subsequent deposition on land) until more recently – and it seems there has been a lack of research in this area.
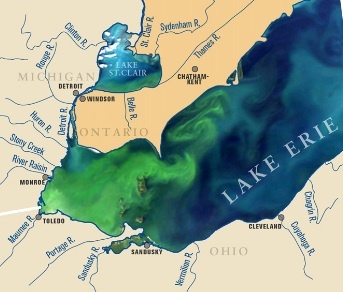
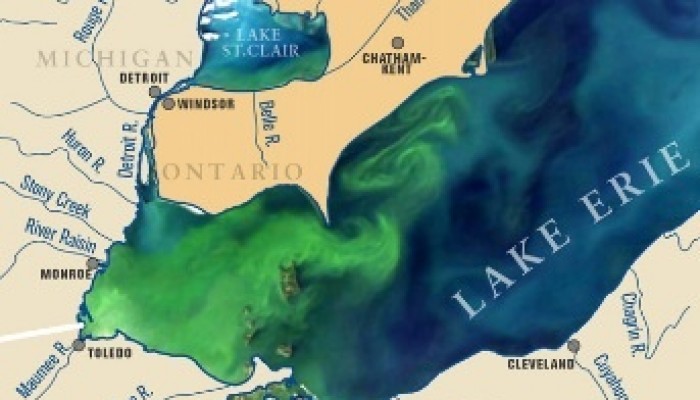
MODIS satellite image of Lake Erie on 3 September 2011 highlighting the extent of algal blooms. Source: NOAA.
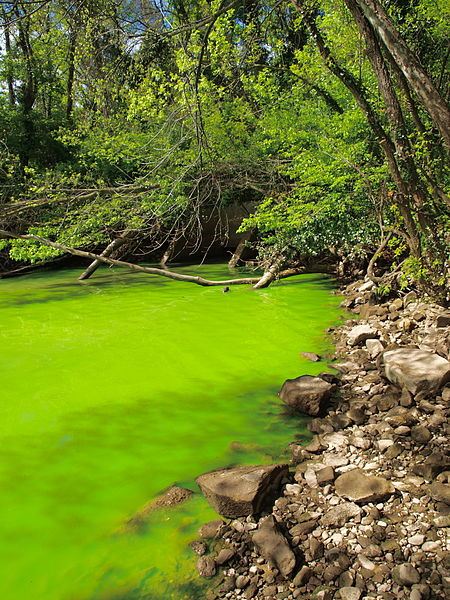
Evidence of eutrophication on the Potomac River. Source: Alexandr Trubetsky, WikiCommons CC-BY-SA-3.0
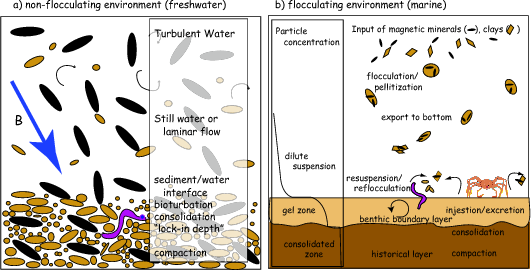
I was surprised to learn while working on the LTLS project that, in the case of phosphorus, very few measurements are made worldwide of the fraction made up of large particles (>10 µm) that occurs as dry deposition, highlighted by some LTLS colleagues last year as being an important component to the global budget: Tipping et al. 2014. As a result, the potential adverse or positive effects of the rising atmospheric deposition on ecosystem health and functioning remain unclear.
So, what did Brahney and colleagues find? They compiled a dataset of N and P concentrations for over 700 upland, oligotrophic (having a low natural nutrient status) lakes primarily in Europe and North America, supplemented by one in India and a handful in South America. Strong, statistically significant relationships were identified between concentrations of N and P being deposited on a lake and the stoichiometry (the ratio of nutrients that dictates biochemical processes, in this case N:P) of its water column. This indicates that nutrient availability in lakes is more tightly linked to atmospheric supply than is typically realised.
The authors also conducted an atmospheric modelling analysis, simulating the transport and deposition of N and P at the global scale to reconstruct changes through time and identify the mechanisms involved. Their model results indicate N and P deposition worldwide is now 1.9 and 1.4 times greater than prior to the 20th Century, respectively, with greater N deposition in the northern hemisphere and P deposition in regions across Africa and South America that have experienced major burning events, presumably for clearance.
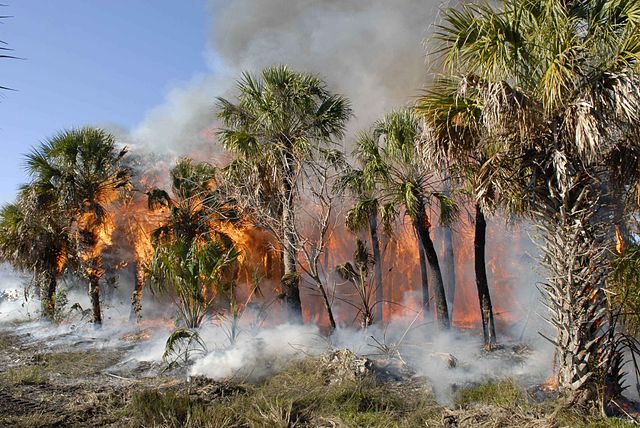
Tropical forest fire. Source: Wikicommons, Ramos Keith, public domain.
In short, they have found evidence that enhanced atmospheric deposition of N and P is changing the water chemistry of lakes worldwide. Legislation has led to N deposition in industrialised countries beginning to decline in the past couple of decades. Phosphorus, on the other hand, continues to follow an increasing trajectory and remains in the lake system for longer. Recall that they analysed upland, in many cases alpine, lakes located some distance from human settlement and unlikely to experience direct disturbance. Nevertheless, atmospheric cycling appears to be a mechanism enabling human activity to modify the nutrient dynamics in these lakes. Investigations at individual lakes has shown nutrient enrichment has myriad effects, some positive but mostly negative, on a lake’s productivity and species richness. In a worst case scenario, acute enrichment has led to toxic algal blooms and fish kills.
The author’s final remarks highlight that projected population growth, increased demand for food and more prevalent drought episodes may well lead to continued P emission and deposition; we really need to know more about what this might do to global aquatic ecosystems.