EGU Blogs

Uncategorized

Yet another way we are altering Earth’s natural functioning

Yet another way we are altering Earth’s natural functioning

So it has been a while since I last blogged, attributed to various excuses – fieldwork, moving job, moving house – but moving forwards I intend to spend more time discussing the myriad aspects of geoscience I find fascinating. One good example is a recent paper from Janice Brahney (University of British Columbia) and colleagues in Global Biogeochemical Cycles entitled ‘Is atmospheric phosphorus pollution altering global alpine Lake stoichiometry?’, which builds on their recent examining the influences rising atmospheric emissions of nitrogen (N) and phosphorus (P), driven by human activity, are having on lake ecosystems by taking a global look.

This is a topic I’ve taken real interest in over the last couple of years as it merges research on lakes (I worked on lake sediment records of environmental change for my PhD) with investigating biogeochemical cycling of macronutrients, which was the focus of my recent Postdoc on the LTLS Macronutrient Cycles project.

Anthropogenic changes to the nitrogen and phosphorus budgets have predominantly occurred through the 20th Century: the supply of reactive N (the form that supports plant growth) has exploded since the 1950s, especially in the northern hemisphere, led by industrial expansion and use of fertilisers in agriculture (Haber-Bosch process). Phosphorus, a macronutrient equally vital for primary productivity and biodiversity richness, has also seen emissions from the land surface to the atmosphere rise, a product of farming releasing soil dust and plant particles and ash from biomass burning (natural and large-scale clearance).
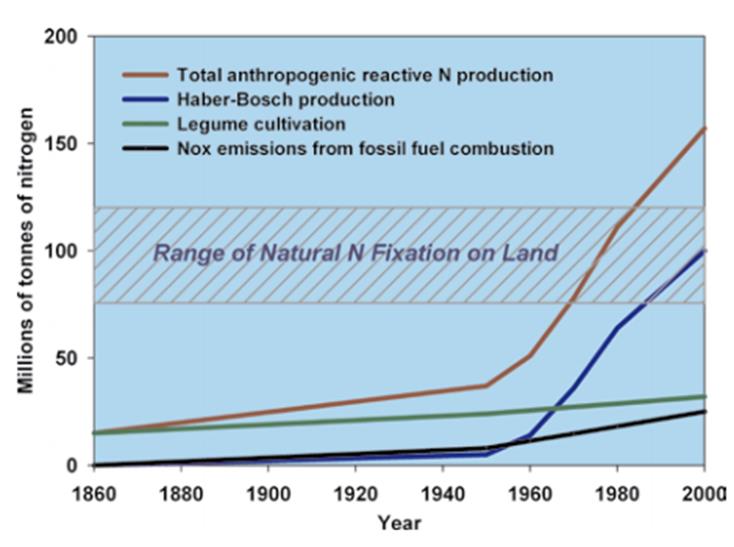
Comparison of natural N fixation to anthropogenic inputs through the 20th Century. Source: UNEP (2007) Reactive Nitrogen in the Environment.

Comparison of natural N fixation to anthropogenic inputs through the 20th Century. Source: UNEP (2007) Reactive Nitrogen in the Environment.

The threat from increased N and P moving across the land surface is well known; agricultural fertilisers flushing into rivers leading to eutrophication in some aquatic systems, for example. I had not fully appreciated the scale and potential implications of enhanced atmospheric emissions (and subsequent deposition on land) until more recently – and it seems there has been a lack of research in this area.
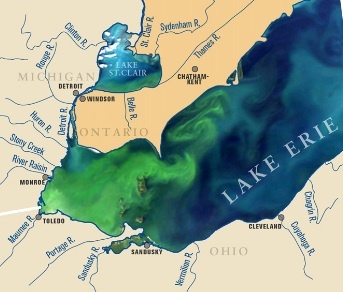
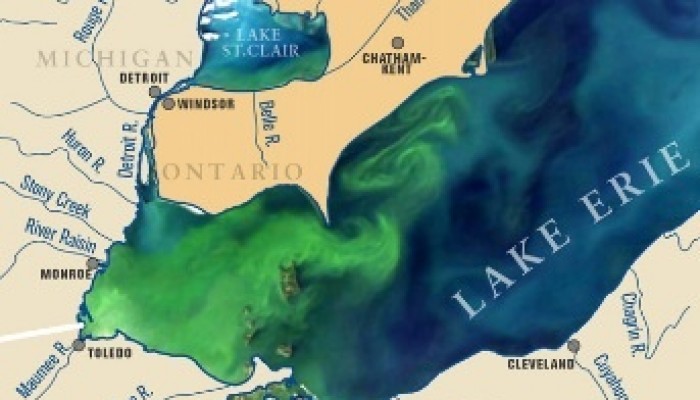
MODIS satellite image of Lake Erie on 3 September 2011 highlighting the algal bloom . Source: NOAA.

MODIS satellite image of Lake Erie on 3 September 2011 highlighting the extent of algal blooms. Source: NOAA.
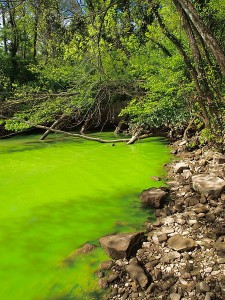
Eutrophication on the Potomac River. Source: Alexandr Trubetsky, WikiCommons CC-BY-SA-3.0

Evidence of eutrophication on the Potomac River. Source: Alexandr Trubetsky, WikiCommons CC-BY-SA-3.0

I was surprised to learn while working on the LTLS project that, in the case of phosphorus, very few measurements are made worldwide of the fraction made up of large particles (>10 µm) that occurs as dry deposition, highlighted by some LTLS colleagues last year as being an important component to the global budget: Tipping et al. 2014. As a result, the potential adverse or positive effects of the rising atmospheric deposition on ecosystem health and functioning remain unclear.

So, what did Brahney and colleagues find? They compiled a dataset of N and P concentrations for over 700 upland, oligotrophic (having a low natural nutrient status) lakes primarily in Europe and North America, supplemented by one in India and a handful in South America. Strong, statistically significant relationships were identified between concentrations of N and P being deposited on a lake and the stoichiometry (the ratio of nutrients that dictates biochemical processes, in this case N:P) of its water column. This indicates that nutrient availability in lakes is more tightly linked to atmospheric supply than is typically realised.

The authors also conducted an atmospheric modelling analysis, simulating the transport and deposition of N and P at the global scale to reconstruct changes through time and identify the mechanisms involved. Their model results indicate N and P deposition worldwide is now 1.9 and 1.4 times greater than prior to the 20th Century, respectively, with greater N deposition in the northern hemisphere and P deposition in regions across Africa and South America that have experienced major burning events, presumably for clearance.

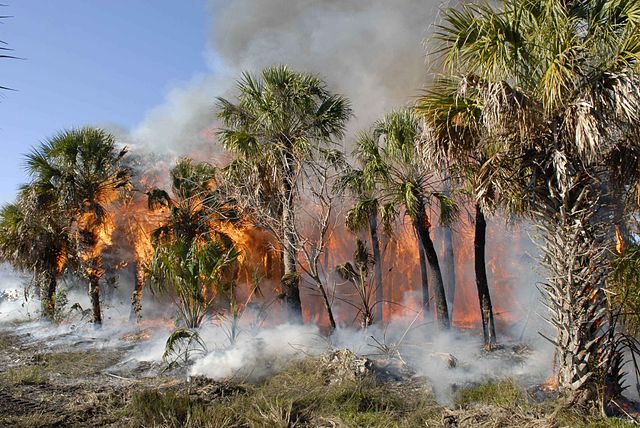
Tropical forest fire. Source: Wikicommons, Ramos Keith, public domain.

Tropical forest fire. Source: Wikicommons, Ramos Keith, public domain.

In short, they have found evidence that enhanced atmospheric deposition of N and P is changing the water chemistry of lakes worldwide. Legislation has led to N deposition in industrialised countries beginning to decline in the past couple of decades. Phosphorus, on the other hand, continues to follow an increasing trajectory and remains in the lake system for longer. Recall that they analysed upland, in many cases alpine, lakes located some distance from human settlement and unlikely to experience direct disturbance. Nevertheless, atmospheric cycling appears to be a mechanism enabling human activity to modify the nutrient dynamics in these lakes. Investigations at individual lakes has shown nutrient enrichment has myriad effects, some positive but mostly negative, on a lake’s productivity and species richness. In a worst case scenario, acute enrichment has led to toxic algal blooms and fish kills.

The author’s final remarks highlight that projected population growth, increased demand for food and more prevalent drought episodes may well lead to continued P emission and deposition; we really need to know more about what this might do to global aquatic ecosystems.

A new tool for the interpretation of palaeomagnetic data

A new tool for the interpretation of palaeomagnetic data

As part of my PhD research, I spent quite a lot of time at the Fort Hoofddijk (informally known as The Fort) – the palaeomagnetic laboratory of the University of Utrecht (in the Netherlands). For a little insight into what carrying research out in a 19th Century bunker, housed within the grounds of the botanical gardens of the University of Utrecht is like, take a look at this blog post that I wrote a while back.

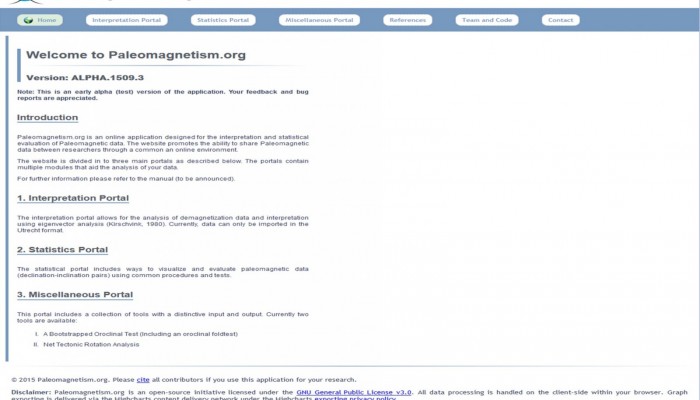
I digress, The Fort is a pioneer when it comes to palaeomagnetism, not only in develoiping new experimental methodology, but also in the building of novel equipment (which I go into a little bit in the post I referenced above) and in creating new tool for the analysis of data. They’ve recently released a new, totally online platform, created by their MSc student, Mathijs Koymans, for the interpretation of palaeomagentic data. Better still, “the website promotes the ability to share paleomagnetic data between researchers through a common an online environment,” say the authors. 

The application has three portals:

    1. The interpretation portal allows for the analysis of demagnetization data and interpretation using eigenvector analysis (Kirschvink, 1980). Currently, data can only be imported in the Utrecht format.
    2. The statistical portal includes ways to visualize and evaluate paleomagnetic data (declination-inclination pairs) using common procedures and tests.
    3. A miscellaneous portal which currently allows for a Bootstrapped Oroclinal Test (including an oroclinal foldtest), as well as net tectonic rotation analysis.

I’ve not used the tool yet, but it all seems straight forward: demagnetisation data can be added to the application by clicking the add demagnetization data button below. Once new data has been added, the data can be visualised and interpreted in the interpretation module.One thing to keep in mind is that for time being, data has to be entered in the ‘Utrecht’ format. It’s not difficult to convert your data (there is a handy link to what this involves on the site itself), I did it a number of times throughout my PhD. Some information which will be useful to have to hand when uploading your data is some sample parameters such as: name, step, dec, inc (x, y, z) and the authors recommend adding core and bedding orientations for rotation between specimen/geographic/tectonic coordinates.

The application is still in its infancy and the creators highlight it is a test version of the application, they welcome feedback and bug reports to continue to improve the website. If you have used it, or plan to in the near future, leave a little comment of how you found it, I’d love to hear!

Apologise for the unusual technical nature of this post – I’ll try and find time to explain the science some of the concepts I touch on here for those who might not be so familiar with the field.


Rocks of the Earth – EGU 2014

Credit: EGU2014

Credit: EGU2014

For the first time in 2014 the EGU General Assembly had a theme: The Face of the Earth. A number of special displays and talks were arranged to celebrate the first themed meeting.

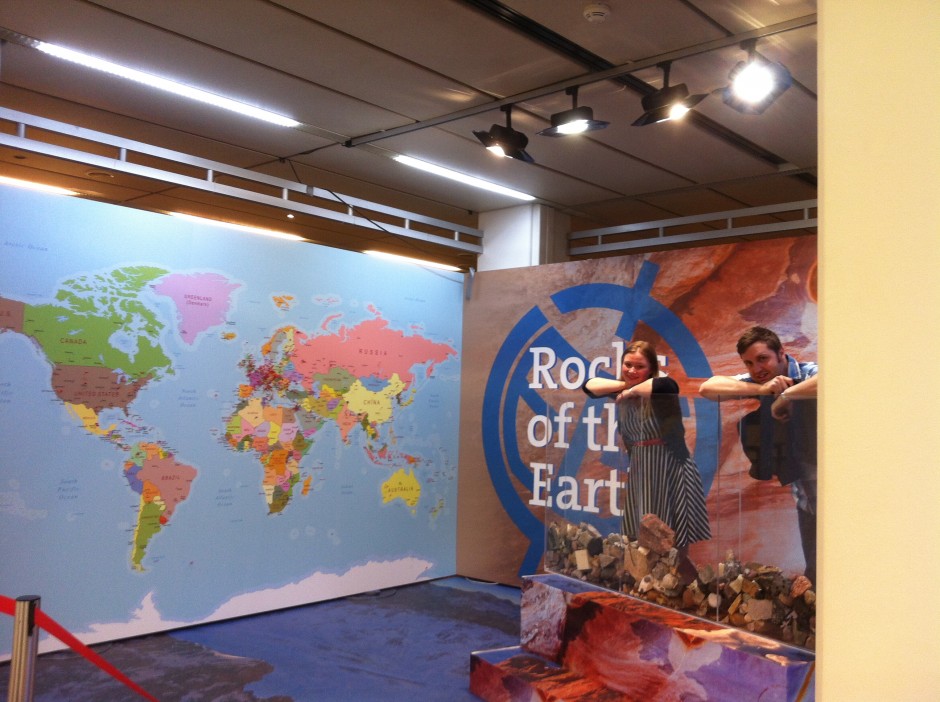
Our very own Dan was heavily involved with one aspect of Face of the Earth; along with some colleagues, he manned the Rocks of the Earth stand at the conference center foyer.

No doubt a number of you donated rocks to be displayed throughout the Assembly and you may want to know a little more about the fate of your rocks. In this video, released by EGU, Dan explains the idea behind Rocks of the Earth and what happened to the rocks after the Assembly finished.


Credit: Laura Roberts. In this photo, Dan Schillereff and Jennifer Clear.

Credit: Laura Roberts.
In this photo, Dan Schillereff and Jennifer Clear.

EGU DIARIES: Days 4 & 5 (1st & 2nd April).

egu_logo_ga2014The last two days of the conference were packed with geomagnetism related sessions. I had to leave my blogging and Earth Scientist self behind and fully embrace the wide range of talks and posters directly relevant and important to my own research. I’ve decided to merge my last two diary entries; whilst a lot of the science was very interesting to myself, I appreciate that reading about the mathematical theory of the geomagnetic field doesn’t offer the light relief Dan and I seek to provide in the content of this blog! This post is packed with sediments, some thoughts on presenting my own research and volcanoes!

Sediments as recorders of the Earth’s Magnetic Field

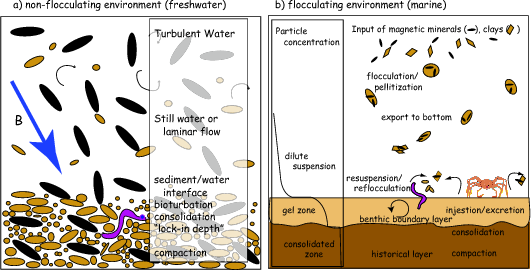
Thursday was dominated by the session I was presenting in, EMRP3.2: Multi-faceted Palaeomagnetism and Rock Magnetism: A Tribute to Reidar Løvlie. The early morning oral sessions focused on how we can better understand how sediments record the signature of the magnetic field, which was the area of expertise of the late Løvlie. The mechanism by which the Earth’s magnetic field is recorded in sediments is called Detrial Remenant Magentisation (DRM for short): it results from the alignment of magnetic minerals (as they fall through the water column of a lake or marine environment), in the direction of geomagnetic field present at the time. The magnetisation is not fully acquired until the sediment has been compacted and consolidated. Subsequent disturbance of the sediment by bioturbation or realignment of magnetic particles in the pore space, can give rise to a post-depositional remanent magnetisation (PDRM). The oral presentations highlighted how critical it is to improve our understanding of factors such as having a good geochronological handle on the ages of the sediments and inclination shallowing to fully understand the process by which sediments record magnetisation.

How a DRM is acquired in sediments.  Source: http://magician.ucsd.edu/essentials/WebBookse40.html

How a DRM is acquired in sediments.
Source: http://magician.ucsd.edu/essentials/WebBookse40.html

Presenting my own research

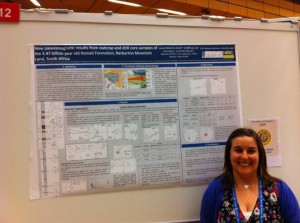
I was surprisingly nervous when it came to presenting my own research during the poster session. There were a lot of experts in the field at the conference and I was feeling the pressure of exhibiting my research accurately and in detail. It helped that there were a few familiar faces that came to lend support and people who came to talk to me seemed genuinely interested and keen to learn more. I had a few discussions with people who challenged my way of thinking, but that was a hugely positive thing. It made me look at my work in a new light. Every scientist will tell you, you get so close that it is easy to loose perspective and sight of what the key questions are and how you might improve your own work, or that there may be a new avenue or direction ripe for exploration! Despite my initial nerves, I thought the session went well. I felt I communicated the key points I was trying to make in the poster to those whom I spoke to and I got some valuable suggestions of ways I could improve my work. Overall, a success!!!

Thanks to @iamhazelgibson for the photo :)!

Thanks to @iamhazelgibson for the photo :)!

A multidisciplinary approach

Rocks aren’t the only reliable recorders of the ancient signature of the Earth’s magnetic field. It turns out that archaeological materials that have been fired (say clay pots, building blocks used in the construction of ancient palaces, etc…) are excellent materials that we can use to study Earth’s magnetic field. My office mate and friend, Megan Thomas, explains the process involved in this excellent post.

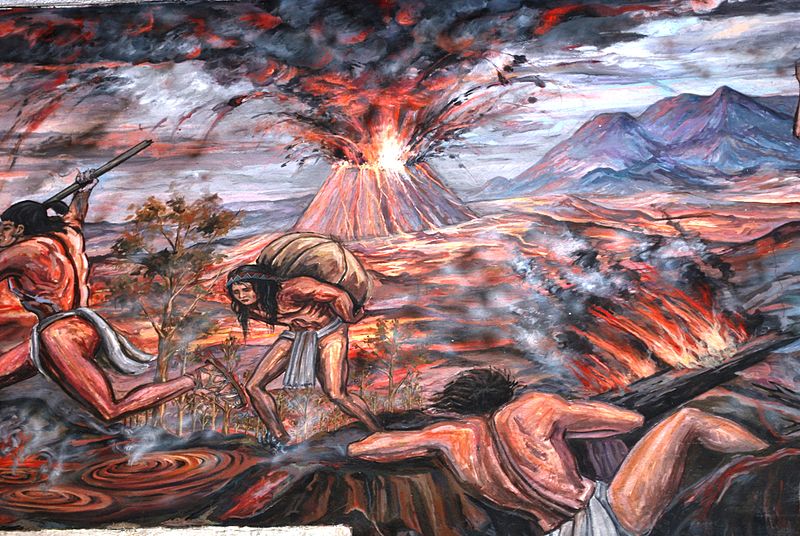
Section of mural work on the Government Palace in Tlalpan depicting the eruption of the Xitle volcano. Source: WikiCommons. Author: Alejandro Linares Garcia

Section of mural work on the Government Palace in Tlalpan depicting the eruption of the Xitle volcano.
Source: WikiCommons. Author: Alejandro Linares Garcia

Much of the last day of the conference was taken up by sessions that covered archaeomagnetism and how it can be used not only to understand the geomagnetic field, but also resolve geological conundrums. For example, archaeomagentism was used to date the timing of the eruption of the Xitle Volcano in Mexico. Is Cuicuilco the Pompeii of Mesoamerica? Is the downfall of the civilisation at the ancient settlement a direct result of the eruption of Xitle Volcano? Radiocabon dating of wood fragments at the base of the lava flows suggest that the eruption is younger than the age at which the city is thought to have been abandoned. New results for the strength of the magnetic field (the field intensity), as obtained from the lava flows that burry the city; suggest that the lava flows are older than the published radio carbon dates. This conclusion results from comparison of the intensity results from the lava flows to the field models available. It turns out, Cuicuilco is the Pompeii of Mexico! (If you want to read about this research in more detail, take a look at Alva, EPS, 57, 839-853, 2005 for a review and the EGU 2014 conference abstract).