Happy New Year to you all!
We’ve had a long Christmas break at Geology Jenga, but we are back! For 2014 we’ve got some really interesting 10 minute interviews lined up, as well as the continuation of the ‘Making the most of your PhD’ series and musings on all the things that interest Dan & I. So without further ado, let’s get started!
The past few weeks and months have seen some exciting newsworthy stories regarding the Earth’s magnetic field. I thought I’d highlight a few of them for our first post of the New Year.
The Aurora that never was.
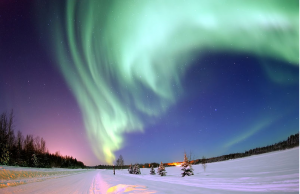
Credit: Wikimedia Commons, user: United States Air Force, This image or file is a work of a U.S. Air Force Airman or employee, taken or made as part of that person’s official duties. As a work of the U.S. federal government, the image or file is in the public domain.
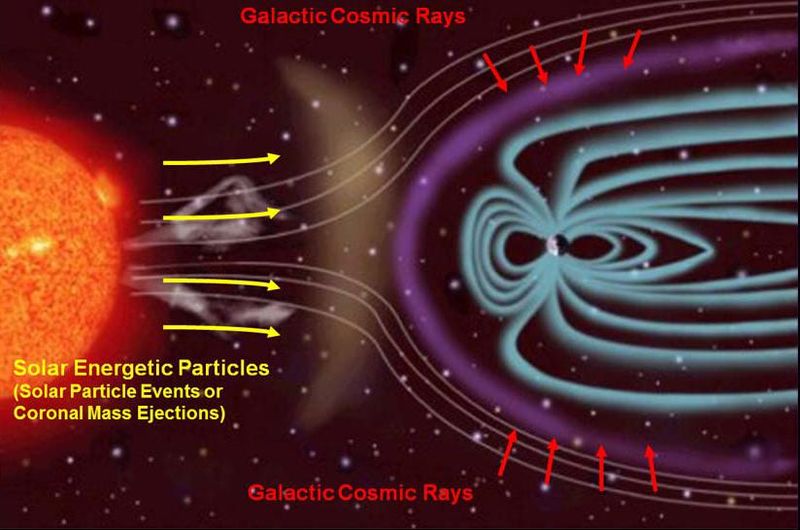
On 7th January, there was a large solar flare with an associated fast traveling Coronal Mass Ejection (CME), which was headed straight for the Earth, and was expected to hit our planet by the 9th of January. Space weather scientists, the media and people across the UK and Europe were glued to the night skies in hopes of seeing aurora borealis at abnormally southerly latitudes. Perhaps the excitement surrounding the potential to observe these mysterious phenomena was fueled, at least in the UK, by the timely airing of the first episode of the new series of Star Gazing Live, in which the team (made up of Prof. Brian Cox and comedian Dara O’Brien) took on the challenge to capture the northern lights.
Space weather has featured heavily in the UK media in the run up to the Christmas, as the UK government pledged a £4.6 million investment in the forecast of space weather. From early this year, the Met Office will forecast, deliver alerts and warnings to key sectors that might be adversely affected by solar flares and CMEs.
Despite the hype, the skies did not deliver. A great blog post by Dr Gemma Kelly, at the geomagnetism team of the British Geological Survey, explains the reasons behind why the Northern lights didn’t quite happen!
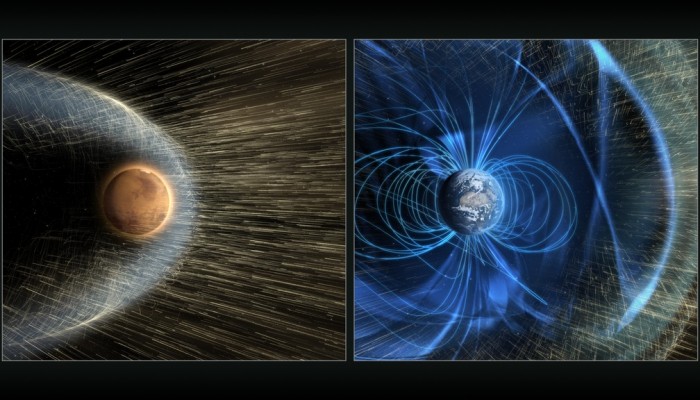
For more information on solar flares, CMEs and why they are important: have a look at my guest blog post for GeoSphere on the Earth’s protective shield and also the information pages of the British Geological Survey.
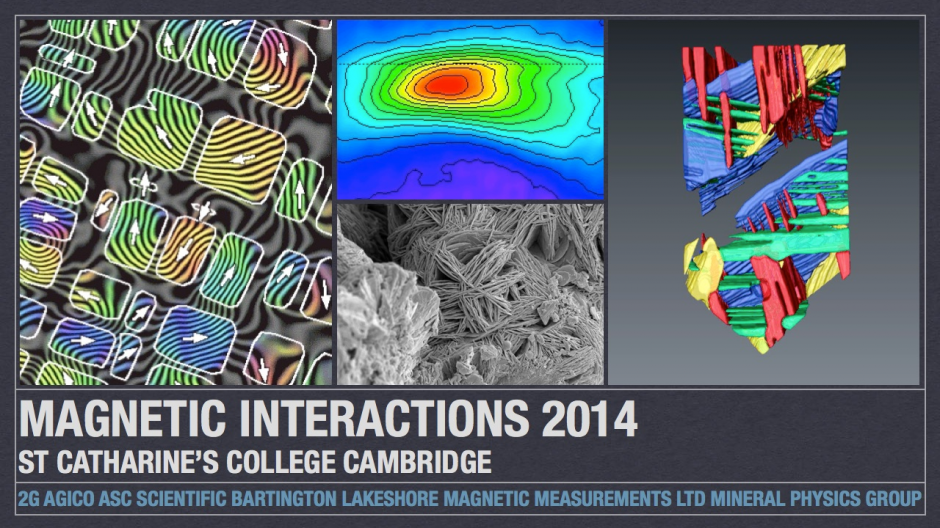
Magnetic Interactions 2014
For two days last week, I was at Cambridge University at the UK conference for the geomagnetism community. This year there was also a strong international presence. I would usually write a blog post on the highlights of the research that was
Logo courtesy of Richard Harrison.
being showcased at the conference; however, the meeting organisers beat me to it! Read about the science behind fundamental, applied rock and mineral magnetism, as well as, how an ancient voyage by naturalist Alexander von Humboldt might help us understand the geomagnetic field prior to the 1800s in this blog post by Dr. Richard Harrison, of Cambridge University.
It’s been a long time coming: SWARM!
After a long time waiting, the SWARM mission was finally launched on the 22nd November, 2013. A very exciting time for geomagnetist across the globe, as well as the European Space Agency
The SWARM mission is a European Space Agency mission to study the intensity (strength), direction and changes in the Earth’s magnetic field using high precision and resolution measurements collected by instruments aboard three identical satellites. The three satellites will collect data from all the sources of the Earth’s magnetic signal: core, mantle, crust, oceans, ionosphere and the magnetosphere. Two satellites will fly at lower latitudes, whilst the third will fly at a higher altitude to measure all the vectors of the magnetic field and to reduce the uncertainty associated with not having high quality spatial and temporal data. The data set will be used in models to better understand the Earth’s magnetic behaviour, including how it may be changing over time. It will assist in deciphering processes such as weakening magnetic shield, space weather and radiation hazards.
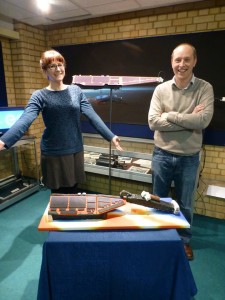
Photo courtesy of Victoria Ridley, who also baked this impressive SWARM cake!
For a great blog covering the build-up to the mission launch, impressive launch videos and cake, head over to the ESA mission blog. If you are interested in more details about the satellites, the mission aims and all sorts of other details, follow the links in the ESA blog too.