As part of my PhD research, I spent quite a lot of time at the Fort Hoofddijk (informally known as The Fort) – the palaeomagnetic laboratory of the University of Utrecht (in the Netherlands). For a little insight into what carrying research out in a 19th Century bunker, housed within the grounds of the botanical gardens of the University of Utrecht is like, take a look at this blog post that I wrote a while back.
I digress, The Fort is a pioneer when it comes to palaeomagnetism, not only in develoiping new experimental methodology, but also in the building of novel equipment (which I go into a little bit in the post I referenced above) and in creating new tool for the analysis of data. They’ve recently released a new, totally online platform, created by their MSc student, Mathijs Koymans, for the interpretation of palaeomagentic data. Better still, “the website promotes the ability to share paleomagnetic data between researchers through a common an online environment,” say the authors.
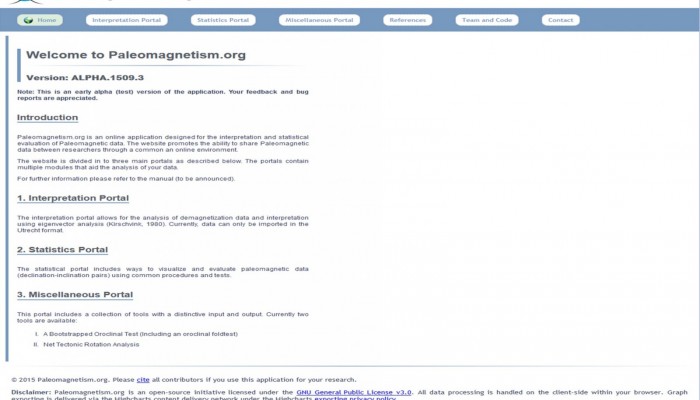
The application has three portals:
- The interpretation portal allows for the analysis of demagnetization data and interpretation using eigenvector analysis (Kirschvink, 1980). Currently, data can only be imported in the Utrecht format.
- The statistical portal includes ways to visualize and evaluate paleomagnetic data (declination-inclination pairs) using common procedures and tests.
- A miscellaneous portal which currently allows for a Bootstrapped Oroclinal Test (including an oroclinal foldtest), as well as net tectonic rotation analysis.
I’ve not used the tool yet, but it all seems straight forward: demagnetisation data can be added to the application by clicking the add demagnetization data button below. Once new data has been added, the data can be visualised and interpreted in the interpretation module.One thing to keep in mind is that for time being, data has to be entered in the ‘Utrecht’ format. It’s not difficult to convert your data (there is a handy link to what this involves on the site itself), I did it a number of times throughout my PhD. Some information which will be useful to have to hand when uploading your data is some sample parameters such as: name, step, dec, inc (x, y, z) and the authors recommend adding core and bedding orientations for rotation between specimen/geographic/tectonic coordinates.
The application is still in its infancy and the creators highlight it is a test version of the application, they welcome feedback and bug reports to continue to improve the website. If you have used it, or plan to in the near future, leave a little comment of how you found it, I’d love to hear!
Apologise for the unusual technical nature of this post – I’ll try and find time to explain the science some of the concepts I touch on here for those who might not be so familiar with the field.
