Until the turn of the 20th century, science was an activity practiced by amateur naturalists and philosophers with enough money and time on their hands to devote their lives to the pursuit of knowledge and the understanding of the natural world.
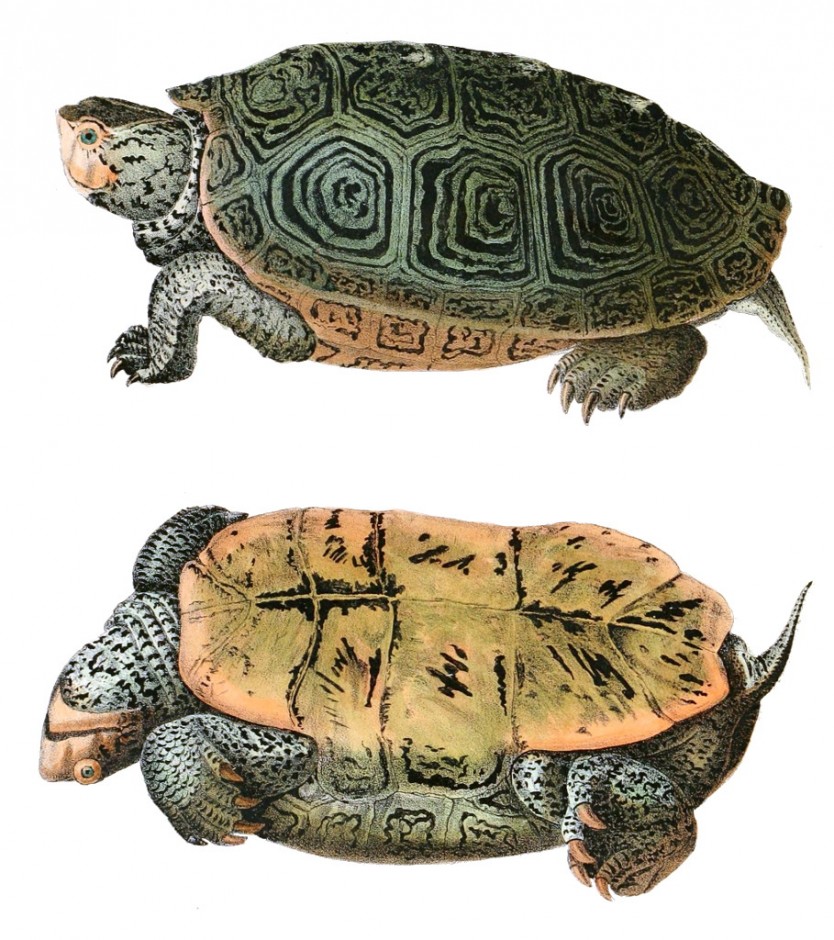
Hand-colored lithograph of Malaclemys terrapin, in John Edwards Holbrook’s North American herpetology. Source – Wikimedia Commons.
Today, scientific research is an industry of its own, carried out by highly trained and specialised professionals in academic institutions and research laboratories. From the outside, the world of science can sometimes seem like a mysterious one. A world that conveys wonder yet can feel impenetrable and somewhat detached from the reality of our daily lives.
But science is not that far removed from us, and anyone with an interest in anything from astrophysics to ecology and climate change can get involved and become a citizen scientist.
Citizen science is the engagement of amateur or nonprofessional scientists in scientific research, either through observations in nature, data analysis, or loaning of tools and resources such as computer power. Though the concept has picked up in recent years, citizen science is nothing new: Charles Darwin relied on the observations of amateur naturalists around the world to develop his theory of evolution.
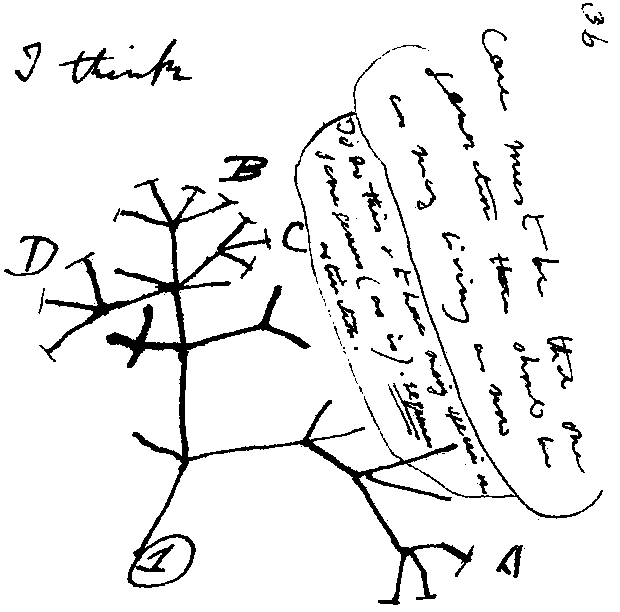
1837 sketch by Charles Darwin of an evolutionary tree. Source – Wikimedia Commons.
From bird watching to galaxies
Citizen scientists can get involved in a number of projects, depending on their interest, how much time they would like to spend, and what facilities they are prepared to loan.

The spiral galaxy NGC 1345. Source – ESA/Hubble/NASA.
Astronomy lovers can participate in the Galaxy Zoo project, where members of the public are asked to help classify galaxies. Humans are much better at pattern recognition than computers, and scientists simply to not have the time and resources to analyse the thousands of images of galaxies captured by telescopes. Amateur astronomers participating in Galaxy Zoo lend their eyes to carry out this task and millions of classifications have been carried out through the project.
Citizen science doesn’t just happen on people’s computers. In the spirit of Darwin, many ecology and wildlife scientific projects make use of thousands of amateur observations. Since the launch of the Garden Birdwatch in 1994, bird lovers help the British Trust for Ornithology understand how birds use our gardens through weekly observations of what species fly into their back yards. For the BioBlitz project, professional and amateur naturalists get together for an intensive 24-hour classification of all species of mammal, bird, insect, plant and fungus found in a particular space.
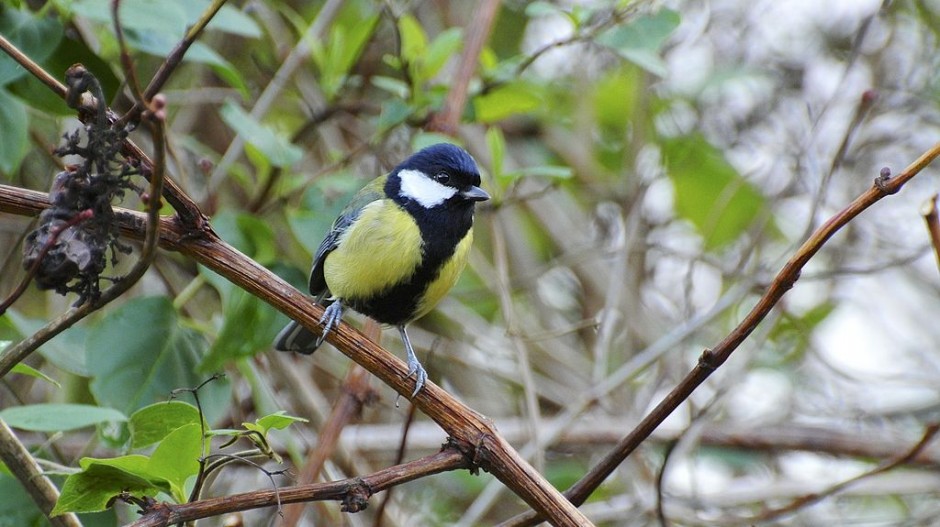
Great tit in a garden in Broadstone, UK. Source: Ian Kirk, Wikimedia Commons.
Many people have the desire, ability and tools to contribute to research activities. By facilitating the communication between research, policy and the public, citizen science is another instrument for public engagement, with potential mutual benefits for all.
How can citizen science help with climate change research?
In the wake of devastating events such as storm Sandy, typhoon Haiyan, Australian bushfires or the recent floods in the UK, the big question on everyone’s lips is this: Is climate change to blame for more frequent and powerful extreme weather events?
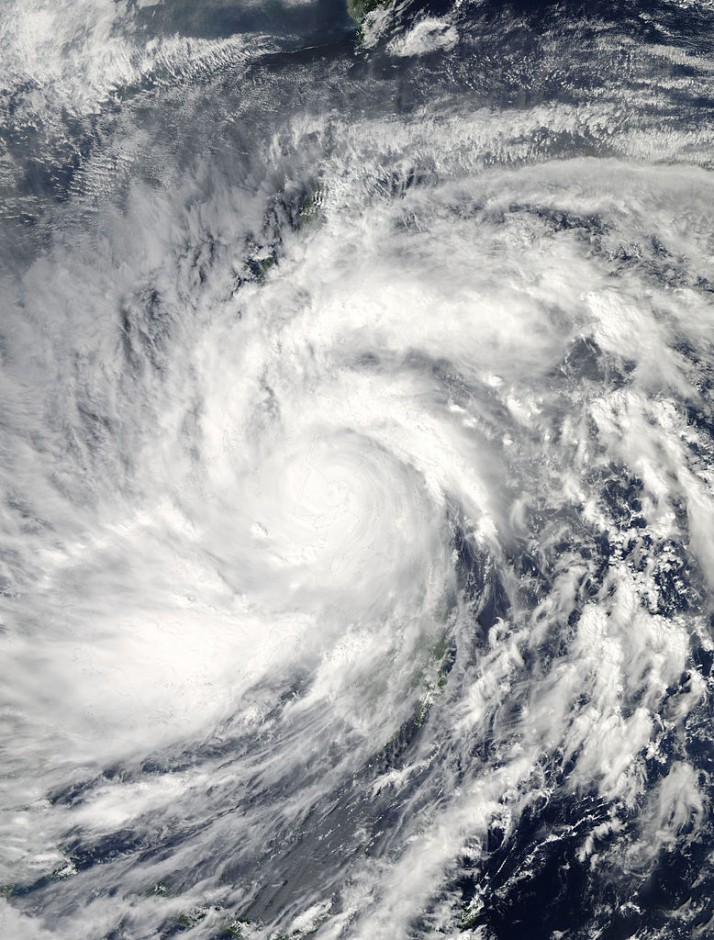
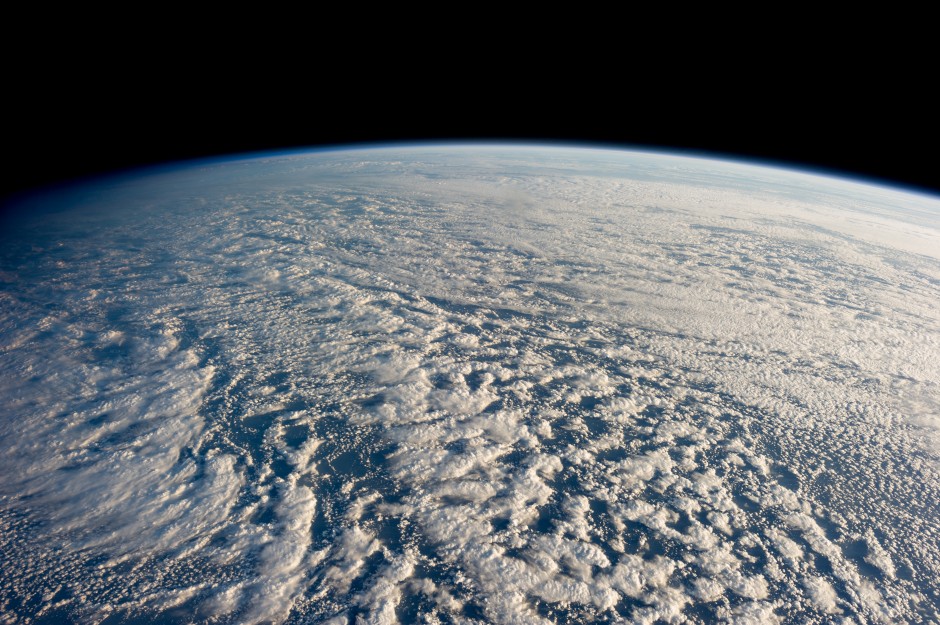
Typhoon Haiyan captured MODIS on NASA’s Aqua satellite. Source: NASA, Wikimedia Commons.
The process of linking specific extreme weather patterns to global climate change, what scientists call attribution, can be tricky. In order to define a causal relationship (did A cause B? Did climate change cause the UK storms?), climate scientists need strong statistical proof. This requires thousands and thousands of simulations of a particular set of conditions, so that any interesting climate trend can be established enough times to be “statistically significant”. But extreme weather events are, by definition, a result of rare and unusual weather conditions and so a great number of simulations have to be run to produce statistically relevant data.
Such a large number of simulations takes time and produces terabyte after terabyte of data that must then be analysed. This requires huge computing resources and universities and research centres often do not have the physical resources to carry out all these simulations rapidly.
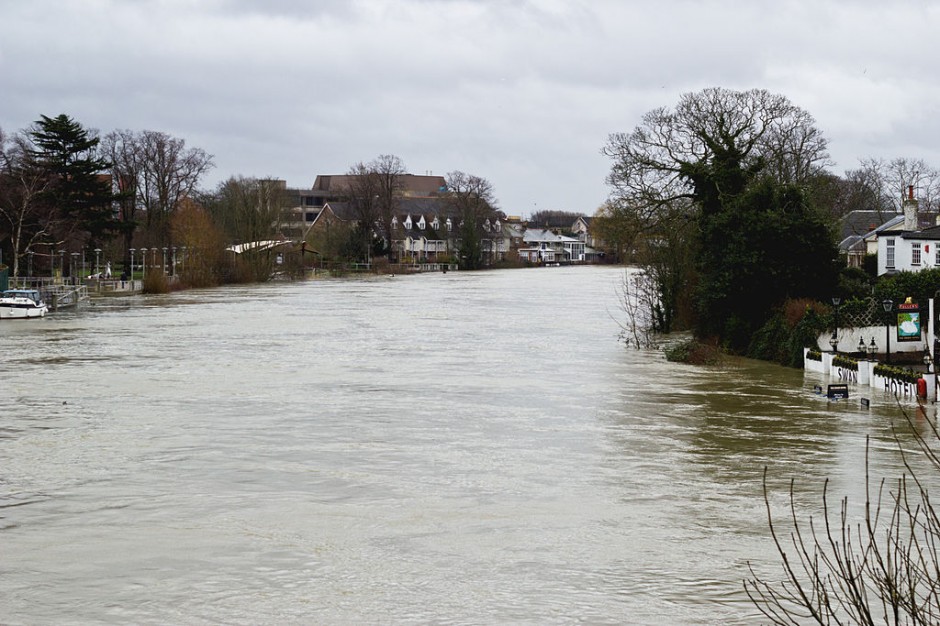
UK Floods, Staines-upon-Thames. Source: Marcin Cajzer, Wikimedia Commons.
The new weather@home project, set up by a team of Oxford climate scientists, asks interested members of the public to loan their spare computer time to help climate scientists run more numerous and faster climate simulations. It specifically aims to determine whether the UK’s wet winter and unusually strong storms were triggered by rising atmospheric CO2 concentrations and associated climate change.
How does it work?
For climate simulations to work, scientists have to tell the model where to start. For a chosen period of time to be modelled, they enter the set of particular conditions (“initial conditions”), such as atmospheric temperature, humidity, wind speed and greenhouse gas levels, that was observed at the start of the chosen period. They might decide to start their model one particular month and will use relevant data for that month as the model’s starting point.
Using these initial conditions, the model will then calculate how weather conditions evolve over time. Looking at the specific period of time when an extreme weather event occurred, scientists can model that same period thousands of times over in their climate model to see how often the model predicts the extreme event, and how often weather patterns unfold as normal, with no extreme event.
To determine whether this winter’s storms are linked to human-induced climate change, the weather@home team is running their model with two different sets of initial conditions.
– Real conditions that were actually measured (with high levels of greenhouse gases).
– ‘Natural’ atmosphere and ocean conditions that would have existed without the influence of human emissions.
By running thousands and thousands of these simulations, the Oxford team can then compare how frequently the extreme events occur in both sets of simulations and see whether the impact of human emissions have made these events more likely and/or stronger.
The weather@home project is on going, and the more simulations are carried out, the more robust the conclusions will be.
The first results are in!
The scientists are analysing the model results as they come in from citizen scientists’ homes, and anyone can monitor how the data evolves as more results are published on the website. Their first four batches of results are online here and it is possible to observe first hand how the plots are slowly building up as more and more data comes in. Thousands and thousands of simulations are still needed in order to acquire statistically significant results, and it is still time to join the project. The more the merrier. And the better scientists’ understanding of last winter’s extreme weather.