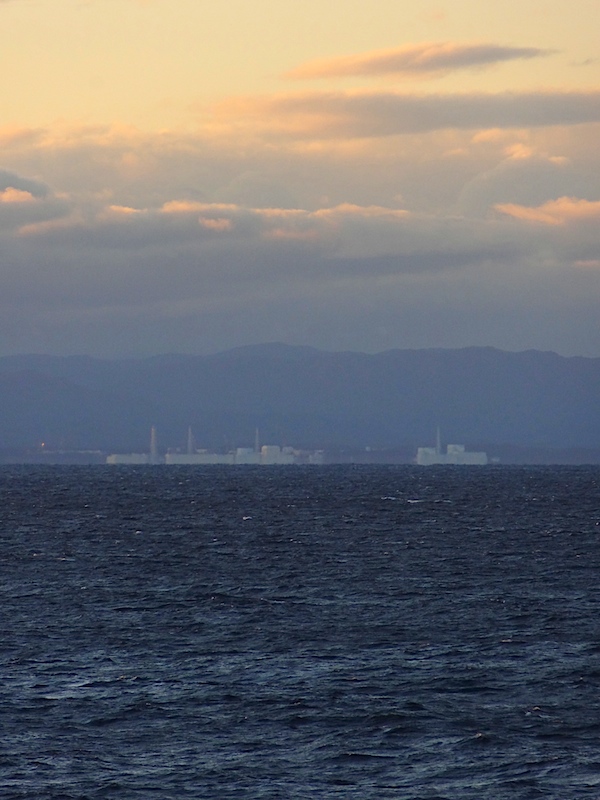
As the decommissioning of the damaged Fukushima nuclear power station begins, Marion Ferrat takes a look at how radioactive elements make their way to the world’s oceans – and how scientists can use them to study important processes that go on in our waters.
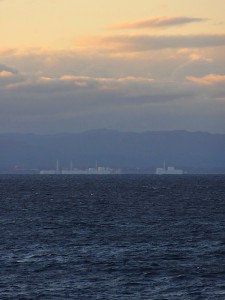
Fukushima Dai-ichi nuclear station – Source: Asacyan, Wikimedia Commons.
Early last week, work began to remove spent fuel rods at the disused Fukushima Dai-ichi power station, more than two years after the plant suffered a triple meltdown caused by the powerful earthquake and tsunami of March 2011. Over 1,500 fuel assemblies will be removed over the course of one year, but decommissioning of the entire site will take decades.
Like Chernobyl before it, the Fukushima disaster released large amounts of radioactive elements to the environment, many of which made their way into natural waters.
But such accidents are not the only sources of anthropogenic radionuclides – the radioactive products of nuclear reactions – to the environment. Radioactive elements have also been released from nuclear reprocessing plants, as well as from the hundreds of nuclear tests that took place between the 1940s and 1980s.
In this post, I want to explore what happens to these radioactive elements when they enter the aqueous environment, and how oceanographers use them as unique tracers to study ocean circulation patterns.
Where does the radioactivity come from?
The main sources of anthropogenic radionuclides to natural waters are:
Nuclear weapons tests in the 1940s-1980s:
This is what is called global nuclear fallout. Radioactive elements released during the hundreds of cold war weapons tests fell back into the oceans after the detonation of the nuclear devices. As most of the tests were carried out in the Pacific, this ocean became the largest repository of radioactive fallout. Only the longer-lived isotopes released from these tests remain in the environment today.
Radionuclides released during the Chernobyl reactor accident (April 1986):
The accident released 400 times more radioactive material than the Hiroshima bomb and is considered the worst nuclear accident in history. Adjacent regions in Belarus, Ukraine and Russia were the worst hit but a radioactive cloud travelling westward also contaminated many regions of Europe, the North Sea and the North Atlantic Ocean.
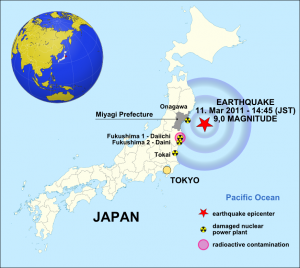
The Japan earthquake of 11 March 2011 – Source: Maximilian Dörrbecker, Wikimedia Commons.
Radionuclides released from the Fukushima Dai-ichi power plant (March 2011):
The tsunami generated by the Tōhoku earthquake of 11 March 2011 damaged the Fukushima nuclear facility, leading to equipment failure and a subsequent nuclear meltdown. This accident released between 10-30% of the radiation caused by Chernobyl. Fukushima and Chernobyl are both classified as level 7 (the maximum level) in the International Nuclear Event Scale.
Discharges from nuclear fuel reprocessing facilities:
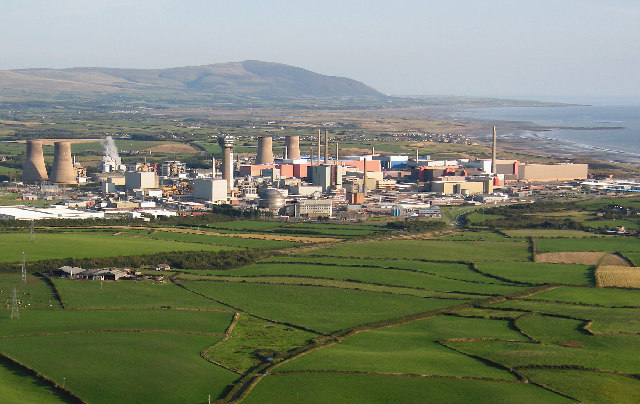
Nuclear reprocessing plants involve the extraction of plutonium and uranium from used nuclear fuels. The chemical processes involved generate large quantities of waste, which makes its way into the environment. Authorised releases from facilities such as Sellafield in Cumbria and Cap de la Hague in France have contributed to the contamination of the Atlantic Ocean and Irish Sea. Though discharges have been heavily reduced since their peak in the 1970s and 80s, these can still be observed in the environment. The Centre for Environment, Fisheries and Aquaculture science (CEFAS) releases annual or multi-annual environmental monitoring reports assessing the impact of this contamination in Britain.
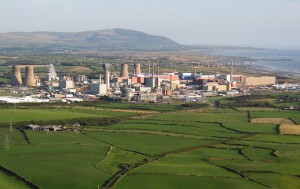
Aerial view the Sellafield nuclear reprocessing plant in Cumbria – Source: Simon Ledingham, Wikimedia Commons.
What are the main radionuclides in waters today?
A whole range of radioactive elements are released from these different sources. While some radionuclides produced are very short-lived (they decay with half-lives of hours to days), others can remain in the environment for tens to tens of thousands of years.
The main radioactive isotopes from these sources found in the oceans today include tritium (3-H), radiocarbon (14-C) and isotopes of strontium (90-Sr), technetium (99-Tc), caesium (134-Cs and 137-Cs) and plutonium (239-Pu and 240-Pu). They have half-lives ranging from 2 to 200,000 years.
These radionuclides are the most commonly studied both for monitoring (because of their radiological impacts) and research purposes: as it turns out, radioactive waters have a lot to say about the ways our oceans work.
Anthropogenic radionuclides: fingerprinting the oceans
Anthropogenic radionuclides are very strong tracers of oceanic, biogeochemical and sedimentary processes.
Once they make their way to the waters, they don’t just sit there; they swim, they sink, and they behave in a variety of different ways. Because some of these radioactive isotopes were absent from the natural environment until the mid 20th century, they only have a relatively small number of possible sources and can act like “fingerprints”, pinpointing the movement of particular water currents. So scientists can sample ocean water on large research ships, look at radionuclide concentrations in the water today, and see how far they have moved around in the oceans.
There are two types of interesting radionuclides: those that dissolve in the water, such as tritium or caesium, and those that react with particles, like plutonium. These two types of behaviour allow oceanographers to study different oceanic processes.
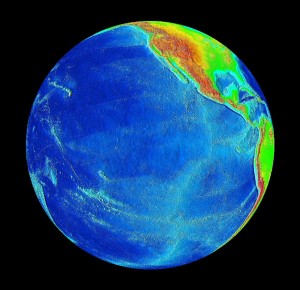
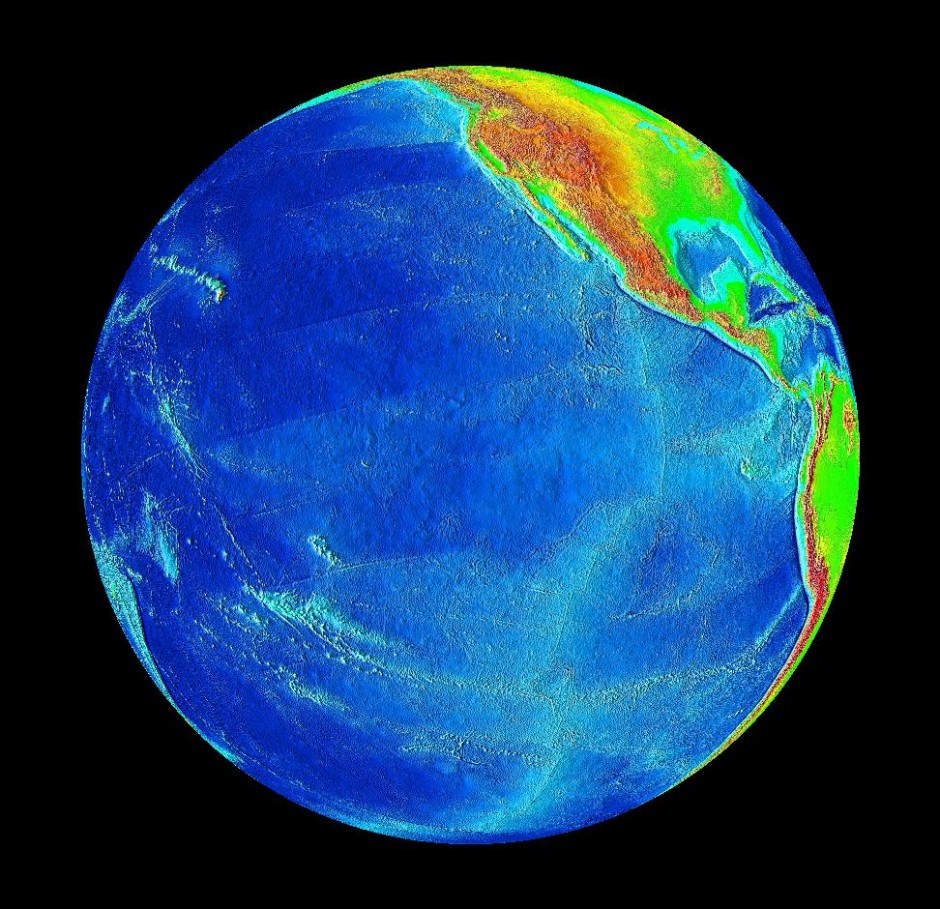
The Pacific Ocean – Source: NASA, Wikimedia Commons.
Soluble radionuclides are useful because they get transported with water masses: where the water goes, the radioactive element follows. Because scientists know with relatively high confidence where the elements entered the water, they can look at how ocean circulation has re-distributed them worldwide. For example, high caesium concentrations were recently found in the Tasman Sea. These must have come from elsewhere as very few nuclear tests were carried out in the Southern Hemisphere. Scientists were able to trace this caesium back to its source in the North Pacific Ocean, allowing them to study in detail the way that Pacific waters get transported across the equator over decades.
Particle-reactive elements like plutonium are equally useful. They will tend to attach themselves to larger particles (what is called being scavenged) rather than dissolve in the water, so they will slowly sink to the bottom of the ocean along their transport route. A few years ago, scientists from the Marine Environmental Laboratories of the International Atomic Energy Agency in Monaco carried out a global study of plutonium in the oceans of the southern hemisphere. They found that plutonium from the North Pacific region had made its way to the South Pacific, through to the Indian Ocean, and onto the South Atlantic. They also noticed lower and lower concentrations in the surface waters along the way, so they were able to study both the exact route of water transport, and the rate at which particles in the ocean scavenged this plutonium.
Gallons and gallons of water
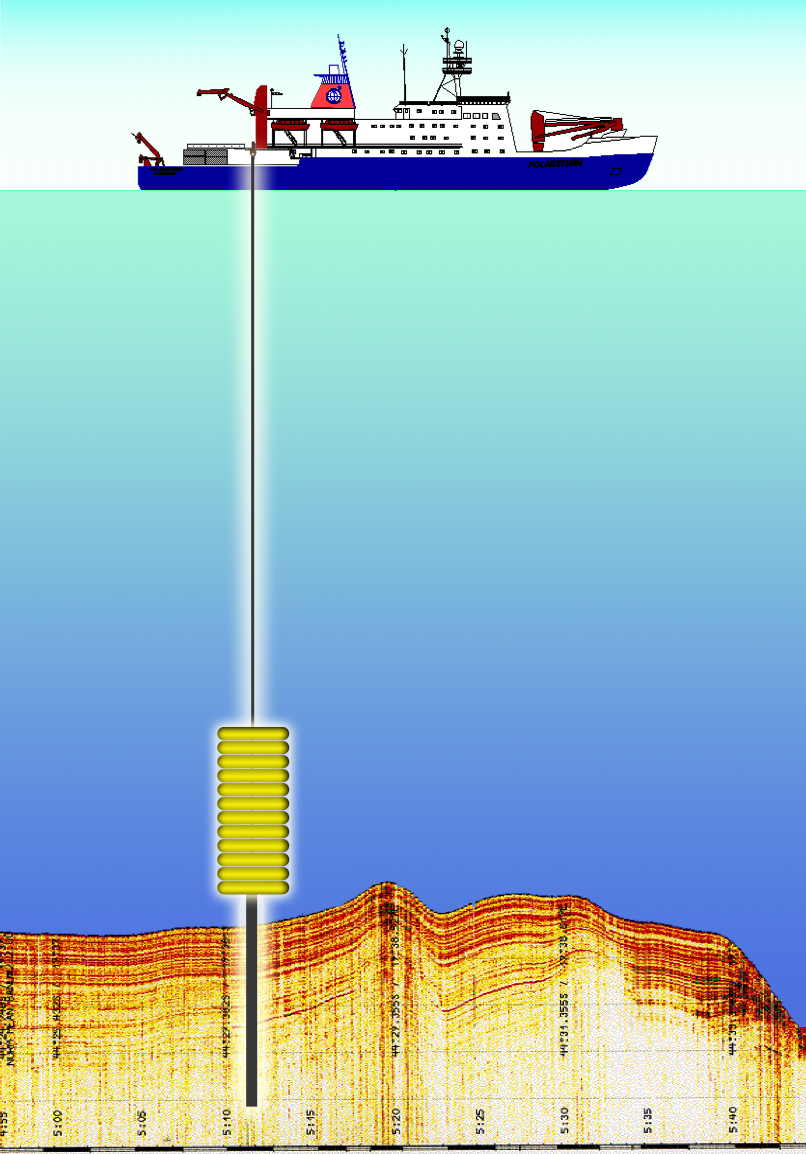
Though these radioactive elements are clearly present in the waters, their concentrations once they have travelled the world can be extremely low. This is a challenge for oceanographers wanting to measure them, because instruments cannot detect radioactivity below a certain level and measurements can be hampered by other sources of radiation. So scientists need to sample enough water to be able to confidently determine the radioactivity of their target radionuclides.
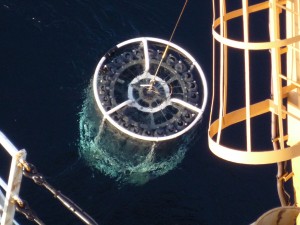
A rosette system for sampling seawater from research vessels – Source: NOAA Photo Library, Wikimedia Commons.
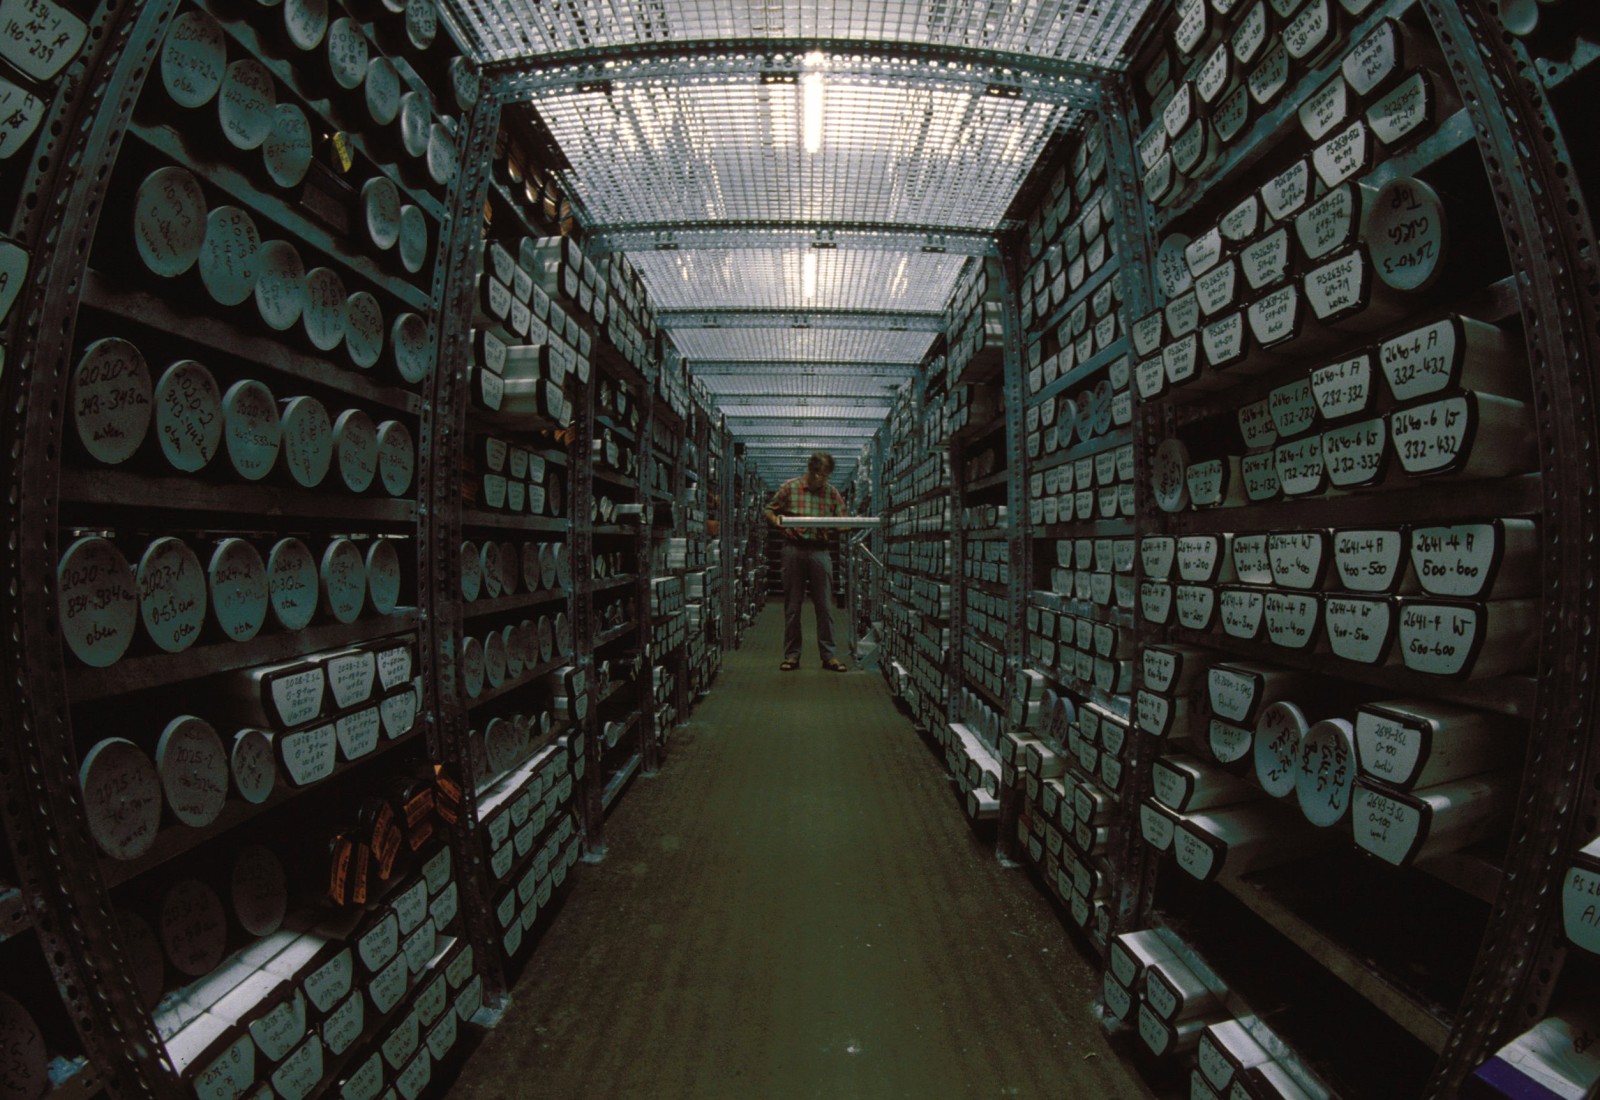
For tritium, this is relatively straightforward as it is present in high enough concentrations (but with little radiological impact). Approximately 1L of water is sufficient to determine its activity. But other radionuclides, such as technetium or caesium, have typically required up to hundreds of litres of water for one sample. This, of course, is problematic when sampling on a research ship: space is quickly taken up by huge containers of sampled water, and all of this water gets very heavy! Until recently, sampling ships have had to restrict themselves to certain elements or to a small sampling area in order to cope with the large volumes of water required.
Recent developments have allowed scientists to get around some of these problems. Radionuclides can be pre-concentrated on board the ship with clever feats of chemistry: the sampled water is passed through pumping systems containing certain reagents that ‘fix’ the radionuclide of interest (for example caesium), removing it from the bulk of the water. Once this is done, the remaining water can be emptied back into the ocean.
Developments in detector efficiencies and new ‘radiation-proof’ underground laboratories have also substantially increased the sensitivity of instruments and allowed the determination of important radionuclides in samples of tens rather than hundreds of litres.
Most of these radionuclides entered the oceans nearly half a century ago (this interesting video gives an idea of the scale of cold war nuclear testing over the Pacific Ocean). They will continue to decay with time and some will eventually disappear in a few decades. The longer-lived isotopes, however, will continue to swim the oceans for thousands of years to come. In any case, scientists will be able to use these nuclear products to study the world’s oceans.