EGU Blogs

Marion Ferrat

Marion is a postdoctoral researcher at Imperial College London, embarking on a science communication career and about to start an MSc in Science Communication. She holds a PhD in Paleoclimatology and Environmental Geochemistry and has worked in China as a climate modeller. She is particularly interested in climate change research and environmental policy. Tweets as @mle_marion.

Looking to the past to see into the future

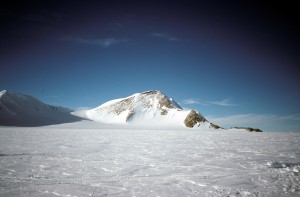
Brand Peak , Antarctica. Source: euphro, Wikimedia Commons.

Brand Peak , Antarctica. Source: euphro, Wikimedia Commons.

The Earth’s surface temperatures can have a profound effect on the Earth’s ice sheets, the huge layers of ice thousands of metres thick that cover Greenland and Antarctica. Over the past few decades, satellites have monitored the changes of these icy landscapes, revealing that parts of Greenland and West Antarctica are melting. This is important as it contributes to sea level rise, which can have significant impacts on vulnerable coastal lands.

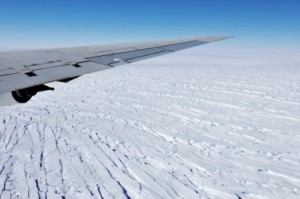
Pine Island Glacier in West Antarctica, seen from NASA's DC-8 research aircraft, 2009. Source: NASA/Jane Peterson.

Pine Island Glacier in West Antarctica, seen from NASA’s DC-8 research aircraft, 2009. Source: NASA/Jane Peterson.

So far, however, East Antarctica’s ice sheet, the largest on the planet, has been seemingly stable. One big question Earth scientists have busied themselves with is just how stable this ice sheet is, and whether or not it will be affected by the continuing CO2 emissions and rising temperatures that are projected for the coming century.

To try and get some answers, scientists can turn to the past. By looking at rocks or sediments that covered the Earth thousands or millions of years ago, at times when the Earth’s climate was either similar or different to today, they can study how the environment responded to these changing climates.


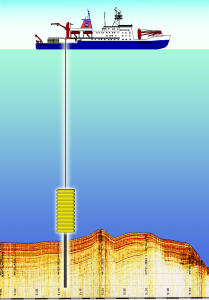
Sketch of a core being sampled from the seafloor. Source: Hannes Grobe/AWI, WIkimedia Commons.

Sketch of a core being sampled from the seafloor. Source: Hannes Grobe/AWI, WIkimedia Commons.

Between about 5 and 2.5 millions of years ago, during a time we call the Pliocene epoch, the Earth’s climate was very similar to that which scientists predict for the end of this century. Temperatures were about 3°C warmer than they are today, and CO2 levels were similar to those that are found in the atmosphere at present. By going to the bottom of the ocean and studying ancient Antarctic sediments from this time, Earth scientists can try to paint a picture of what Antarctica looked like under these conditions, which scientists suggest we may be facing in a few decades.

The chemical composition of buried sediment grains, dust and tiny algae can reveal information about the temperature of the water, its salinity, and also where the buried material physically came from before it found its way to the bottom of the ocean. By using very sensitive geochemical fingerprinting tools, scientists have for example found that sediments taken from the seafloor 350km off the coast of East Antarctica had originally come from a region of Antarctica called the Wilkes Basin, today buried deep under the ice sheet. For material from the Wilkes Basin to have been eroded and transported to the bottom of the sea, this region must have been out in the open and ice-free.

This could suggest that during warmer periods of the Pliocene, part of Antarctica’s giant East ice sheet did melt, and scientists think that such an amount of melting would have contributed to between 3 and 10 m of sea level rise. Today, such a rise, if it were to happen, could have important consequences.

Microfossils from a sediment core. Source: , Alfred Wegener Insititute, Wikimedia Commons.

Microfossils from a sediment core. Source: Hannes Grove/AWI, Wikimedia Commons.

Geological results such as these, not only from Antarctica, but from across the world’s oceans and seas, can provide important new constraints to help scientists understand what sort of environmental changes we may be facing tomorrow.

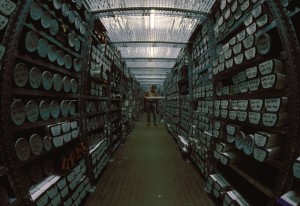
Geological core repository for sediment samples. Source: Hannes Grobe/AWI, WIkimedia Commons.

Geological core repository for sediment samples. Source: Hannes Grobe/AWI, WIkimedia Commons.


Citizen science: how can we all contribute to the climate discussion?

Until the turn of the 20th century, science was an activity practiced by amateur naturalists and philosophers with enough money and time on their hands to devote their lives to the pursuit of knowledge and the understanding of the natural world.

Hand-colored lithograph of Malaclemys terrapin, in John Edwards Holbrook's North American herpetology. Source - WIkimedia Commons.

Hand-colored lithograph of Malaclemys terrapin, in John Edwards Holbrook’s North American herpetology. Source – Wikimedia Commons.

Today, scientific research is an industry of its own, carried out by highly trained and specialised professionals in academic institutions and research laboratories. From the outside, the world of science can sometimes seem like a mysterious one. A world that conveys wonder yet can feel impenetrable and somewhat detached from the reality of our daily lives.

But science is not that far removed from us, and anyone with an interest in anything from astrophysics to ecology and climate change can get involved and become a citizen scientist.

Citizen science is the engagement of amateur or nonprofessional scientists in scientific research, either through observations in nature, data analysis, or loaning of tools and resources such as computer power. Though the concept has picked up in recent years, citizen science is nothing new: Charles Darwin relied on the observations of amateur naturalists around the world to develop his theory of evolution.

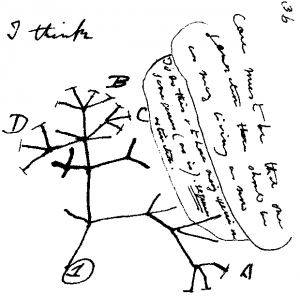
1837 sketch by Charles Darwin of an evolutionary tree. Source - Wikimedia Commons.

1837 sketch by Charles Darwin of an evolutionary tree. Source – Wikimedia Commons.

From bird watching to galaxies

Citizen scientists can get involved in a number of projects, depending on their interest, how much time they would like to spend, and what facilities they are prepared to loan.

The spiral galaxy NGC 1345. Source - ESA/Hubble/NASA.

The spiral galaxy NGC 1345. Source – ESA/Hubble/NASA.

Astronomy lovers can participate in the Galaxy Zoo project, where members of the public are asked to help classify galaxies. Humans are much better at pattern recognition than computers, and scientists simply to not have the time and resources to analyse the thousands of images of galaxies captured by telescopes. Amateur astronomers participating in Galaxy Zoo lend their eyes to carry out this task and millions of classifications have been carried out through the project.

Citizen science doesn’t just happen on people’s computers. In the spirit of Darwin, many ecology and wildlife scientific projects make use of thousands of amateur observations. Since the launch of the Garden Birdwatch in 1994, bird lovers help the British Trust for Ornithology understand how birds use our gardens through weekly observations of what species fly into their back yards. For the BioBlitz project, professional and amateur naturalists get together for an intensive 24-hour classification of all species of mammal, bird, insect, plant and fungus found in a particular space.

Great tit in a garden in Broadstone, UK. Source: Ian Kirk, Wikimedia Commons.

Great tit in a garden in Broadstone, UK. Source: Ian Kirk, Wikimedia Commons.

Many people have the desire, ability and tools to contribute to research activities. By facilitating the communication between research, policy and the public, citizen science is another instrument for public engagement, with potential mutual benefits for all.

How can citizen science help with climate change research?

In the wake of devastating events such as storm Sandy, typhoon Haiyan, Australian bushfires or the recent floods in the UK, the big question on everyone’s lips is this: Is climate change to blame for more frequent and powerful extreme weather events?

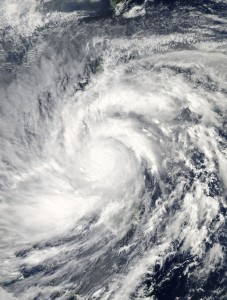
Typhoon Haiyan captured MODIS on NASA's Aqua satellite. Source: NASA, Wikimedia Commons.

Typhoon Haiyan captured MODIS on NASA’s Aqua satellite. Source: NASA, Wikimedia Commons.

The process of linking specific extreme weather patterns to global climate change, what scientists call attribution, can be tricky. In order to define a causal relationship (did A cause B? Did climate change cause the UK storms?), climate scientists need strong statistical proof. This requires thousands and thousands of simulations of a particular set of conditions, so that any interesting climate trend can be established enough times to be “statistically significant”. But extreme weather events are, by definition, a result of rare and unusual weather conditions and so a great number of simulations have to be run to produce statistically relevant data.

Such a large number of simulations takes time and produces terabyte after terabyte of data that must then be analysed. This requires huge computing resources and universities and research centres often do not have the physical resources to carry out all these simulations rapidly.

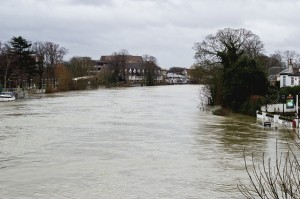
 UK Floods, Staines-upon-Thames. Source: Marcin Cajzer, Wikimedia Commons.

UK Floods, Staines-upon-Thames. Source: Marcin Cajzer, Wikimedia Commons.

The new weather@home project, set up by a team of Oxford climate scientists, asks interested members of the public to loan their spare computer time to help climate scientists run more numerous and faster climate simulations. It specifically aims to determine whether the UK’s wet winter and unusually strong storms were triggered by rising atmospheric CO2 concentrations and associated climate change.

How does it work?

For climate simulations to work, scientists have to tell the model where to start. For a chosen period of time to be modelled, they enter the set of particular conditions (“initial conditions”), such as atmospheric temperature, humidity, wind speed and greenhouse gas levels, that was observed at the start of the chosen period. They might decide to start their model one particular month and will use relevant data for that month as the model’s starting point.

Using these initial conditions, the model will then calculate how weather conditions evolve over time. Looking at the specific period of time when an extreme weather event occurred, scientists can model that same period thousands of times over in their climate model to see how often the model predicts the extreme event, and how often weather patterns unfold as normal, with no extreme event.

To determine whether this winter’s storms are linked to human-induced climate change, the weather@home team is running their model with two different sets of initial conditions.

– Real conditions that were actually measured (with high levels of greenhouse gases).

– ‘Natural’ atmosphere and ocean conditions that would have existed without the influence of human emissions.

By running thousands and thousands of these simulations, the Oxford team can then compare how frequently the extreme events occur in both sets of simulations and see whether the impact of human emissions have made these events more likely and/or stronger.

The weather@home project is on going, and the more simulations are carried out, the more robust the conclusions will be.

The first results are in!

The scientists are analysing the model results as they come in from citizen scientists’ homes, and anyone can monitor how the data evolves as more results are published on the website.  Their first four batches of results are online here and it is possible to observe first hand how the plots are slowly building up as more and more data comes in. Thousands and thousands of simulations are still needed in order to acquire statistically significant results, and it is still time to join the project. The more the merrier. And the better scientists’ understanding of last winter’s extreme weather.


Towards a greener energy world?

Marion reports on the latest Grantham Institute for Climate Change special lecture by International Energy Agency Chief Economist Dr Fatih Birol. 

On January 29th, I attended the Grantham Institute for Climate Change special lecture by International Energy Agency (IEA) Chief Economist Dr Fatih Birol at Imperial College London. Dr Birol discussed the future of the world’s energy market and outlined the main conclusions of the IEA World Energy Outlook report published in November last year. Here are the main points of Dr Birol’s lecture.

The long-held tenets of the energy sector are being rewritten

Trade patterns are changing and countries are switching roles, with long-established energy importers becoming exporters.

–        The United States will soon become a significant gas exporter;

–        Brazil is predicted to become a major net oil exporter around 2015;

–        The Gulf States will increasingly export towards Asia.
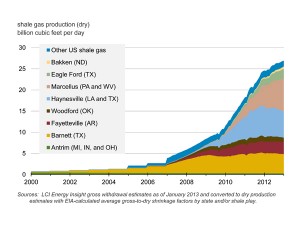
US shale gas production, historical and projected - Source: US Energy Information Administration, Wikimedia Commons.

US shale gas production, historical and projected – Source: US Energy Information Administration, Wikimedia Commons.

This is mainly due to the shale revolution and changes in nuclear policies of some countries following the Fukushima nuclear disaster. These new supply options are reshaping ideas about the distribution of resources.

However, long-term solutions to the global energy challenges remain scarce. There is a renewed focus on energy efficiency but CO2 emissions continue to rise. One problem remains the heavy subsidies of fossil fuel prices. These give an increased impetus to the consumption of coal, oil and gas and make it difficult for the clean energy industry to compete.

China is currently the main driver of the increased energy demand but India is predicted to take over in 2020 as the principal source of growth.

Most importantly, 1.3 billion people still lack access to electricity, mainly in Africa and South Asia, and the world must solve this problem.

What proportion of fossil fuels?

Twenty-five years ago, fossil fuels accounted for 82% of the global energy mix. It still accounts for 82% today, suggesting that reduction policies are not effective. Nonetheless, this number would perhaps be even higher if these policies were not in place.

The proportion of fossil fuels is predicted to decrease to 75% by 2035. They will still dominate in the near future, but the amount of renewables will increase.

With this fossil fuel energy mix, CO2 emissions will continue to increase and temperatures are set to rise by 3.6 degrees, which would have major environmental implications.

No more excuses?

As the most important energy consumer and CO2 emitter, it is very important that China be part of the future energy landscape. The country is currently relying on two premises to justify its share of global emissions:

1. Holding the past to account

OECD member states (as of 2006) - Source: St. Krekeler, Wikimedia Commons.

OECD member states (as of 2006) – Source: St. Krekeler, Wikimedia Commons.

The world cannot look only at today’s emissions but must take the past into consideration. The United States and the European Union became rich by using large quantities of coal to push the industrial revolution, so they bear the largest responsibility in today’s CO2 concentrations.

However, the responsibility of non-OECD countries will soon increase and will account for rising shares of emissions. It is thought that the energy consumption of non-OECD countries will be half that of OECD countries in 2035.

2. Emissions per capita over total emissions

With over 1.3 billion inhabitants, China’s total emissions are logically higher. The world must focus on emissions per capita.

However, models predict that Chinese consumption per capita will exceed that of some OECD countries next year.

We should be optimistic about Paris

The 21st session of the Conference of the Parties to the UNFCCC will be held in Paris in 2015. We can be optimistic that world leaders will reach an agreement for three reasons:

Source: J.M. Schomburg, Wikimedia Commons.

Source: J.M. Schomburg, Wikimedia Commons.

–        US emissions are decreasing, with current emissions at the level of those of the early 1990s. This is mainly a result of replacing coal with natural gas.

–        Chinese increase in CO2 emissions has been one of the slowest in the past year. This is a result of decreasing coal consumption and investment into renewables. It is likely we will see limitations for coal consumption both locally and nationally in the near future.

–        The EU is very active and remains committed to reducing emissions.


Can we achieve a 2 degree warmer world?

Under the current energy landscape, the world is not on track to keep average warming to 2 degrees by the end of the century. The IEA has outlined four energy policies that can keep this scenario alive, coined the 4-for-2 degrees scenario . These four policies could stop the growth of emissions by 2020 at no net economic cost and decrease emissions by 31 Gt, 80% of the saving required to be on track for a 2 degrees warmer world.

1. Implement new energy efficiency measures.

Targeted energy efficiency measures in buildings, industry and transport account for nearly half the emissions reduction in 2020. These will pay back within 5 years, with the additional investment required being more than offset by reduced spending on fuel bills.
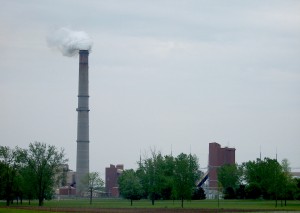
The coal-fired Kintigh Generating Station in Somerset, New York - Source: Matthew D. Wilson, Wikimedia Commons.

The coal-fired Kintigh Generating Station in Somerset, New York – Source: Matthew D. Wilson, Wikimedia Commons.

2. Limit the use of inefficient coal power plants.

This would achieve more than 20% of the emissions reduction required and reduce local air pollution. The share of power generation from natural gas and renewables would increase in parallel.

3. Avoid methane escape during oil and gas production.

Emissions of methane (a strong greenhouse gas) during the production of oil and gas can easily be fixed with no negative economic impact. This requires a 0.6% investment for a reduction of half of methane emissions. This would provide 18% of the savings by 2020.

4. Partially phase-out of fossil fuel subsidies.

Implementing a partial phase-out of fossil fuel consumption subsidies would account for a 12% reduction in emissions.

There are four reasons to remain optimistic about the likelihood of implementing these policies:

–        Political support: At the 2013 IEA Ministerial meeting in Paris in November, Energy Ministers agreed to push these measures forward.

–        The US have declared they are committed to finding ways to remove support for inefficient coal power plants.

–        The World Economic Forum Annual Meeting in Davos revealed that several oil and gas companies were interested in cutting down their methane emissions.

–        G20 countries are discussing fossil fuel subsidies.

What future for the energy sources?
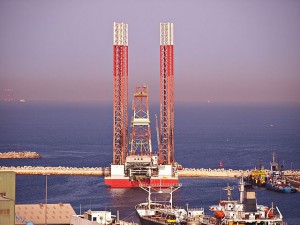
Oil Rig at Port Khaled, UAE - Source: Basil D Soufi, Wikimedia Commons.

Oil Rig at Port Khaled, UAE – Source: Basil D Soufi, Wikimedia Commons.

Oil: It was predicted last year that the US would surpass Saudi Arabia as the largest oil producer by 2017. It now seems that this will happen in 2015. This is not to say that this is the end of Middle Eastern oil. Shale oil in the US will grow but will almost exclusively be used nationally to meet the domestic consumption demand.

Consumption is also increasing in Asia and Middle Eastern oil is needed to meet this demand.

Renewables: The renewable energy market is growing everywhere in the world, especially in China. China is investing more in renewables than the US, all of Europe and Japan combined.

The expansion of non-hydrocarbon renewables depends on subsidies. Subsidies worldwide amount to approximately 100 billion USD, 60% of which are in Europe for on- and offshore wind and solar energy. This is set to double by 2035.

The issue of competitiveness

Before the shale gas revolution, gas prices between different regions were relatively similar. Now, EU and Japan natural gas prices are three and five times that of the US, respectively. This divergence will remain in place for many years, causing a structural issue for Europe and Japan. The big question now is if and how the EU will cope with this. Electricity prices are also increasing.
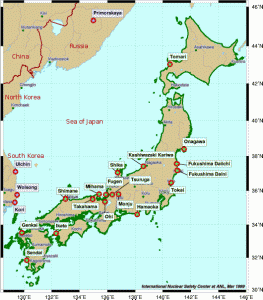
Location of Japanese nuclear power plants in 2006 - Source: PD-USGOV, Wikimedia Commons.

Location of Japanese nuclear power plants in 2006 – Source: PD-USGOV, Wikimedia Commons.

This divergence will impact the EU and Japan. Today, 52 Japanese nuclear reactors are stopped. The country is more reliant on imports and is recording its 17th month of trade deficit. Thirty million people in the EU are employed in energy intensive industries such as petrochemicals, aluminium and cement. This is a large portion of the EU’s economic output.

The change in energy prices will create clear winners (US, China) and losers (EU, Japan). If policies do not change, this will have a knock-on effect on the economy.

Conclusions

1) The global energy landscape is changing fast. Companies that cannot read these changes will become losers. Those who can see development coming and position themselves accordingly can benefit from this.

2) China and India will drive the growing dominance of Asia in the global energy demand.

3) New technologies are opening up new oil resources but the Middle East remains critical.

4) It is likely that the regional price gap for natural gas and electricity will remain significant for many years but there are ways to react. There is a need for efficiency policies to counteract these developments.

5) The transition to a more efficient, low-carbon energy sector is more difficult in tough economic times, but no less urgent.
Has climate change changed in the media?

Whether in a concerned, neutral, alarmist or sceptical tone, climate change is often reported in the media. But has the press approached this subject differently over the years? Marion Ferrat takes a look at the UK press coverage of the last two IPCC reports and investigates how the treatment of climate change has changed in British newspapers.

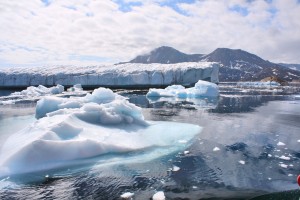
Glaciers outside of Ammassalik in Greenland - Source: Christine Zenino, Wikimedia Commons.

Glaciers outside of Ammassalik in Greenland – Source: Christine Zenino, Wikimedia Commons.

Last week, polling expert Leo Barasi posted the results of a very interesting study in his public opinion blog Noise of the Crowd. Following the waves of flooding that have hit the UK – and been at the centre of the UK press coverage – for the past month, he analysed the trends in flooding stories in the newspapers since 2005. He found that the number of news articles about flooding that also mentioned climate change dropped from 25% in 2009 to 11% last year.

This result reflects a broader trend in the public perception of climate change. Since the 2009 Copenhagen climate change conference, there has been a decrease in the number of people believing in human impacts on climate, and a rise in climate change scepticism.

One of the triggers of this change was the unfortunate email hacking incident at the University of East Anglia, commonly referred to as Climategate. In November 2009, over 1000 private emails between scientists of the Climatic Research Unit were stolen and released online. Some of these emails were interpreted as scientists hiding data in a bid to convince the world of the dangers of global warming. The controversy took the internet by storm and, although a careful investigation later showed that the scientists had not behaved in an untrustworthy way or manipulated any data, the damage was done.

The London Times, 6 July 1863 - Source: Wikimedia Commons.

The London Times, 6 July 1863 – Source: Wikimedia Commons.

After the release of the last IPCC report in September 2013, I carried out a similar analysis of climate change coverage in the UK press. I compared the press coverage of this fifth Assessment Report (AR 5) with that of the previous report (AR 4) in February 2007. Using a newspaper database called Factiva, I read all the news articles published in eight UK daily newspapers during the week of the two reports’ release1. Here is what I found.

News coverage of IPCC AR 4 and AR 5

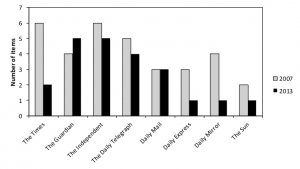
The 5th Assessment Report (2013) saw less coverage than the 4th Assessment Report (2007), with 22 and 33 articles, respectively. The majority were published in The Times, The Guardian, The Independent and The Daily Telegraph. Over 80% of the news stories were covered by specialist science or environmental correspondents in 2013, against 48% in 2007.

Table1

What type of climate change?

I was interested in what was actually being reported in the press. Were journalists more concerned by air temperatures or ocean warming, or perhaps extreme events?

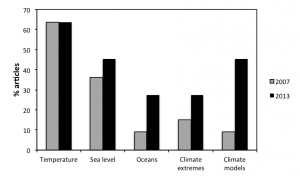
In 2007 and 2013, all newspapers talked about changes in temperature (64% in both years). Discussions of changes in sea level increased from 36% to 45% in 2007 and 2013, respectively, and climate extremes from 15 to 27%.

Coverage mentioning the oceans trebled from 9% in 2007 to 27% in 2013. This is interesting given the controversy surrounding the so-called “warming hiatus”. Global atmospheric temperatures have been relatively stable since 1998, and climate sceptics argue this is evidence that CO2 emissions do not dangerously affect temperatures. Scientists have suggested that the oceans have a complex role to play in modulating atmospheric temperatures.

But the most obvious change was the number of articles mentioning climate models. Despite being a central component of scientific results in both reports, references to models in the press were made in only 9% of the 2007 articles against 45% in 2013.

Table2

From scared to sceptical: a changing tone

In 2007, 42% of the articles across all news outlets but The Daily Mirror described the report as bleak, sobering, gloomy, frightening, grim, stark or terrifying. These adjectives were absent from the 2013 coverage, which rather used more neutral words such as most comprehensive, most authoritative or making the most overwhelming case (27% of the articles).

One big difference was the number of direct references to climate change scepticism or denial, which doubled from 30% in 2007 to 59% in 2013.

From cataclysm to careful concern in Britain

Newspapers such as The Daily Express, Daily Mail and The Sun were most concerned with consequences of climate change in Britain. Interestingly, these concerns were different in 2007 and 2013. The references were very sensationalist in 2007, with reports in The Daily Express, The Daily Mirror and The Sun that climate change “would devastate Britain”, which would face “disasters similar to the devastation […] caused by Hurricane Katrina”. They were more moderate in 2013, referring only to Britain likely experiencing “wetter winters and drier summers”.

Says who?

Quotes are an important part of a news article. They give weight to particular aspects of a story and enable journalists to convey opinions whilst maintaining the objectivity of their reporting.

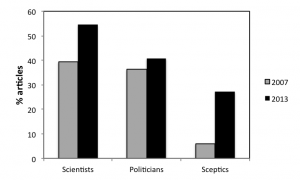
In 2007, 39% of all articles contained quotes from scientists, rising to 55% in 2013. The percentage of articles containing quotes from politicians also rose from 36% to 41%. Most quoted politicians in each case were the Environment Secretary David Miliband (2007) and the Secretary of State for Energy and Climate Change Ed Davey (2013), both stressing the importance of climate change mitigation.

The largest change can be seen in the percentage of articles including quotes from climate change sceptics, which increased from 6% in 2007 to 27% in 2013.

Table3

What has changed?

Overall, the coverage of both IPCC reports was factual, detailed and accurate across all newspapers studied. The 5th Assessment Report saw less coverage than AR 4, suggesting a general dip in public interest in climate change. One interesting point was the discrepancy between the articles’ content and their titles in tabloid papers. Although the articles themselves were generally quite neutral, their titles voiced a much more pronounced scepticism. Given that most people would first and foremost read and remember an article’s title, their wording can have an important impact on public opinion.

The tone of the 2013 coverage was both less sensationalist (e.g. minimal use of words such as stark and terrifying) and more likely to include mentions of- and quotes by climate change sceptics.

In terms of scientific content, the main difference was the inclusion of the concept of climate models and their limitations and strengths in the 2013 press coverage (in 45% of articles against only 9% in 2007). This is possibly also in response to the ‘warming hiatus’, rather than because climate models have been a larger part of AR 5.

The political nature of the climate change debate was seen in the coverage of both IPCC reports, with over one third of the articles quoting politicians in both years.

The biggest difference was the much larger place given to climate change sceptics in the news coverage, nearly doubling from 30% in 2007 to 59% in 2013. Despite the increased certainty of the IPCC results from AR 4 to AR 5 (moving from 90% to 95% certainty that humans are influencing climate), it is clear that there is more room in the media today for uncertainty and climate change scepticism.

Marion

1This study covered the release of the Working Group 1 reports. News articles were selected from the News sections only, by searching for the terms climate change and either IPCC or Intergovernmental Panel on Climate Change.