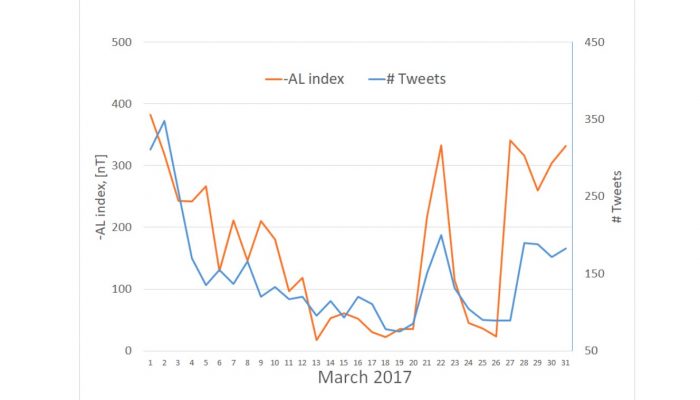
Social media platforms offer every person with internet access the possibility to share content of various kind. The recent increase in social media use globally give birth to new tools and insights, from a different perspective. The size of, and the global nature of the user driven social media, makes one expect it to include information also about geomagnetic activity related to posts of visual observations of the aurora by the users. Inspired by the ongoing Aurorasaurus initiative, an outreach project with a High School class in Norway was undertaken, where the students were given the task to see if they could find any connection between the number of social media reports of aurora (using Twitter), and the observed level of geomagnetic activity (using the AL index). Their results showed a highly significant correlation, especially during the months of high geomagnetic activity, as seen in the above plot.
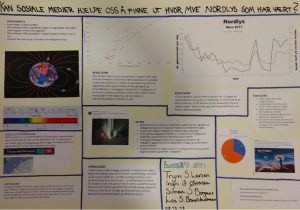
We here include a short project report from one of the groups to share details on how the investigation was done. The text has been prepared by Simen Sande Bergaas, Lea Sommersten Brandstadmoen, Trym Svardal Larsen, and Ingri Østensen from Langhaugen High School, Norway, together with two of their teachers.

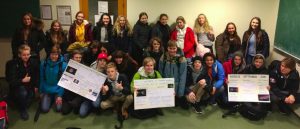
The students from Langhaugen High School participating in the project. Credit: Silje Rognsvåg Reistad
Introduction
We wanted to find out whether social media could be a valid source for finding out how much northern light there had been, and when it appeared. We used Twitter as our social media, and searched on one specific date, so we could see how much northern light there had been each day. We wanted to see if there were any similarities between a geomagnetic activity index (AL) and the number of hits we got on Twitter.
Method
- Each group looked at one month between September 2016 and April 2017
- We counted the hits on Twitter for #northernlights and/or #auroraborealis each day of our month
- We plotted these results together with the daily average geomagnetic index (AL) using Excel.
Results
As we can see from the top figure, we got a good match between the daily Twitter count and the AL index. We got similar results for most of the eight months. The only month that we did not see any correlation was December, in which had very low Twitter counts.
How many of the Tweets were relevant?
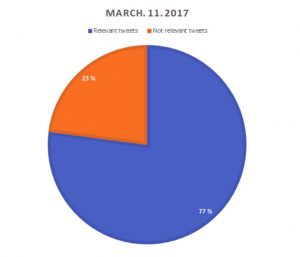
One of the groups wanted to do something more with the project, and decided to count how many of the posts we found were relevant, and actually showed northern lights that had occurred that day. We chose one of the days, and then we counted. The result is shown in the figure below. The day we counted, there were 96 posts. Out of these 96 posts, 22 did not contain relevant information to our project. That equals 23% non-relevant posts, and 77% relevant posts.

Breakdown of all Twitter posts on March 11, 2017. Most of the posts (77%) were found to be related to auroral activity.
Conclusions
What we saw from these statistics was that there are similarities between the measurements and the Twitter posts. We can say that social media can be a somewhat valid source for describing the geomagnetic activity level, but not a waterproof one. Looking at the other months, it looks like the correlation improves during active times, while December, which was a quiet month, had very poor correlation. We also see that on March 11, very few of the posts were non-relevant, which strengthens the credibility of social media as a source.

