We are in the era of Big Data. Big Data is a ‘hot’ topic. It is a popular term often associated with an increase in volume, variety and velocity of data. The Copernicus programme for example, the European Union’s flagship programme on monitoring the Earth’s environment using satellite and in-situ observations, anticipates a massive increase in satellite data volume. It is estimated that solely the Sentinel missions, Copernicus’ space component, will produce 4TB of processed data each day (FDC 2016).
The European Centre for Medium-Range Weather Forecasts (ECMWF) hosts the Meteorological and Archival Retrieval System (MARS), which is the world’s largest archive of meteorological data. The archive currently holds more than 90 PBs of data and continues to grow by additional 3 PB every month.
Big Data and an increase in data volume comes along with an increase in computing and processing power. Or is it the other way around? When Gordon Moore, co-founder of Intel, introduced 1965 his observation that the number of integrated circuits doubles every two years, he did not think of an associated exponential growth of data. Moore’s law since then has been adjusted to 18 month, but it is equally applicable to data growth.
The increase in data volume is partly due to new sensor technologies and new kind of data. The variety and type of data has never been more diverse. Sensors and satellites continuously collect data and monitor the state of the Earth. The Internet of Things brings a constant flow of unstructured data content. The speed at which data is generated and moved around has increased tremendously. In 2013, IBM was releasing a number that 90% of all of the world’s data has been generated in the past two years. This number has most likely been growing since.

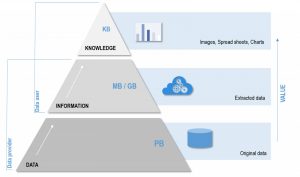
The data, information, knowledge hierarchy – How raw data is turned into value-added information and knowledge for users and decision-makers (J. Wagemann)
To recapitulate: at a first sight, more data, new data sources and a constant data flow sound like a true boon for every data scientist. However, it is vital, when talking about Big Data, to differentiate between raw and unstructured data and value-added information. Information is extracted from raw data. Information and insight is what is real needed. The challenge is to turn Petabytes of raw and unstructured data into kilo- or megabytes of refined information (Rowley 2007). Decision-makers need refined and actionable information to base decisions, policies and recommended actions on. The question is if we can expect an increase in information at the same speed as Big Data is generated. And there the bane of Big Data comes into play.
The bare presence of Big Data is not enough. Turning Big Data into information brings new challenges along the entire data value chain. We face challenges in data generation, where we have new data sources and types from social-media, citizen-empowered science, crowdsourcing and unmanned aerial vehicles. We face challenges in data storage and management, where questions related to high performance computing architectures, interoperability of data management systems and cloud computing have to be addressed. Data governance, data licensing and metadata are further essential areas that have to be dealt with.
We also face challenges in data analysis, where data mining and machine learning is a ‘hot’ and popular topic. And we face challenges in data insights, especially related to data communication and visualization. The best research and findings are valueless if not communicated properly.
These challenges along the entire data value chain are well reflected in the four official subprogrammes of the Earth Science and Space Informatics (ESSI) division of the European Geoscience Union, which are: (i) Community-driven challenges and solutions dealing with Informatics, (ii) Infrastructures across the Earth and Space Sciences, (iii) Open Science 2.0 Informatics for Earth and Space Sciences and (iv) Visualization for scientific discovery and communication.
ESSI is a very interdisciplinary field and compared to other geoscientific disciplines, a rather recent but important research field. The keen interest of the geoscientific community in ESSI was reflected at this year’s EGU, where there was often a mismatch between a too small size of the room for the ESSI sessions and the high number of people interested.
Coming back to the question in the headline: “Big Earth Data – Boon or bane?” Let’s find a compromise maybe. What about considering Big Earth Science Data as boon, as a start? The amount of freely available, high-resolution data products and current processing capabilities give us new opportunities that have never been possible before. And we gain hidden insights into the state of our Earth. Key to the great potential Big Data incorporates is open data access. Related to the importance of open data policies I recommend Barbara Ryan’s TEDx talk about Unleashing the Power of Earth Observations (TED 2014). Barbara Ryan is the General Secretary of the Group of Earth Observations (GEO) and illustratively explains the positive outcomes of opening up the entire Landsat archive in 2008.
The era of big data forces us to rethink and disrupt our common data processing approach. Currently, a data scientist spends 80% of the time with managing and pre-processing the data and has only 20% for the actual data evaluation. Every stakeholder along the data value chain, from data generator over data provider to data user has to work on innovative approaches to tackle concurrent challenges and to leverage the full potential of Big Earth Science Data. The bane comes into play, if we continue generating and storing massive amounts of data and fail to turn it into value-added content.
What is the boon and what is the bane of your research with Big Earth Science Data? What challenges do you face in your daily grind of data processing? What challenges of Big Earth Science data do you address with your research / current work?
We would like to know about it. This blog post is the first of hopefully monthly blog post contributions of the ESSI division and we are looking for any contributions within the ESSI community.
Related to this blog post, the movie Big Earth Data is highly recommended.
References:
FDC (2016): Data Volume | Copernicus. – http://newsletter.copernicus.eu/article/data-volume (last access: 2016-06-29)
Rowley, J (2007): The wisdom hierarchy: representations of the DIKW hierarchy. Journal of Information Sciences 33/2: 163-180.

Bárbara Ferreira (EGU Media and Comms Manager)
Great first blog post Julia! A nice introduction to data in the Earth sciences and the challenges with transforming it into useful information. All the best for the blog!
Julia Wagemann
Barbara, thanks a lot!
Pingback: GeoLog | Looking back at the EGU Blogs in 2016: a competition
sam
site really nice with good content.
meenal deshpande
Its totally depends upon individuals mentallity we can use it for wrong as well as right things.The communication industry is developing a lot with the help of Social media because it helps in the growth businesses, governments sector companiesThe communication industry is developing a lot with the help of Social media because it helps in the growth businesses, governments sector companies