EGU Blogs

Nitrate

Night flight

Night flight

After what has seemed like an eternity (or more than one post-doc post, which is essentially the same thing), I’ve got a new paper published. To commemorate this auspicious occasion, I’m going to write about it.

The paper is published in Atmospheric Chemistry and Physics and is available open access here.

The study investigated how aerosol particles can alter atmospheric chemistry during the night using measurements on-board a research aircraft flying around the UK. These alterations are important as they can affect the build-up of pollution both during the night and into the following day. These changes can worsen air quality and affect regional climate. Most of the previous studies on this topic have been done in the USA, where the chemical make-up of aerosol particles is often quite different to European aerosol particles.

Specifically, the study looked at how a gaseous chemical compound called dinitrogen pentoxide, which is chemistry-speak for two nitrogen molecules and five oxygen molecules (N2O5), reacts with aerosol particles. Under the right conditions, N2O5 can interact with aerosol particles and be ‘captured’ by them via something called a heterogeneous reaction. This ‘uptake’ of N2O5 can lead to reactions with the water commonly associated with aerosol particles, form another compound called nitric acid and finally join the particle realm as nitrate aerosol.

Nitrate aerosol is a pollutant, so this process has ramifications for air quality plus nitrate aerosol is very good at bouncing sunlight back to space, which cools the surface of the Earth. Furthermore, under certain conditions, this process can enhance ozone formation in the lower atmosphere. Ozone is bad for our health if we breath it in and it is a greenhouse gas, so it warms the atmosphere.

The night-time bit of the equation is important as N2O5 is only present in the atmosphere in significant quantities during darkness; during the day it is destroyed by sunlight. There haven’t been many studies looking at this process in the real atmosphere and very few have been done on an aircraft.

A hard day’s night

Flying on the aircraft was an interesting experience as we were typically taking off around 10pm and not landing again until gone 2am (dirty stop outs that we were). Personally, I typically had another hour of work to do on the ground after a flight as I had to calibrate the instrument I was running, which meant I generally didn’t get back to the hotel until after 3am. This went on for two weeks, which meant we had to adjust our sleeping patterns accordingly. This was drastically different to any other flying campaign I have worked on, where we generally have to be on the aircraft between 4-6am to turn on the instruments. Bizarrely, I’ve never felt so rested during a project, as I typically got around 8 hours sleep every night!

So, what did we find out?

  • We found that the chemical make-up of the aerosol particles influenced night-time atmospheric chemistry. The strongest controls were the amount of water associated with the aerosol, which increased the uptake of N2O5 to the particles, and the amount of ammonium nitrate in the aerosol, which decreased the uptake of N2O5.
  • Compared to previous studies, the level of uptake of N2O5 was relatively efficient, which was probably a result of air being moister in our study region. The increased moister leads to more water being available to condense onto the aerosol particles, which will promote this uptake process.
  • When we compared our measurements to parameterisations that have been proposed for regional and global aerosol models, the parameterisations didn’t do very well. These parameterisations are equations that have been put together based on laboratory studies of the N2O5 uptake process.

These points are summarised in the graphic below, which shows a comparison of the parameterised and measured N2O5 uptake, which is commonly shortened to γ(N2O5). The horizontal axis is for the measurements, with the vertical axis for the parameterised values. Each sub-figure is for a set of calculations using different parameterisations and assumptions and the scales are the same in all of the plots. The markers are coloured according to the ratio of water to nitrate in the aerosol and the little bars denote the variation in each data point. Brighter colours are when water strongly outweighs nitrate, which typically occurs at greater N2O5 uptake values, while darker values are when the nitrate influence is stronger and N2O5 uptake is reduced.
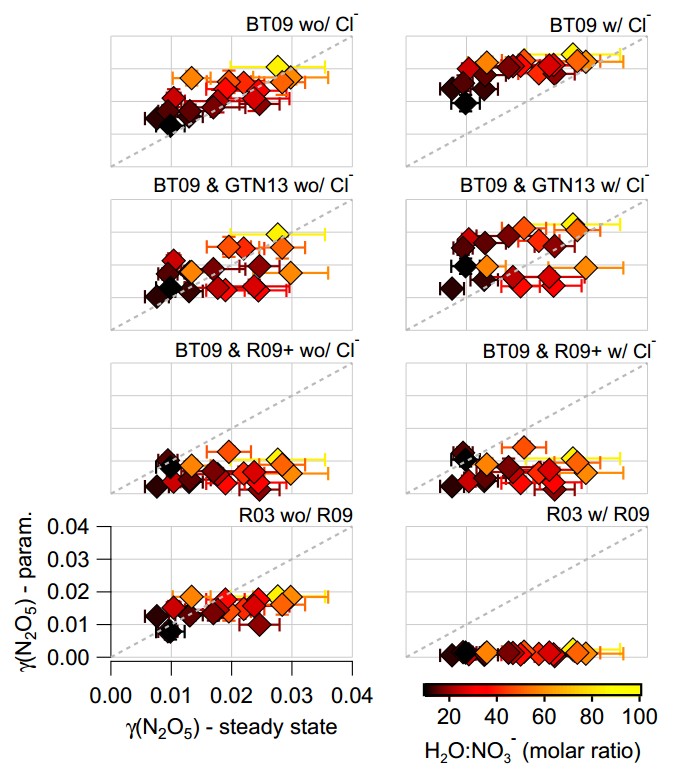
N2O5 uptake comparison.

Comparisons between various parameterisations of N2O5 uptake and measured values from the aircraft. For more details, see Figure 6 in the original paper.

On the whole, the parameterised values ranged from OK to terrible when we compared them with the measurements. I should point out here that the parameterised values are calculated using the measured aerosol particle properties (size and chemical composition), alongside measurements of temperature and relative humidity. There are various assumptions required to do the calculations, although these are effectively the same as those that would be used in an actual aerosol model.

You shook me all night long

If we truly understood the N2O5 uptake process, then we would expect very reasonable agreement between the parameterisations and the measurements. The parameterisations give very different answers, so this isn’t just a case of the parameterisations being in one corner and the measurements being in another.

Scientifically, this is troubling, as we think we understand many of the underlying processes in the laboratory but these do not appear to translate to the real world. It may be that the relatively simple aerosol particles that are tested in the lab, which typically only contain one or two chemical components under closely controlled conditions, are not representative of the much more complicated particles we measure in the real world.

The parameterisation that performs the ‘best’ is the one in the top left, which is based on the water-to-nitrate ratio only. This broadly captures the variation in the measurements and the values are similar. However, this is another troubling outcome as we know that this is incorrect based on previous evidence from laboratory and field studies. We know that other aerosol chemical components, particularly organic aerosol, should be playing a role here but this parameterisation ignores it. If we do include organic aerosol, the parameterised N2O5 uptake is strongly under-predicted compared with the measurements.

This is an example of being ‘right’ for the wrong reasons. Something is missing from our understanding of how this complex system behaves. We’re not the only group to have seen this, although I would say we’ve done the most thorough look at a range of different parameterisations and assumptions.

Unfortunately, this is one of those scientific papers that provides problems rather than solutions. My hunch is that we need to study the N2O5 uptake process using more complex aerosol particles, both in the lab and field, in order to figure out some of these issues.

How much all of this matters is a good question. The upshot of the paper is that we currently don’t have a particularly good grasp of this process, which might have ramifications for regional and global aerosol model studies. We’ve actually got a paper coming out soon looking at some of these issues at the regional level, so hopefully some of the answers aren’t too far away.

—————————————————————————————————————————————————————–

I would like to thank the RONOCO (ROle of Nighttime chemistry in controlling the Oxidising Capacity of the atmOsphere) project, which as well as being a terrible acronym, was a great team of people to work with. Many thanks to all of the folks associated with the BAe-146 research aircraft used during the project. Also, the Natural Environment Research Council (NERC) funded the work.

Header image: London, England at Night published on the NASA Marshall Flickr. The photograph was taken by astronaut Chris Hadfield on February 2, 2013 from the International Space Station. We flew around London on a couple of occasions during the project, which was a pretty cool sight during the night.

EGU 2014 Day 1: A day in the life of an aerosol particle

My first day at EGU 2014 in Vienna was principally spent listening to various speakers describe the life and death of tiny particles in the atmosphere, known as aerosols. These aerosol particles come from a variety of sources – one of the major sources is through burning of fossil fuels, which produces a cocktail of pollutants that form these particles. They can also arise from natural sources, such as bursting bubbles on the ocean surface, strong odours from trees and high winds whipping up sandstorms in the desert.

Pinning these sources down is tough but we also have to understand how they evolve in the atmosphere from their birth, their growth during their adolescent years and ultimately their adult years, where they can influence our climate and health. At some point, they are removed from the atmosphere where they become an ex-aerosol. Understanding these different changes is necessary if we are going to be able to understand their impact both in the past, present and future.

Baby steps

One of the major routes for an aerosol to be born is via ‘nucleation’ where the particles form tiny clusters, which are around 100,000 times smaller than the width of a human hair. These clusters form due to the combination of different gas phase molecules, which given the right cocktail and conditions, can condense to form these initial tiny particles. I’ve previously written about these early steps here.

There was work presented here at the EGU by Jasmin Tröstl from the Paul Scherrer Institute in Switzerland showing that chemical species known as oxidised organics take part in this initial process. The abstract for the work is available here.

For a long time, sulphuric acid was thought to be the vital ingredient for this nucleation process but recent work at a laboratory at CERN (known as the cleanest box in the world) has illustrated the importance of several other species. You can read more about two studies in Nature that were published in the past few years on these here and here. Oxidised organic species are abundant in the atmosphere, so it isn’t a huge surprise that they are important but it has only been through the development of the new laboratory at CERN and sophisticated new instrumentation that the importance of this key ingredient has been demonstrated.

The difficult years

The same study also illustrated that these oxidised organic species were vital for the growth of these nucleated particles. This is the key stage for such particles as they essentially either grow or suffer an early death. When they start out, they are too small to become cloud particles, which is their main route to impacting our climate. So without growing they will never know the wet embrace of a cloud droplet.

Not only did the oxidised organics strongly increase the growth of these particles but their addition was enough to reconcile the laboratory measurements with observations of the real world. This is an enlightening step as it has previously proven difficult to mix up the right cocktail to represent what really goes on in the atmosphere, which suggests a deficit in our knowledge of this important process.

All grown up

Once they reach adulthood, these particles become important from a human health and climate perspective. They can build-up in the atmosphere over a matter of hours or days and influence our lives.

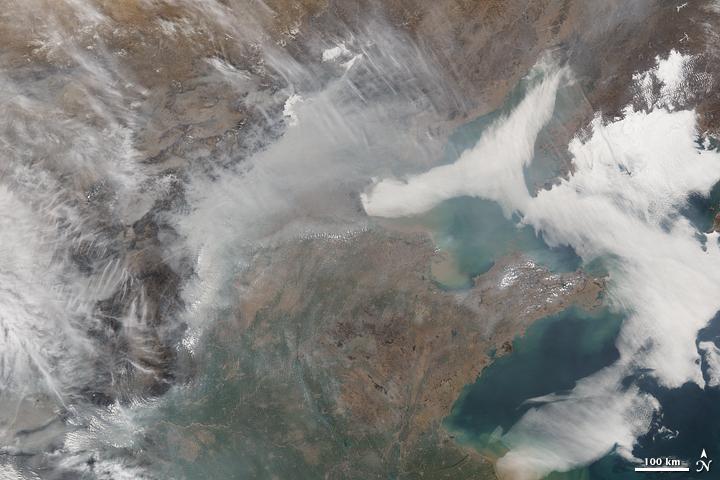
Rongrong Shen from Karlsruhe Institute of Technology, Germany, presented measurements of spring time pollution in Beijing during 2012, focusing on the chemical makeup of the pollution. Her abstract is available here. Beijing is well known as a hotspot for pollution, with over 20 million people living in the city and over 5 million vehicles on the road frequently creating a heavy chemical soup. The average concentration for PM2.5 (aerosol particles with a diameter less than 2.5µm) was 89µg/m3, which is far in excess of what is considered healthy. Even the ‘clear’ days in terms of visibility saw average concentrations of around 45µg/m. The World Health Organisation guidelines recommend the daily average values should remain below 25µg/m3, while annual values should be 10µg/m3 or lower.

Haze over Beijing and surrounding region from 22 March 2007. Image credit: NASA Earth Observatory

Haze over Beijing and surrounding region from 22 March 2007. Image credit: NASA Earth Observatory

More severe pollution episodes were typically driven by species such as sulphate and nitrate, which are known as ‘secondary’ species. This means that they start out as a gas and then condense onto pre-existing aerosol, such as nucleated particles or direct emissions from car exhausts and other forms of combustion. The results also indicated that such episodes were not solely driven by emissions within the city; the wider region played a role, including industrial sources and other Chinese cities. This is a common feature of pollution episodes in Western Europe also, which I wrote about recently here and here.

This is an ex-aerosol

Urs Baltensperger from the Paul Scherrer Institute, Switzerland gave the Vilhelm Bjerknes Medal Lecture and included a discussion of the fate of aerosols in the atmosphere. His abstract is available here. Aerosols are typically removed from the atmosphere via crashing into something, such as the ground, or by forming cloud droplets. These cloud droplets either evaporate, leaving an aerosol particle behind or they can grow to form rain, which removes the aerosol from the atmosphere. The rainfall can also washout other aerosols by catching them on the way down.

He referred to several previous studies, including measurements very early in the aerosol life cycle in an urban environment (Paris) and more mature aerosol at a high altitude site in the Swiss Alps at the Jungfraujoch.

The urban study illustrated that aerosol particles are quite diverse in this environment, which affects how readily they would form cloud droplets. Black carbon is known to be a poor candidate for making a cloud droplet, which the study showed. However, the results also illustrated that adding some other chemical components to the mix can vastly increase the likelihood of the particle joining the cloud droplet gang. This is important as the removal of black carbon from the atmosphere is poorly understood and can have significant implications when trying to predict its climate impact.

At the high altitude site at ‘the top of Europe’, the aerosol properties are more uniform. This makes it somewhat easier to predict how many particles will form a cloud droplet. This is an important result for models of aerosol impacts, as such a situation is more reflective of the scales that atmospheric models work in, particularly for climate change studies. This result is not true everywhere though, so as aerosol scientists we need to work towards understanding the differences across the globe, so that we can understand the ultimate fate of aerosol particles.

JFJ_Small

Image of the Swiss Alps during a research flight on the FAAM BAe-146 research aircraft. Photo credit: Will Morgan

That concludes this diary in the life of an aerosol particle; they have a hard and complex life, which often lasts just a few days or maybe weeks.

I’ll be back with more later this week.

—————————————————————————————————————————————————————–

Edit 03/05/14: Urs Baltensperger was originally spelt incorrectly.

Aerosols and the pause

There is a new commentary piece in Nature Geoscience by Gavin Schmidt and colleagues on ‘Reconciling warming trends’. The paper investigates several potential causes for the discrepancy between climate model projections and the recent ‘slowdown’ in global surface temperatures, which is nicely illustrated on Ed Hawkins’ Climate Lab Book blog.

One of the aspects the paper looks at is the influence of aerosol particles in the troposphere (the lower part of the atmosphere), which tend to exert a cooling influence on our climate. Of the aspects they looked at, aerosol particles are the most uncertain.

As I summarised in this previous post, the final report from the Intergovernmental Panel on Climate Change (IPCC) on the physical science basis concluded that aerosols was continue to dominate the uncertainty in the human influence on climate. They said that a complete understanding of past and future climate change requires a thorough assessment of aerosol-cloud-radiation interactions.

With this in mind, I want to delve into the details of how the chemical make-up of aerosol particles varies across the globe and how this is important for our climate and how this relates to the warming trends paper.

What are aerosols made of?

Aerosols are made up of a large variety of different chemical species, which vary by the time of day, seasonally, regionally and a host of other factors. There is no single type of aerosol in our atmosphere.

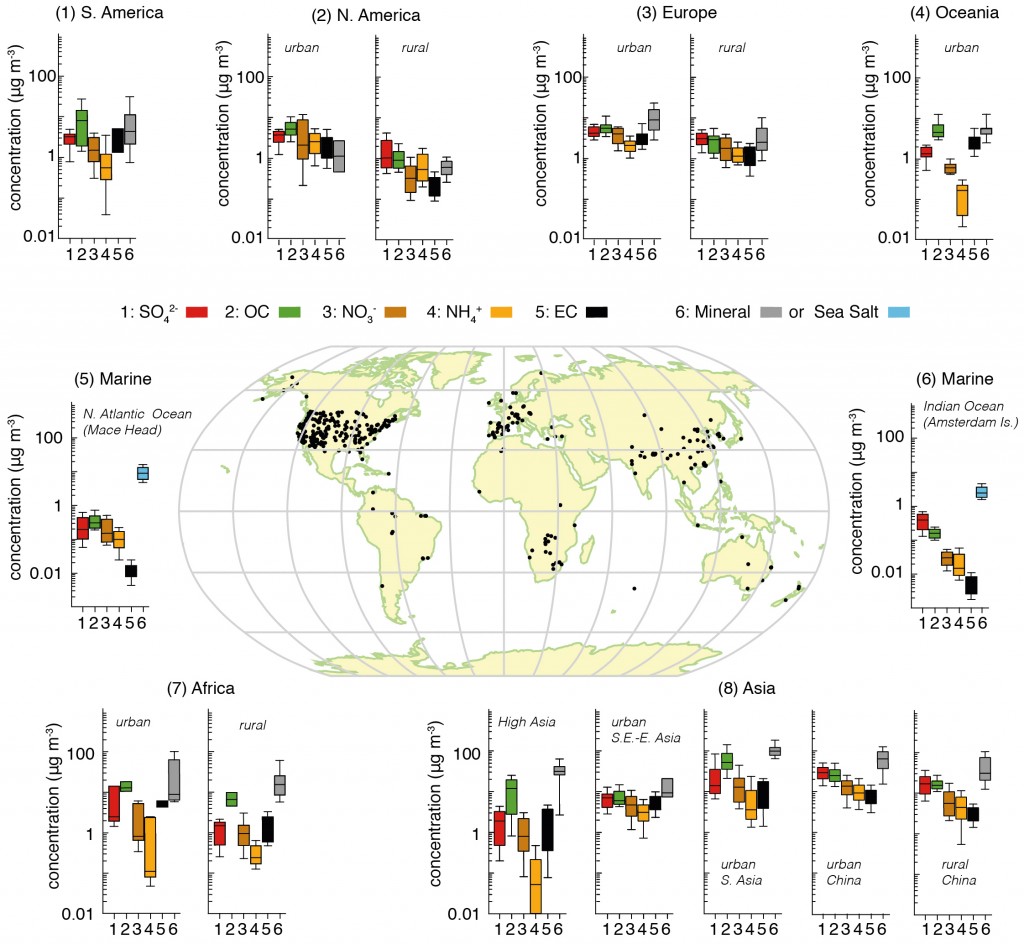
The figure below attempts to pull together a huge collection of studies that have been measuring the major aerosol chemical species in different regions of the globe. We can see on the map that many of the sites are in North America and Western Europe, where large coordinated surface networks have been making such measurements for decades. Measurements elsewhere are much more limited, particularly in the Southern Hemisphere.

This is one of the major difficulties in understanding aerosols; they are difficult to measure, the techniques used are typically quite labour intensive and they require access to well developed infrastructure and supporting measurements.

Fig7.13-Final-2

Summary of aerosol chemical species split across different regions based on surface measurements. The map shows the locations of the sites. For each area, the panels represent the median, the 25th to 75th percentiles (box), and the 10th to 90th percentiles (whiskers) for each aerosol component. The colour code for the measured components is shown in the key where SO4 refers to sulphate, OC is organic aerosol (strictly organic carbon), NO3 is nitrate, NH4 is ammonium, EC is black carbon (strictly elemental carbon), mineral refers to mineral dust e.g. from deserts and sea-salt refers to aerosols produced by ocean waves. The figure is 7.13 from the IPCC report, where the numerous references for the data are included. Click on the image for a larger view. Source: IPCC.

Bearing this in mind, we are able to draw some broad conclusions on their chemical make-up. We can see that in all of the non-marine regions, the aerosol is broadly made up of sulphate, organic carbon, nitrate, ammonium and black carbon, with the influence of mineral dust varying depending on location e.g. concentrations are much greater in locations such as Africa and Asia where large deserts exist.

Of these species, sulphate, nitrate, ammonium and black carbon are predominantly man-made in origin, while organic carbon can be a consequence of both natural and man-made emissions. We see that concentrations of organic carbon and nitrate are broadly equivalent to those of sulphate, with organic carbon being much greater in South America, Oceania, Africa and parts of Asia.

Where is the aerosol?

One of the key properties of aerosol particles in the troposphere is that they have a short lifetime, as they are removed from the atmosphere by rain or simply by crashing into things (terrible drivers those aerosol particles). This typically means that the largest concentrations occur near their sources; they are regionally very important in a climate context but their impact evens out at larger scales, although they do still exert a global influence.

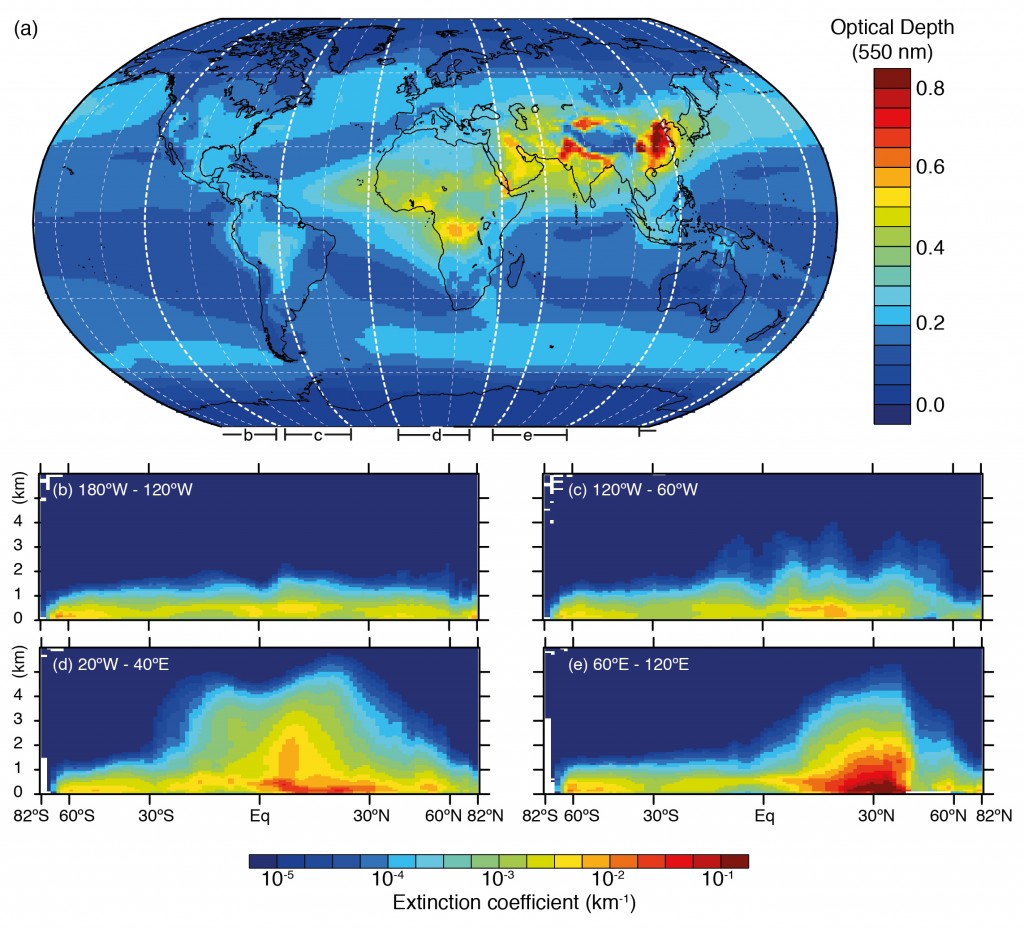
Below is an illustration of this based on satellite measurements combined with a forecast model system, which shows ‘hotspots’ of aerosol particles over China, India and Southern Africa in particular. The metric used here is the aerosol optical depth, which is a measure of the amount of aerosol present in a vertical slice through the atmosphere.

Horizontal and vertical distributions of aerosol amount based on a combination of the European Centre for Medium Range Weather Forecasts (ECMWF) Integrated Forecast System model with satellite measurements from the Moderate Resolution Imaging Spectrometer (MODIS) averaged over the period 2003–2010 and the Cloud–Aerosol Lidar with Orthogonal Polarization (CALIOP) instrument for the year 2010. The figure is 7.14 in the IPCC report and references for studies are available there. Click on the image for a larger view. Source: IPCC.

Comparing the two figures, we see that the enhanced aerosol optical depth in Asia is consistent with the large aerosol concentrations measured by the surface based networks. Of the man-made species, organic carbon is a big driver here, with nitrate, sulphate and ammonium also playing a major role. These aerosol particles are formed due to the substantial emissions from the region.

What about the pause?

Of these species, sulphate and black carbon are the major species that climate models have historically focussed on. Organic carbon is generally included, although there are large discrepancies in relation to measurements, particularly related to the secondary organic aerosol component. Nitrate has received comparatively little attention and those that have included it have shown that it is an important aerosol species both today and over the 21st Century. Drew Shindell and colleagues when comparing aerosol optical depth from satellite measurements and climate models concluded that:

A portion of the negative bias in many models is due to missing nitrate and secondary organic aerosol.

I’ve been involved in research showing how nitrate is important in North-Western Europe and how it enhances the aerosol radiative forcing in the region (many others have done so also by the way). Nitrate has long been known to be important in North America, particularly in California, where large urban and agricultural emissions coincide. Several studies have investigated its importance in East Asia, showing that it is particularly prevalent during the winter.

The ‘Reconciling warming trends’ commentary notes that nitrate was only included in two of the models that contributed to the Coupled Model Intercomparison Project (CMIP5) and that including this across all models brings them closer to the observed surface temperature trend. They also note that underestimating the secondary organic aerosol contribution would have a similar effect but don’t put a value on this.

While this certainly isn’t the last word on the importance of these species for climate change and research on the ‘pause’ will undoubtedly continue, further recognition of their contribution to atmospheric aerosol is a step in the right direction. There are many unanswered questions in this realm, particularly relating to the large differences across climate models in terms of what contribution each species makes to regional and global aerosol.

Bringing the aerosol measurement and modelling communities together more to address such issues is likely the way forward. This is a big focus in many aerosol related research projects these days…we’re trying, honest.