EGU Blogs

IPCC

What did the IPCC say about aerosols?

Aerosols dominate the uncertainty in the total anthropogenic radiative forcing. A complete understanding of past and future climate change requires a thorough assessment of aerosol-cloud-radiation interactions.

This is one of the conclusions about aerosols and their impact on our climate from the the final report from the Intergovernmental Panel on Climate Change (IPCC) on the physical science basis that was released recently. What brought them to this conclusion and what does it mean? In this piece, I’ll go through the headline statements and findings.

The IPCC are concerned with assessing how various factors affect the Earth’s climate and it dedicates an entire chapter to aerosols and clouds, which is accessible here.

How do aerosols impact our climate?

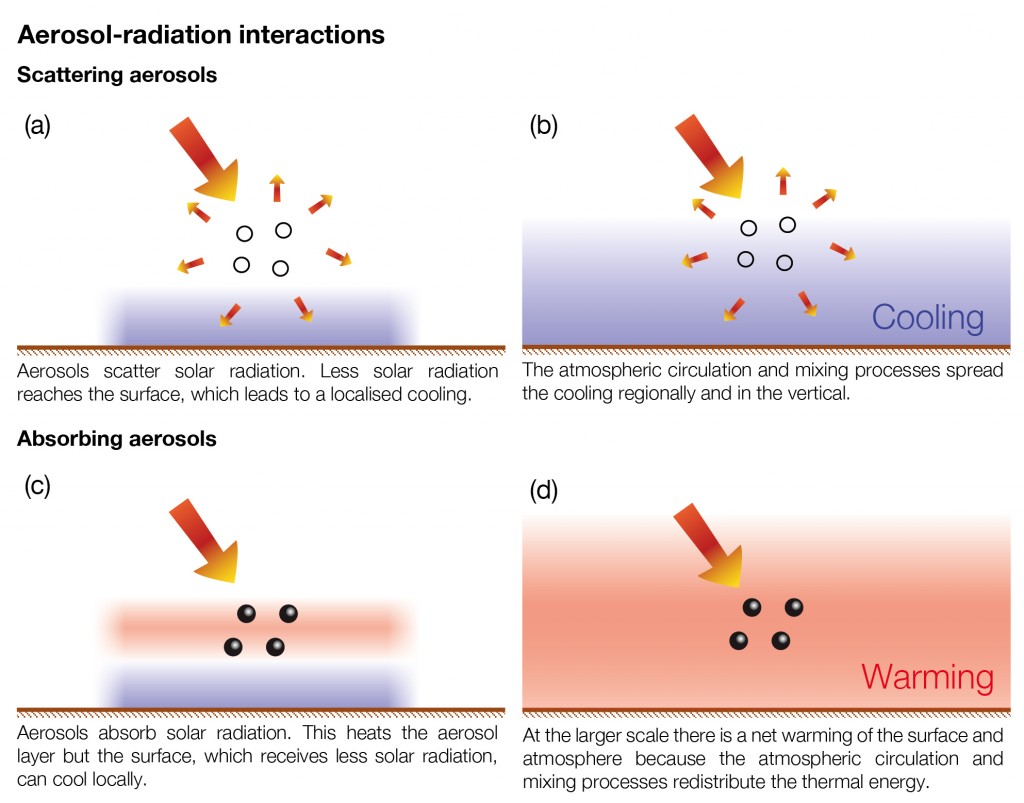
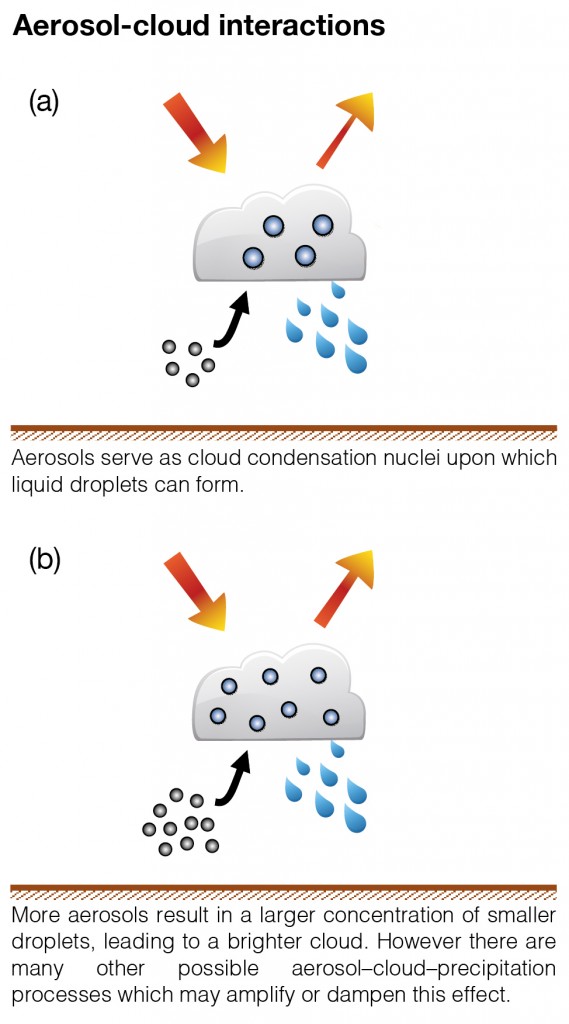
Aerosols, can broadly influence the climate in two ways; aerosol-radiation interactions and aerosol-cloud interactions. The IPCC included some nice diagrams of how these processes occur, which I’ve included below.
Blah.

Illustration of aerosol-radiation interactions produced by the IPCC. This figure and more are available here.
Blah.

Illustration of aerosol-cloud interactions produced by the IPCC.

Both of these interactions are well established but the problem is pinning down the magnitude of these effects at larger scales and over time.

Headline numbers

The IPCC often refer to a term known as radiative forcing when assessing climate impacts. This illustrates the change in the amount of incoming versus outgoing radiation to our atmosphere. This regulates global temperatures and can affect things like circulation patterns and precipitation. Positive radiative forcing values increase temperature, while negative values reduce them. This value is usually referenced back to before the Industrial Revolution (typically 1750), when human influences on the composition of the atmosphere were more limited.

To put this in some context, the radiative forcing for carbon dioxide is 1.82 W/m2, with a reported range from 1.63 to 2.01 W/m2. What this means is that since 1750, adding carbon dioxide to our air has altered the radiation balance of the atmosphere and that this will cause a warming in the absence of any cooling factors.

In the table below, I’ve collated the various estimates for the aerosol influence from the report. As well as the central estimate, it is important to examine the range as this is one of the crucial aspects that drives the statements about our uncertain understanding of aerosols. The central estimates and the forcing range all suggest that aerosols exert a cooling influence on our climate; aerosols offset some of the warming influence from carbon dioxide and other greenhouse gases. If we first focus on the IPCC 2007 and 2013 values, we see that the central estimate has for the latest report (AR5)  indicates that aerosols are exerting less of a cooling effect than estimated previously. The range of the forcing estimate has also reduced.

The IPCC is effectively saying that the cooling influence from aerosols is slightly weaker than previously estimated and that our understanding has improved.

Blah.

Aerosol radiative forcing estimates.

The other values refer to different ways of calculating the impact and it is these numbers that inform the overall value in the report. The satellite based value refers to studies where satellite measurements of aerosol properties are used in conjunction with climate models; they are not wholly measurement based. In terms of studies using climate models on their own, the IPCC used a subset of climate models for their radiative forcing assessment, choosing those that had a “more complete and consistent treatment of aerosol-cloud interactions”.

The satellite based central value of -0.85 W/m2 is less negative than the central value from the climate models, which means the models indicate more cooling than the satellite based estimate. Compared to the subset of climate models that the IPCC used for their radiative forcing judgement, there is little overlap between their ranges also.

Why so uncertain?

This lack of agreement is a big driver for the large uncertainty range. It’s important to stress that there isn’t a strong reason to “trust” one set of results over another here as both satellite observations of aerosol properties and their representation in climate models are prone to many biases and it isn’t currently clear how these will impact the results.

Both methods are very sensitive to the assumed pre-industrial conditions assumed by the studies. Both methods have difficulties dealing with clouds but for different reasons.

Satellites can’t typically see through clouds, so they can miss aerosol trapped below them. Another major challenge is when layers of aerosol exist above clouds, which can affect the satellite measurements. Satellites are best suited to measuring the total amount of aerosol in the atmosphere. They have difficulty identifying different aerosol types, which means they can lump together natural and anthropogenic aerosols. They also have difficulty determining the relative importance of scattering or absorbing aerosols, which will determine the climate impact. Typically they can’t determine where the aerosol is in the vertical dimension of the atmosphere, which again will influence the climate impact. There are certainly advances in these areas but as ever, more work is required.

Models on the other hand, have difficulty representing aerosol-cloud interactions due to cloud systems typically being smaller than the resolution of a climate model, the complex number of processes at play and the lack of real-world measurements to test them. There is some evidence to suggest that climate models at the global scale tend to overestimate the size of the aerosol effect on cloud properties.

If we examine more details from the climate models, we see that there are large differences between models in terms of what types of aerosol it considers to be important. For example some models say that dust is a major contributor to the global aerosol burden, while others disagree. These are important details as climate models can sometimes broadly agree in terms of the radiative forcing estimate they provide but for very different reasons. Black carbon is another species that can contribute to varying degrees in different models, which is important as it warms the atmosphere; how a model represents black carbon is going to have a strong influence on the reported cooling. Nitrate is a potentially important species that often isn’t even included in climate models.

To summarise: it’s complicated.

What does this mean for climate change?

The short answer is: probably not a lot.

The change from the previous report is overall quite small (0.3 W/m2) and this is predominantly a result of improvements in our ability to represent aerosol processes (particularly clouds) since the last report. To put the change in context, between 2005 and 2011, the radiative forcing by greenhouse gases increased by 0.2 W/m2 due to increased concentrations in our atmosphere alone. At present, the uncertainties in aerosol radiative forcing mean that making definitive statements are likely unwise and putting faith in any one particular result will be fraught with difficulties. Focussing on the global scale also ignores the much larger regional impacts that aerosols can have, which is of more relevance to the wider issue.

The current state of understanding of aerosols suggests that they’ve exerted a cooling influence on our climate, which has offset some of the warming expected from the increase in greenhouse gases in our atmosphere. Improving this understanding will be crucial for assessing both past and future climate change.

AGU 2013 roundup

Now that the 2013 AGU Fall Meeting has ended, I thought I would roundup what I’ve been involved with over the week for both this blog and the Barometer Podcast, which I was recording each day with Sam Illingworth. Links to each piece are available below. Many thanks to all who have read and shared these over the past week.

Recording the podcast at conferences is becoming a trend as we’ve covered AGU now in 2012 and 2013 plus the EGU in 2013. Recording these is a lot of fun and particular thanks should go to Dave ToppingBethan Davies and Mark Brandon for giving up their time to chat to us this week. Lastly, many thanks to Sam for his infectious enthusiasm and for being the only person I’ve ever met with a louder laugh than me.

The conference itself was excellent throughout, even if the amount of science on offer was overwhelming at times. The sessions on science communication I attended were also fantastic, thought-provoking and often inspiring. I’m planning to write a separate post on this aspect over the coming days.

So long San Francisco! Image: Will Morgan

So long AGU 2013 and thanks for all the science! Image: Will Morgan

Blog posts

Podcasts

Click here to display content from thebarometer.podbean.com

Click here to display content from thebarometer.podbean.com

Click here to display content from thebarometer.podbean.com

Click here to display content from thebarometer.podbean.com

Click here to display content from thebarometer.podbean.com

AGU 2013 day 2: aerosol emissions, climate & the IPCC

My second day at the AGU 2013 Fall Meeting revolved around more short-lived climate forcers, which I wrote about yesterday and also a broader session on the results from the recent IPCC Working Group 1 report. The latter was an opportunity for the community to quiz some of the lead authors of the report on a variety of issues including observations of the climate system, aerosol and clouds (yippee!), carbon cycle feedbacks, sea level rise and future changes.

Oliver Boucher gave a very nice overview of the aerosol and clouds chapter that he was a coordinating lead author for. I suspect it was a condensed version of the presentation he gave at the “Next steps in climate science“ meeting at the Royal Society, which I summarised here previously.

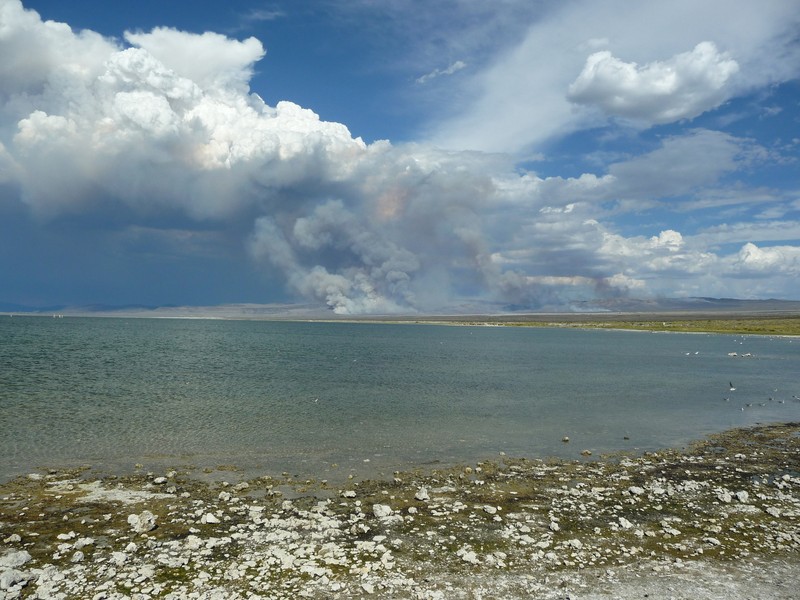
Desert fires feeding a convective cloud system over Mono Lake, California. Image from EGU Imaggeo image repository and is provided by Gabriele Stiller.

Smoke aerosol feeding a convective cloud system over Mono Lake, California. Image from EGU Imaggeo image repository and is provided by Gabriele Stiller.

One of the key messages for me was his conclusion that there has been substantial improvements in our understanding of aerosol and cloud processes since the previous IPCC report in 2007 but that this ‘knowledge’ hasn’t quite made its way into current global climate models. As someone who works on understanding aerosol processes from observations of the ambient atmosphere, this is something I very much agree with!  The implication here is that aerosol uncertainty will reduce in the future as this knowledge is translated to future climate models. We can but hope.

Some of the other key points from his talk included:

  1. Confidence in satellite based global average aerosol optical depth trends is low.
  2. Black carbon dominates uncertainty in aerosol radiative forcing.
  3. Many gaps in understanding including absorption by black carbon, trends and circulation changes due to aerosol forcing.
  4. Low level clouds are the “joker in the pack” of cloud feedbacks as they are the least understood area for clouds.

Still plenty of work to do!

Emission reductions

The short-lived climate forcers session in the afternoon included a very nice study of how emission regulations in California have affected air pollutant emissions, including black carbon. Tom Kirchstetter presented measurements of trucks using the Oakland port just across the bay from the AGU venue in San Francisco. The neat thing about the study was that this was done over several years both before the regulations were in place and afterwards. The regulations required diesel particle filters to be installed in new trucks, while old trucks had to be retro-fitted with them.

These new regulations have seen an 80% decrease in black carbon emissions over 4 years. The reduction is about 5-times faster than ‘natural’ fleet turnover, which occurs more gradually as new vehicles with improved engines replace older models. The new rules apply to 10,000-20,000 vehicles and will likely significantly improve air quality in the area. Further regulation will soon come into force for 1 million buses and trucks, which could have profound impacts on black carbon emissions in California.

This will likely be an interesting area to keep an eye on in terms of the wider potential impacts on air quality and climate.

AGU 2013 day 1: Short-lived climate forcers

My first day at AGU 2013 revolved around sessions on short-live climate forcers, which are components in the atmosphere that have short lifetimes (compared to carbon dioxide for example) and generally warm the atmosphere. Reduction of these compounds, such as methane and black carbon, has been mooted as a way to reduce global mean temperatures in coming decades.

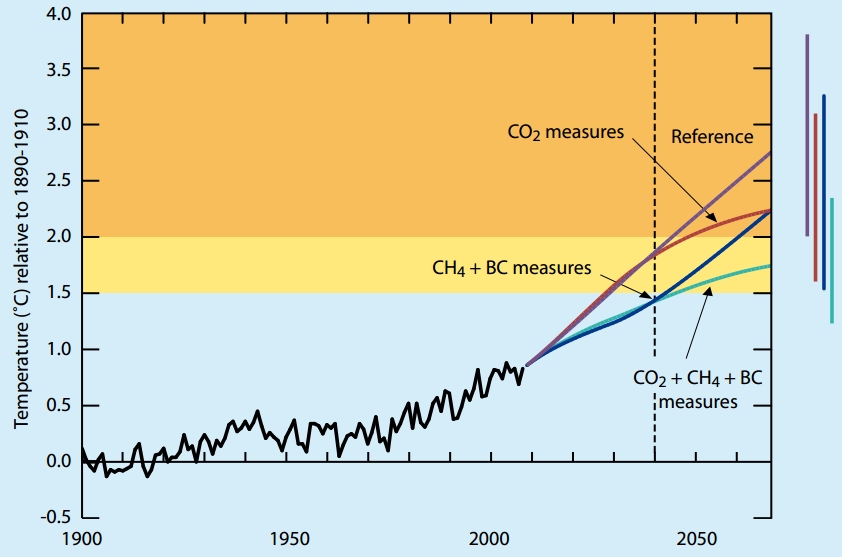
This is summarised in the figure below, where the modelled impact of reducing black carbon and methane alongside reductions in carbon dioxide emissions are shown. The majority of the benefit in reducing methane and black carbon is felt by 2040 – if you look at longer time scales, then the effect diminishes relative to carbon dioxide.

image

Modelled impact of various reductions in carbon dioxide, methane and black carbon (BC) on global mean temperature. Figure courtesy of UNEP Integrated Assessment of Black Carbon and Tropospheric Ozone.

The problem with this idea is that there is much uncertainty related to these short-lived components, so it isn’t clear how much global temperatures would respond to a reduction in their atmospheric concentrations. This is represented in the above figure by the vertical bars to the left of the graph – there is much overlap here, which reflects this uncertainty. The health benefits of reducing black carbon in particular are quite clear though. Most of the talks focussed on black carbon and that is what I am also going to focus on below.

Fuzzy metrics

Tami Bond made some excellent and thought-provoking points on how short-lived climate forcers are framed relative to carbon dioxide. The key property for black carbon in the framework of near-term reductions in global temperature is its short lifetime in the atmosphere (days-to-weeks). This means that it is not evenly distributed across the globe, unlike greenhouse gases such as carbon dioxide and methane. This results in its radiative forcing being spatially distinct – the perturbation it has on our planets energy balance occurs close to its source of emission. The impact of such changes is usually felt more at the regional level, rather than the global scale associated with carbon dioxide. Her main point was that this is then an apples-to-oranges comparison, so for example, reducing black carbon emissions in Asia might not have a great impact of global mean surface temperatures but it may well reduce temperatures in the region and slow the effects of carbon dioxide driven warming.

She also reiterated the difficulties associated with the pollutants that are co-emitted with black carbon, which complicate the picture and are one of the major reasons that there is substantial uncertainty surrounding reducing black carbon. In the real world, you can’t really just reduce black carbon – any technological  solution will likely perturb the other pollutants, which tend to cool our climate. Attempts to reduce black carbon might actually result in temperatures rising – I’ve written more on studies that have considered this here.

Other highlights

Yi Deng presented a fascinating study of how aerosol particles can influence the atmosphere far away from their actual location by modelling the impact of biomass burning in Southern Africa on the Asian Summer Monsoon. He showed that the substantial burning that occurs actually strengthens the monsoon by inducing circulation changes up-wind of the Indian sub-continent and south-east Asia. We tend to think of aerosol impacts being confined to their atmospheric location but this illustrated how joined-up our atmosphere is.

One of the issues with black carbon is that some sources have received little attention previously. Ed Fortner from Aerodyne Research Inc. presented measurements of emissions from brick kilns in Mexico, which produce a lot of black carbon. There are around 300,000 kilns worldwide producing 1.5 billion bricks per year! Over half of these are in China (54%), with India (11%), Pakistan (8%) and Mexico (7%)  being the other major kiln hotspots. Characterising the emissions from these and other sources is likely going to be in important for efforts to constrain the impact of black carbon on both our climate and health.

Chris Cappa presented follow-up work to his 2012 paper in Science that investigated how much warming by black carbon is enhanced by other aerosol species that coat it. Black carbon warms the atmosphere by absorbing sunlight and both laboratory and theoretical evidence suggests that this is increased by coatings on the black carbon particles. This coating focusses sunlight onto the black carbon core, like a magnifying glass held to the sun does and this increases the absorption by the black carbon, a phenomenon known as “lensing”. Chris has been busy testing how much enhancement we see in the real world using measurements and typically to enhancement ranges from 10-30%, which is lower than is often suggested by aerosol models. There are significant caveats here as the measurements are challenging and require the aerosols to be “dry” – this is important as water often condenses onto aerosol particles and increases their reflective and lensing ability. This could be a vital ingredient in this process and it is a significant challenge to overcome.

My final highlight was presenting my poster! The AGU poster hall is absolutely massive and must span several football pitches. Despite this, the sessions are hugely rewarding and are a great opportunity to discuss science with a variety of people. The posters are a major part of the AGU fall meeting, which is not always true of other conferences. I’m looking forward to roaming the hall now that my own poster is done.

Me presenting my poster on day 1 of AGU 2013. Image courtesy of Sam Illingworth.

Me presenting my poster on day 1 of AGU 2013. Image courtesy of Sam Illingworth.

Communicating uncertainty

With all this complexity revolving around black carbon and the interest it has received from policy makers, Tami Bond was asked how to communicate this to non-scientists. Her response was:

Keep it simple but don’t ignore physical reality.

That seems like a pretty good mantra to me.