EGU Blogs

Biomass burning

A continent on fire

While preparing my poster for the upcoming AGU Fall Meeting, I downloaded some data on fire activity in South America for background on why we are interested in biomass burning in the region. I wanted to quickly check I had the data in the correct format, so I just plotted the coordinates of the fire counts without an outline of South America.

I was surprised to see that the fire locations for August-October 2012 did a great job of outlining South America on their own!

Fire map.

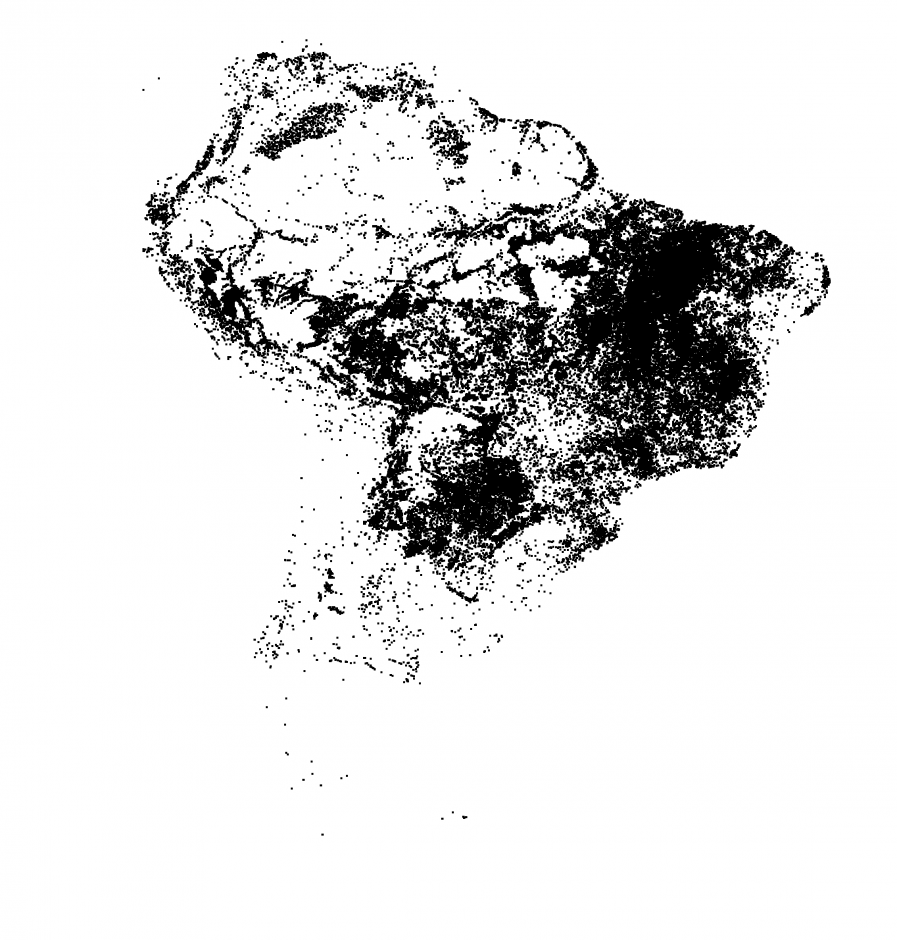
Map of fire locations during August-October 2012 in South America from MODIS data from the Terra and Aqua satellites provided by NASA’s Earth Observing System Data and Information System (EOSDIS).

The data is from the MODIS instrument on NASA’s Terra and Aqua satellites. The data reports fire locations based on measuring  the emission of infrared radiation by the land surface from space (like the infrared cameras on your favourite police chase tv show).  Any 1km pixel with a fire detected within it is then included in the data – there could be more than one fire within the pixel but the instrument can’t distinguish these. You can find out more information about the technique here.

The widespread nature of the burning across South America is striking. Huge areas of the continent have fires detected within them. This is an annual endeavour with many of the fires started by people for land use change and agriculture. The main “season” runs from August to October, with the peak usually in September. These fires have been occurring for several decades now and they have transformed vast swathes of South America.

The burning produces large amounts of smoke, which can build up and pollute our atmosphere. This has important consequences for regional and global climate, air quality and also ecosystem development. I’m part of a project called SAMBBA, which as well as being a great acronym, is attempting to address some of the aspects of biomass burning that we don’t understand (which is a long list). I’ve written about the project and my part in it here and here previously.

As the map above illustrates, it is quite a big deal in the region. Stay tuned for future updates on the project.

Spoiling the view

Probably the most obvious manifestation of air pollution comes when looking out of the window and scanning the horizon – does the landscape go on for miles or is the view reduced? The build-up of air pollution can often dramatically reduce visibility via a shroud of haze.

On a recent trip to the Turkish Mediterranean coast near Antalya, the impact of air pollution on visibility was abundantly apparent. Below are two photographs I took of the view.

View of

View of the Beydağları Mountains in Antalya Province, Turkey. The top image is from the morning of 11th November 2013, while the bottom image is at sunset on the 12th November 2013. Photographs by Will Morgan (me).

The photographs look out to the west from the hotel I was staying in. In the top picture, there is little to see aside from a few tall buildings just observable beyond the trees in the foreground. In the bottom image though, the Beydağları Mountains can be seen, although the view is still hazy. The mountains were approximately 20 miles (32 km) away, so to not be able to see the mountains at all in the top picture requires a large amount of haze. During the ten day trip, views like the top image were far more common.

Antalya province is surrounded by the Taurus Mountains, with the Mediterranean sea to the south, so it forms a bowl-like basin where air pollution can build. It is also very sunny, which gives atmospheric chemistry an extra kick to form air pollution. This cocktail is similar to other pollution hotspots such as Mexico  City and Los Angeles.

The other key feature is that temperature inversions are common in Antalya. Typically, the temperature cools in the lowest part of the atmosphere with height but these inversions see a reversal of this trend within the first few hundred metres, which prevents air rising and mixing efficiently. You end up with a basin with a lid on it, so when pollutants are emitted into this, they find it difficult to disperse. This is like mixing a squash or cordial with water and only filling the glass half way with water – the amount of cordial (pollutant emissions) remains fixed but the reduced water level (temperature inversion) sees the concentration rise. Below is a video of a demonstration of temperature inversions, which actually refers to air pollution in Denver.

Click here to display content from YouTube.
Learn more in YouTube’s privacy policy.

The apparent major source of air pollution in Antalya is the burning of low-quality coal and domestic wood burning, which is particularly prevalent during the winter. I also noticed small fires from agricultural and trash burning during my stay. Summer temperatures typically exceed 30°C, so air conditioning is common rather than central heating systems. Evening and overnight temperatures during the winter drop below 10°C, so some form of heating is required.

The impact of air pollution on visibility is clear in the region and the health implications are also known, with Doctors warning about the risk from air pollution. Just this week, there were news reports warning that Antalya would experience poor air quality this winter.

Tackling the challenge is not easy though, especially given that the geographical and meteorological conditions in the region can’t be controlled. Antalya illustrates the interplay between these natural factors and our own role in pollutant emissions, which presents particular difficulties when trying to improve air quality. This interplay is prevalent across the globe.

Biomass burning birthday

Last September I spent a month in Brazil for a research project aiming to study the pollution produced by deforestation fires in the Amazon Basin. The fires are mainly started by people for agricultural needs or land clearing for buildings and infrastructure. These fires produce huge amounts of smoke that blanket vast regions of South America during the “dry” season, which can lead to significant affects on weather, climate and people’s health. The name of the project was SAMBBA (South American Biomass Burning Analysis) and I’ve written a little about it previously here. There are several aspects to the project but my major role was on board the Facility for Airborne Atmospheric Measurement’s BAe-146 research aircraft. I was a mission scientist, which basically means I get to tell the pilots where to fly (subject to standard aircraft operating procedures like avoiding mountains, severe storms and not running out of fuel).

The Amazon usually conjures up images of pristine rainforest and giant meandering rivers but in the quest for air pollution, we were based in Porto Velho, which is the capital of Rondonia – a global poster-child for deforestation. Recently, a project involving Google, the U.S. Geological Survey (USGS), NASA and Time published an extraordinary series of satellite images from the Landsat program showing how the surface of the Earth has changed since the program began in 1984. One of the areas highlighted was Rondonia and the images showed how dramatically the landscape has changed over several decades. While deforestation began there in the 1970’s, the changes detailed in the images from Landsat are clear to see and are shown below. In 1984, the typical ‘fish-bone’ pattern of deforestation is already evident as pathways into the Amazon rainforest are cleared and tributaries of fire branch out from these. By 2012, the deforestation has spread out to envelop large swathes of areas that were previously rainforest.

Comparison of deforestation of part of the Amazon rainforest in Rondonia state, Brazil from 1984 and 2012. The area pictured is to the south and south-east of Ji Parana and covers an area of approximately 60 x 120 miles. Images are from Google. An interactive version where you can expand the view and also visit other areas of the globe is available here, which is worth doing as it gives a feel for the scale over which the deforestation occurs.

This tweet by the EGU twitter account reminded me that it is a whole year since one of our most successful flights of the campaign, which took place in Rondonia. The image below shows the view of the fire we flew through from a satellite, with the smoke plume extending over 80km downwind and also a side-on view of the fire that I took from the aircraft. The fire was to the south-west of Porto Velho in a protected area, where you wouldn’t usually expect to see fires. After travelling to the home of deforestation in Brazil, the largest fire we found was actually a wildfire!

Satellite (top) and side-on view taken from Bae-146 research aircraft (bottom) of a large fire plume that was sampled in Rondonia on 20th September 2012 during SAMBBA. The red line overlayed on the satellite image is 80km long, with the fire plume visible to the left of the line. The satellite image is from NASA’s Terra mission.

The key thing we were trying to investigate during the flight was how the properties of the smoke plume changed as it blew downwind. This is the crucial intermediate step between the actual initial conditions on the ground where the fire starts and the regional build up of smoke haze that affects weather and climate. To do this, we performed a series of flight patterns including:

  1. Flying across the plume at regular intervals along the length of the plume e.g. above the fire, 20km from the fire, 40km from the fire etc.
  2. Flying directly up the length of plume, which is a particular challenge for the pilots as the plume doesn’t generally follow a straight line and you can’t actually see anything.

With these measurements, we can can compare how the properties of the smoke change with distance from the fire. We can combine this information with measurements just a few hundred metres above the fire, as well as flights in older regional pollution to understand the entire life cycle of fires in this region and compare it with other types of fire in various areas of the globe.

We’ve been working hard over the past year analysing the data from this flight and all of the other SAMBBA flights and hopefully there will be much more of the actual science story to tell on this over the next 12 months and more. Stay tuned.

Smoky summers

The past summer has seen a great deal of media coverage of fires burning across the globe. When I consider what to write about for the blog, it has often been difficult to avoid commenting on yet another instance of a fire burning somewhere. This has been especially difficult given my current research project investigates biomass burning aerosol from deforestation and agricultural fires in Brazil. Fire and smoke is often dangerous and can have devastating consequences, however, the imagery available via satellites, scientific missions and the media is often breathtaking and they are fascinating for someone who thinks a lot about how these things evolve.

The huge number of man-made fires on the Indonesian island of Sumatra earlier this summer highlighted the impact of fires on air quality and human health, as vast plumes of smoke shrouded Singapore in a thick record-breaking haze. Another batch of fires were burning there in the August 22-27 period, although the wind conditions were more favourable for Singapore on this occasion. Europe has also had its share of fires, with Portugal being particularly affected in late August by wildfires and Russia saw extensive man-made agricultural fires in the Spring. South Wales has also seen several grass fires, including the Glyncorrwg fire in June, which I wrote about here. Australia is the latest region to hit the headlines, with the fire season igniting early around Sydney. South America and Southern Africa have also seen numerous fires that vastly outnumber those currently burning in the USA and Europe. I’m planning to write a separate post on these in due course.

Fire in the Taco Bell

The region that has garnered the most media attention is the USA, where numerous wild fires have burnt their way through many areas, furthering concerns around fire management and potential links with climate change. I’ve written previously about the impact of wild fires on Rocky Mountain National Park, which I saw first hand in July. The latest major event is the Rim Fire in the Sierra Nevada, which is currently 80% contained and is at present the largest fire in the 2013 season. The scale and impact of the fire has led to some incredible imagery of the fire and the extensive smoke plume emanating from it. The progression of the fire through a sequence of night-time images put together by the NASA Earth Observatory is quite incredible.

Blah.

Image of the Rim Fire and the plume of smoke produced by it from 31st August 2013 from the Moderate Resolution Imaging Spectroradiometer (MODIS) instrument on the AQUA satellite. Image courtesy of the NASA Earth Observatory. Click on the image for a larger view.

One of the things that struck me when reading about the recent erroneous reporting of an ‘Indian Summer’ in the UK was the association of the term with smoky or hazy conditions in the USA. Apparently, the earliest known usage of the term dates to the 18th Century and the link with Native Americans may also have been directly related to the benefits of the hunting season occurring during such a hazy period. The potential major cause for such haziness, bearing in mind this is prior to large scale industrial combustion, may very well have been smoke from fires. This would fit in with the natural wildfire season in the USA or man-made burning to create/accentuate any hazy conditions by the Native Americans themselves. Fires have been with us throughout history, with some impressive research illustrating how the numbers of fires has changed over millennial time scales e.g. this paper by Tom Swetnam, which is covered by Science Daily here.

Intervention

The fires in the USA have led to several pieces on the role of wildfires in these environments, with scientists and journalists highlighting the potential ecological benefits of the Rim Fire in particular. Wildfires are not a new phenomenon, although there are concerns that there are a greater number of the large, intense fires like the Rim Fire, rather than a collection of smaller fires. This was noted in this piece by Brandon Keim for Wired:

Fire is a natural, inevitable phenomenon, and one to which western North American ecologies are well-adapted, and even require to sustain themselves. The new fires, though, fuelled by drought, a warming climate and forest mismanagement — in particular the buildup of small trees and shrubs caused by decades of fire suppression — may reach sizes and intensities too severe for existing ecosystems to withstand.

What is clear is that wildfires are a natural part of our landscape but there are genuine concerns about how human activities are changing their intensity and frequency.

The dual nature of fires in the Earth system is probably best summed up in this piece by John Fleck, where he interviews Tom Swetnam:

“Is fire good? Is fire bad?” Swetnam asked. “Yes. Both.”