EGU Blogs

Photo of the Week

Geology Photo of the Week #47

This week’s photo is another mineralogy themed one. This photo shows beautiful, yet also flattened crystals of the mineral natrolite that has grown in an acicular habit from a central point making them look sort of like little snowflakes. Natrolite is a relatively common hydrated sodium, aluminum silicate mineral (Na2Al2Si3O10 · 2H2O) that often forms within the void spaces of igneous rocks such as amygdular basalt. In this instance it looks like natrolite has formed along a fracture plane due to its flattened appearance suggesting the only room it had to grow was outward as opposed to up, which is why it has made these “snowflake” shapes.

Crystals of natrolite along a vein in urtite (foidolite) by Dmitry Zhirov

Crystals of natrolite along a vein in urtite (foidolite) by Dmitry Zhirov

Geology Photo of the Week #46

This week’s photo brings us back to the world of geochemistry. I don’t have much information on this photo beyond that it was taken in Italy.  However, if I may speculate a little it looks like these crystals may possibly be volcanic in origin and the fact that it was taken in Italy, which is famous for its volcanic sulphur deposits. I say this because such crystals are often found near active volcanoes and form from the degassing of sulphur dioxide (SO2) and hydrogen sulphide (H2S) gas from vents known as fumaroles. Groundwater dissolves gases and mineral rich in sulphur at high temperatures however, once the water reaches the low pressure atmosphere of the Earth’s surface these gases are released from the water and native sulphur precipitates.

Close-up of sulphur crystals with condensation drop by Ulrich Kueppers

Close-up of sulphur crystals with condensation drop by Ulrich Kueppers. Source

Geology Photo of the Week #45

This weeks photo is once again related to permafrost and the Arctic….something tells me I miss being there.

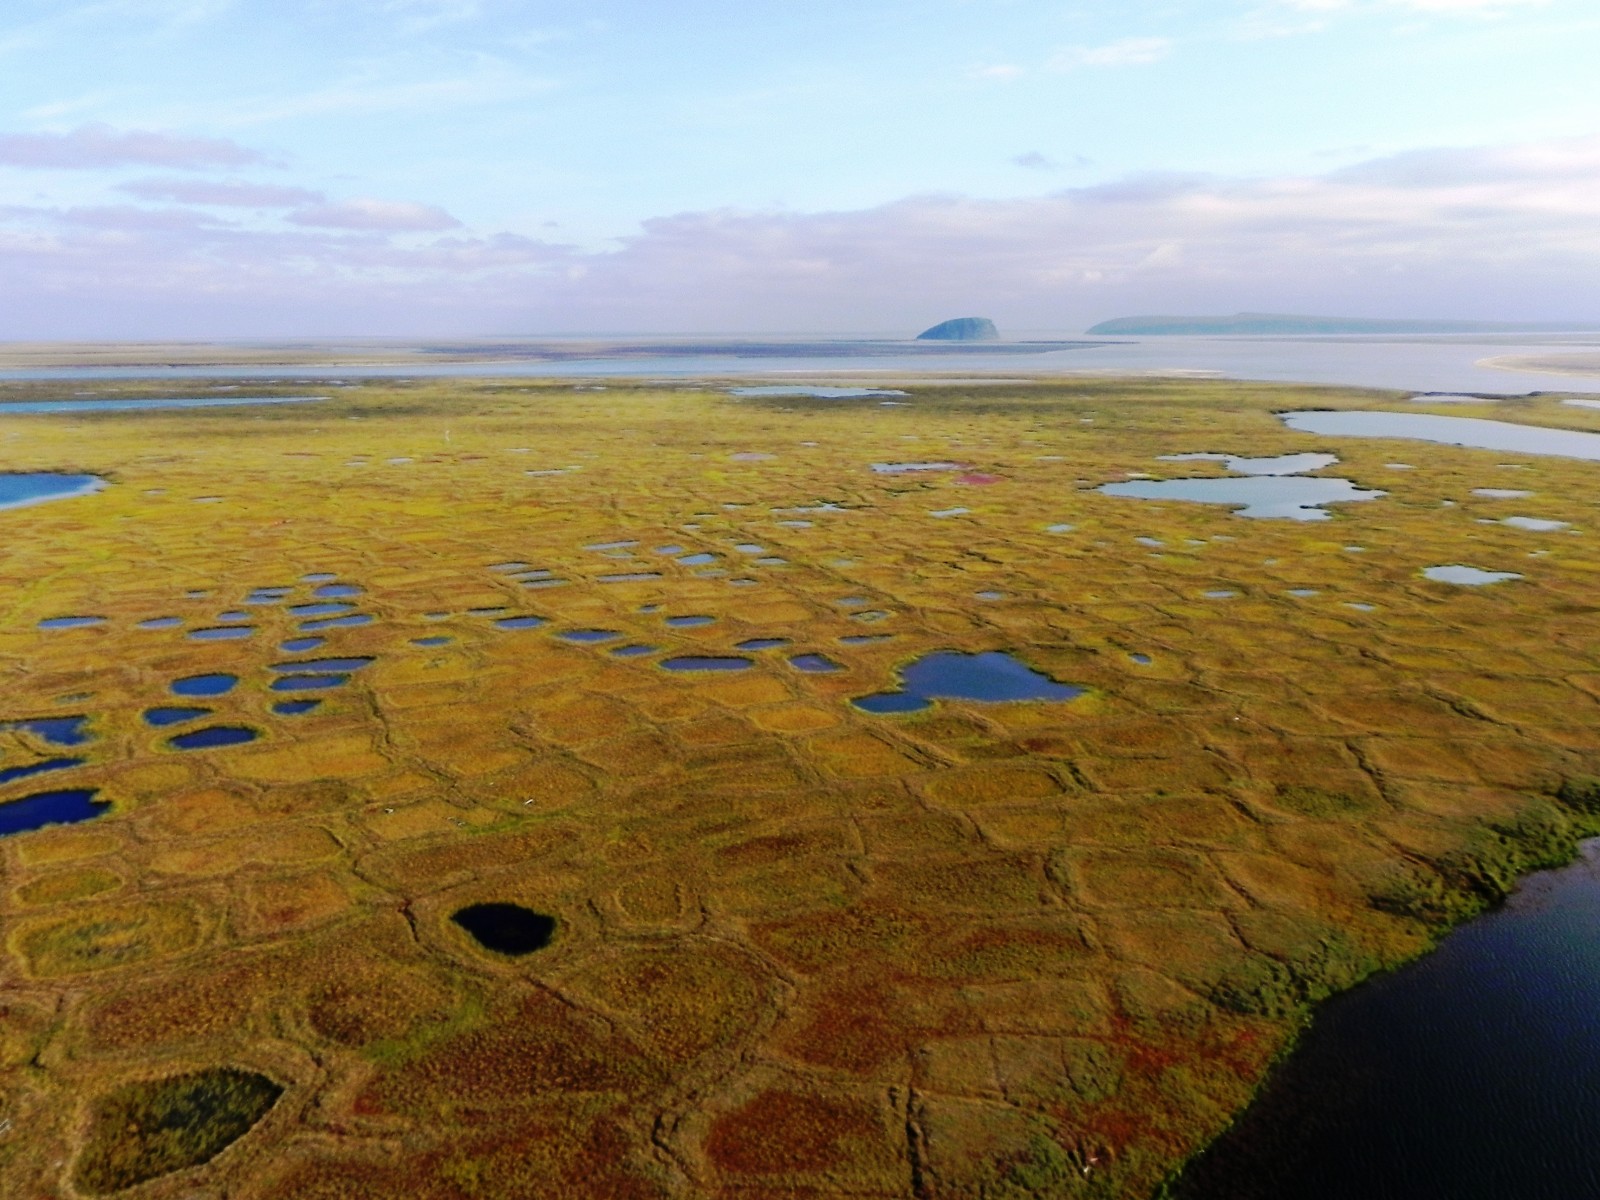
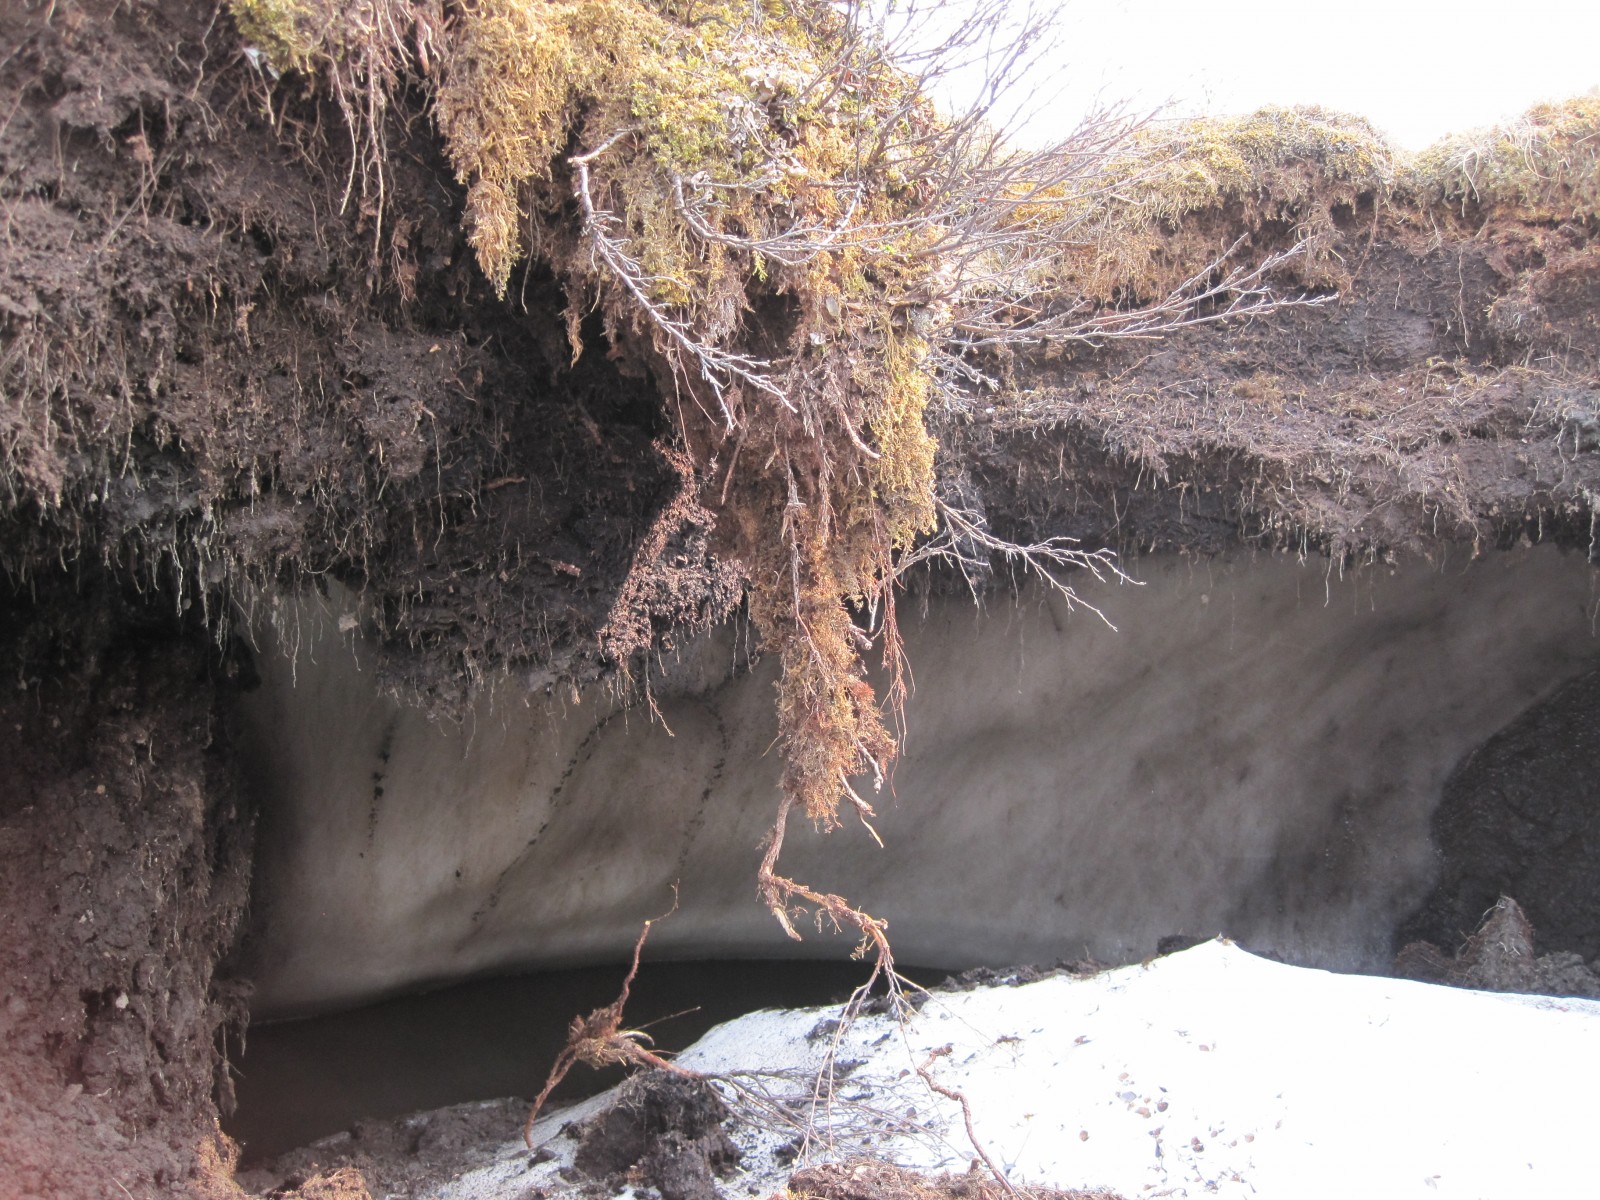
Anyway, the gorgeous photo below shows a terrific example of polygonal patterned ground from Siberia. Patterned ground is a phenomenon that occurs frequently in cold regions and is caused by the seasonal freeze-thaw of the active layer/soil. This process can produce a phenomenon called ice wedges that extend deep into the permafrost (see my photo of a large ice wedge below) as water infiltrates into a crack freezing it and expanding it. This repeats annually as the ice cracks due to the extreme cold and is then filled by new meltwater from the active layer, which freezes.

Ice wedges have excellent potential as a climate research tool as they can be very old and preserve the isotopic signature of each new year’s water. In fact, my research group has an MSc. student working on this exact thing.

Sorting of sediments by the freeze thaw of groundwater also creates patterned ground as the process forces larger sediments upward and lets smaller sediment settle eventually creating little piles of rocks on the ground surface. However, in the case of the photo below, which is in a poorly drained peatland, there are likely lots of ice wedges.

Wet Sedge Polygons on Samoylov Island with Stolb Island in the background - Samoylov Island - Lena River Delta - 20.08.2010 - Sebastian Zubrzycki

Wet Sedge Polygons on Samoylov Island with Stolb Island in the background – Samoylov Island – Lena River Delta – 20.08.2010 – Sebastian Zubrzycki

Ice wedge along the Dempster Hwy. in the Yukon.

Partially collapsed ice wedge in cross section along the Dempster Hwy. in the Yukon. (Photo: Matt Herod)

Geology Photo of the Week #44

For a bit of a change of pace the photo of the week this week isn’t a photo at all. Rather it’s a fascinating model output showing ocean surface currents in the North Atlantic. The Gulf Stream is clearly visible as it flows past Atlantic Canada and out towards the middle of the north Atlantic. I am guessing that colour scheme has something to do with current velocity or mass flux or something. Anyway, I think that red means a bigger current than blue.

Modelling is something that I have written briefly about before and am starting to get involved with in my own work. It’s a fascinating field although I believe that all model results should be taken with a grain of salt given that they try to mimic and quantify what is actually happening in nature but cannot always incorporate all of the inter-relationships that exist between the variables. This makes them only representations of what is actually occurring in the real world. However, the insane level of complexity in real systems makes models the only way to try and understand processes that we can’t observe easily. As we learn more the model can then be adjusted to incorporate new linkages and their importance more accurately.

Enough of my ranting, enjoy this unique and beautiful model output of the north Atlantic’s currents.

3b3367d54c0e5eccb464f3b770d1f53b

Surface currents in the North Atlantic– by Erik Behrens, GEOMAR, Kiel, Germany Snapshot of surface speed in a eddying (0.05°, VIKING20) ocean sea-ice model resolving important mesocale eddies and filaments explicitly.