EGU Blogs

Nuclear

Guest Post – Mike Power – Using surficial geochemistry to detect buried mineral deposits

Finding the next big mineral deposit is a dream of many geologists past, present and future. However, in the past hundred years or so, many of them close to surface have already been found and developed. This is because they can be found relatively inexpensively by traditional methods such as geochemical surveys, shallow geophysics, drilling, and a lot of luck. In the 21st century, mineral exploration is focussing on methods to find deeply buried mineral deposits, ones that can lie almost 800m beneath the surface!

To develop new methods for finding such deposits, I travelled up to northern Saskatchewan, Canada, to the Athabasca Basin, which is home to the world’s highest grade uranium deposits. As part of my M.Sc. thesis at the University of Ottawa, I completed surficial geochemistry surveys above two different uranium (U) deposits – one (Phoenix) of which is “unconformity-related”, which means it lies between the Paleoproterozoic Basin and underlying Proterozoic basement rocks at 400 m depth below the surface. The other (Millennium) is a “basement-hosted” deposit, which means it lies entirely in these basement rocks at nearly 750 m depth. When I say surficial survey, I mean taking materials from the surface or near-surface environment – soils, tills, water, gas, and sandstone, and testing them with various geochemical methods to see if we can detect signatures possibly related to the U deposits beneath (fieldwork photo, Figure 1). For soils, sandstones & tills, we used total and partial digestion with various acids to leach out what is considered the “mobile” trace metal fraction that may have migrated from an ore deposit to the soil. For water, we looked at trace metals and also tritium, a known decay product of U. For gases, we looked for dissolved gas (helium) in water-filled drill holes, as this is also a known decay product of U and its daughter products.

Fieldwork

Fig. 1: Here I am sampling above the Phoenix uranium deposit in September 2011, holding an auger with the various soil horizons we collected for sampling.

At the Phoenix survey site in 2011 & again in 2012, we discovered distinct metal anomalies in soil, till and sandstone (both humus, the organic-rich top fraction you might find in your local forest, and in B-horizon, the rich, brown soil a foot or so deeper) for U – but also Pb, Ni, Cu, Co, Mo, W, and Ag in these media (see Fig. 2a & 2b). Many of these elements are what are considered “pathfinder” metals for U, so will be enriched in the deposit itself or behave in a similar geochemical manner. Geochemical anomalies (high values) only exist when compared to background values that are low, whether a background station, or the mean + 2 σ (standard deviations) of each metal population, so any we considered had to meet this threshold.  We found these anomalies directly above the deposit itself, and also above the location of a major ore-hosting fault, using a “transect” sampling method, or taking samples in a line across a targer. This allowed us to survey across the surface trace of the deposit perpendicular to the direction of the last major ice flow event, so this would not affect our results, or “smear” metals occurrences down-ice.

Untitled

Fig. 2a: Contoured geochemical results for U in aqua regia digestion of humus soil samples from 2011-2012 and partial leach of the uppermost sandstones of the Manitou Falls Formation. The sandstone map showing interpolated U abundance from partial leach in were used as an independent base on which the soil transect results from aqua regia digestion were plotted. The surface traces of Zones A and B1 are also outlined for reference.

U Resampling GEEA_edited

Fig 2b: Detailed 2012 humus soil sampling near the 2011 site (PHX028, furthest left on graph) that showed the highest U value. The results, (samples PHX231-237 & background measurement in 2012) confirm the reproducibility of anomalous U observed last year.

Based on the results we obtained at Phoenix, we decided to see if we could detect any anomalies in these materials that might be related to Millennium- the much deeper deposit. Using leaches on the humus and B-horizon soils, we were also able to see anomalies of U, Pb, Ni and Cu, which was encouraging, as these occurred over the deposit, and also over the surface projection of the ore-hosting fault, which was interpreted to come to surface based on a 3D seismic geophysics survey. Even more exciting, at this site, however, is that we obtained values of 4He (the main isotope of He) that were more than 700 times atmosphere in drill holes intersecting the deposit (Fig. 3)! (Ed Note: 4He is a product of uranium decay – the alpha particles that Uranium emits as it decays are, in fact, 4He nuclei. Therefore, an anomalously high 4He value is a good indicator of nearby Uranium decay.) It was important that in drill holes that weren’t near the deposit, we did observe atmosphere values, as to have a good measurement of background. Having anomalies in trace metals in the soils was one thing, but now we observed gas anomalies in water in the same locations. This led us to conclude that there was a high possible of redistribution and upward migration of U ore related metals and decay products from the deposit at depth.

Fig 10 (1)

Fig 3: Ratios of 4He/36Ar in the sample and 4He/36Ar in the calculated value for air-saturated water (ASW) vs. the inverse value of the abundance of 4He in each sample. Three samples (MLN G05-07) display extremely radiogenic values of 4He, while the typical atmosphere value is plotted (as a 4He/36Ar ratio of 1). The radiogenic 4He observed could possibly be sourced from the U deposit at depth

Now that we had our hypothesis of upward migration of metals (Phoenix) and both metals & gases (Millennium), could we guess if these processes are happening in modern times, or happened long ago? When we look at lead isotopes in humus at Phoenix, we observed that they show what is know as a common lead signature – which means lead not related to radiogenic, or radioactive, lead associated with active uranium decay. Therefore, we assume that this system is closed and metals have not migrated in many thousands (or millions) of years. At Millennium, however, we observe radiogenic He levels in modern-day groundwaters above the deposit, suggesting these products are actively migrating away from the deposit. So some deposits are closed at present day, and some are open. It just depends how you look at them!

That the geochemistry of surficial materials can be used to explore for deeply buried mineral deposits is a powerful idea, and much work still needs to be done depending on the deposit type and surficial environment being explored in. It is cheaper compared to geophysics and radiometrics, and can be completed with a relatively smaller crew of just a few people. And just like other techniques, it isn’t always going to find the next big deposit, but can be another useful instrument in the explorationist’s toolbox.


IMG_6579

Michael Power is an MSc student in exploration geochemistry at the University of Ottawa in Ottawa, Canada. He did his undergraduate degree at Memorial University in Newfoundland, Canada. Michael has worked in a range of mineral and petroleum exploration related positions during and after his undergrad, from the oil sands of Alberta to the gold districts and offshore oil fields in Newfoundland. His MSc research is trying to better understand how geochemistry of surface materials can detect deeply buried U deposits. Tweets as @mikeyp22


Back in Colborne Quarry!

It finally happened! After 10 years of being denied access to one of the all time best fossil collecting spots in North America myself, and a few other lucky geologists were allowed into the quarry with unrestricted access for the day last Thursday! The last time I visited Colborne Quarry was before I had started my undergraduate.  Shortly after that visit all collecting access to the quarry was suspended due to an incident with the gate and the potential liability of us wandering around a giant open pit all by ourselves. Fair enough. Since then I have wanted to get back in there, but opportunities have been few and far between. If you recall, the best fossil in my personal collection came out of Colborne: Bert and Ernie!

Let’s back up a bit though. Colborne Quarry is a massive open pit limestone quarry located in Colborne, Ontario.

The town of Colborne could actually fit quite comfortably in the quarry itself. Indeed, the quarry is 2 kilometeres long by 1.5 wide and is currently ~150m deep. It opened in the early 1950’s and is expected to produce limestone aggregate for another 120 years at which point it will be around 250m deep. The quarry lies in the middle Ordovician aged Cobourg formation and extends down into the Sherman Falls  formation as well.

The reason that myself and several others from the university were interested in going was not only because of the fossils. We are all working on a project to store low and intermediate level radioactive waste in the Cobourg Formation 500km west of Colborne and this was a rare opportunity to look at the Cobourg in outcrop as opposed to core. I have seen lots of Cobourg formation in core samples, but it is a completly different story when you can see outcrop. It makes it possible to see lateral continuity of beds, hydrothermal fracture filling, vuggy porosity, faults and many other features that it is much harder to glean from the core. We were particularly interested in looking for fluid conducting features such as faults or porosity that it is easy to miss with a core section. We were also interested in looking for fossils as well.

A close up view of the whole quarry in air photo form. (Photo: Matt Herod)

Colborne is a very, very active quarry. They blast every day the weather permits, luckily not the day we were there, and when they are not blasting they are drilling blast holes all over the place. The limestone is then loaded from the crusher onto a ship that conveys the rock to Mississauga, Ontario where it gets turned into cement.

The outlet of the crusher. (Photo: Matt Herod)

Each truck load drops 100 tonnes into the crusher. They have two trucks running 10 hours/day. (Photo: Matt Herod)

The ship coming into port for loading. It runs 24/7 and makes one trip to the quarry every 20 hours. The rock HAS to be ready for loading each 20 hour cycle every day of the week. (Photo: Matt Herod)

While we were in the quarry we also took advantage and did a bit of fossil collecting. I didn’t find anything that comes up to the Bert and Ernie standard, but I did pretty well.

We did most of the collecting on piles of un-collected rock. We had to move fast since this material was headed to the crusher in a few short hours. (Photo: Matt Herod)

A giant trilobite!! A few key pieces are missing, but it shows how big they can get. (Photo: Matt Herod)

A really nice complete trilobite. Only a tiny bit of the head is missing. (Photo: Matt Herod)

The best find of my day!! A complete and very large specimen of an unusual species of trilobite. It doesn’t look compete, but the rest of it is under the rock and so it will require some careful cleaning to bring out its full glory. (Photo: Matt Herod)

So that pretty much does it for this trip. It was a great day and after all those years waiting to get back into the quarry it did not disappoint!

Cheers,


My EGU2013 (Tuesday)

Firstly, I am not actually attending EGU 2013 this year. However, that does not mean I can’t participate. In fact, it has been incredibly easy for to me join in, although I have had to wake up very early in the morning to make up for the time difference between Vienna and Ottawa.

I took part in two press conferences on Tuesday. The first called: The consequences of nuclear accidents: Fukushima and Europe and promised to be extremely interesting especially from my point of view as a researcher of environmental radionuclides. In fact, I was tuned in for more than just the EGU blogging part since I am in the midst of a project investigating the effects of Fukushima here in Canada and the transport of radionuclides from the accident. I intend to present the work at Goldschmidt later this year and write a publication on it which will comprise a part of my thesis.

The session was started by Dr. Yuichi Onda from the Centre for Research in Isotopes and Environmental Dynamics at the University of Tsukuba.

Dr. Onda and his group are studying the transfer and fallout of Fukushima radionuclides in every aspect of the environment. This is an incredibly daunting task. The infrastructure required to sample so many different environmental reservoirs is mind-boggling and Dr. Onda showed in several of his slides how tough it could be. The group sampled trees, soil, soil water, soil erosion, water in both cultivated and non cultivated environments, sediment in rivers and lakes as well as transport between these reservoirs and then finally the transport to the ocean from all of these sources. Basically, they set up one bad-a$$ monitoring network!

The conclusions from this network were that the deposition process of the radionuclides began by falling on trees but then over time washes off and between .2 and 3.5% of the fallout washes into streams and rivers where it is then transported to the oceans. In a very basic way it kind of looked like this:

File:HydrologicalCycle1.png

Source: Wikipedia

The next speaker was Dr. Kazuyuki Kita from Ibaraki University. He was explaining one step earlier in the whole transport process than Dr. Onda since Dr. Kita’s focus is on the atmospheric transport and dispersion of radionuclides from Fuksuhima. Basically, once the accident occured tons of radionuclides were released into the atmosphere and blown hither and yon until they are eventually deposited in rain or adsorbed onto aerosols and settle because of gravity’s relentless nature. They can also be re-suspended after the fact. This is particularly common with iodine (I know about this one…) Dr. Kita then went on to show a picture of the fallout of cesium-137 over Japan, which is pictured below. Furthermore, the measured concentrations agreed very well with the predictions made by atmospheric modelling, which is a tricky business at the best of time, but must be even more so when the entire world is breathing down your neck asking where will the radionuclides go? The difference were due to rainout, which is difficult to predict.

Slide from Dr. Kita’s talk showing the actual fallout vs. the modelled fallout.

Dr. Kita then went on to talk about the variation of radionuclides in the atmosphere over time following the accident  and the influence of re-suspension on radionuclides sitting on the land surface. He showed this graph which illustrates very clearly how 137Cs and 134Cs concentrations spiked following the accident and then declined over time. However, if you look in October you can see that the levels start to rise again, which Dr. Kita attributes to re-suspension. Furthermore, these peaks were coincident with the transport of air parcels from Fukushima as well making it certain that this was the source of the radionuclides. Another source of radionuclides since the disaster has been the re-emission of iodine and cesium from the ocean surface as well.

A slide from Dr. Kita’s talk showing the temporal trend in cesium fallout from Fukushima.

The final talk of the press conference was by Dr. Petra Seibert from the University of Vienna. Dr. Seibert, a meteorologist, gave a truly fascinating, yet somewhat scary talk about how prepared (or not) Europe is for nuclear accidents and the consequences they have with context from both Fukushima and Chernobyl. Dr. Seibert makes the point that despite ample opportunity to learn from our nuclear mistakes we have not addressed all of the deficiencies that exist.

Concerning Fukushima, Dr. Seibert points out that the dispersion of radionuclides from the nuclear plant is not simple and results in contamination outside of predicted zones. This means that the evacuation pattern of simply evacuating people in concentric circles depending on the distance from the plant is not a very effective way of ensuring that people are not affected since the atmospheric spread of radionuclides is not circular. Therefore, in order to be prepared for potential disasters a predictive model of dispersion is needed. Dr. Seibert has developed such a model and shows some of the incredibly variable, and somewhat artistic, results in the following image. The blank space shows a movie of a very complex dispersion.

A slide from Dr. Seibert’s talk showing the incredibly variable nature of radionuclide dispersion from a point source.

Dr. Seibert’s ultimate point is that despite what we have learned from Fukushima and Chernobyl we are not yet prepared enough to handle another large nuclear disaster. Indeed, she makes the point that one in Europe could result in continental scale contamination and that in order to prepare for this proactive measures like iodine tablets should be widely distributed. Furthermore, data distribution and communication between organizations and nations is not adequate as well, which would only serve to exacerbate the seriousness of a nuclear accident should one occur.

In my opinion to keys to avoiding another Chernobyl or Fukushima lies in open communication and learning everything we can from these two disasters. However, I put it to you, what do we still need to learn? What are our shortcomings when if comes to disaster preparedness. Do you agree with measures like iodine distribution in order to mitigate the risk from another accident or should we just cease nuclear energy production entirely?

I also tuned into the fantastic press conference on the Chelyabinsk meteorite fall, but Jon has covered it excellently so head over to his blog a for a summary of it. If you would like to watch the livestream of the press conference for yourself it can be found here: http://streams.h82.eu/EGU2013/index.php?modid=18&a=show&pid=206


It’s rainin’ isotopes…

This post is kind of a continuation of Laura Roberts excellent guest post on the Solar Storms and the Earth’s Magnetic field. However, this is a bit of a different spin on it. I am not writing about what get’s kept out, but rather what slips by the shield and gets in. Of course, I am speaking about cosmic rays and the wonderfully useful isotopes they produce that rain down upon us. Yes, it is literally raining isotopes…all the time! I know that this sounds weird, when I first learned about this phenomenon it came as a complete surprise to me. Not only are isotopes raining down all the time, but there is a lot that we can learn about our planet by analyzing these  amazing by-products of cosmic ray collisions.

What are cosmic rays?

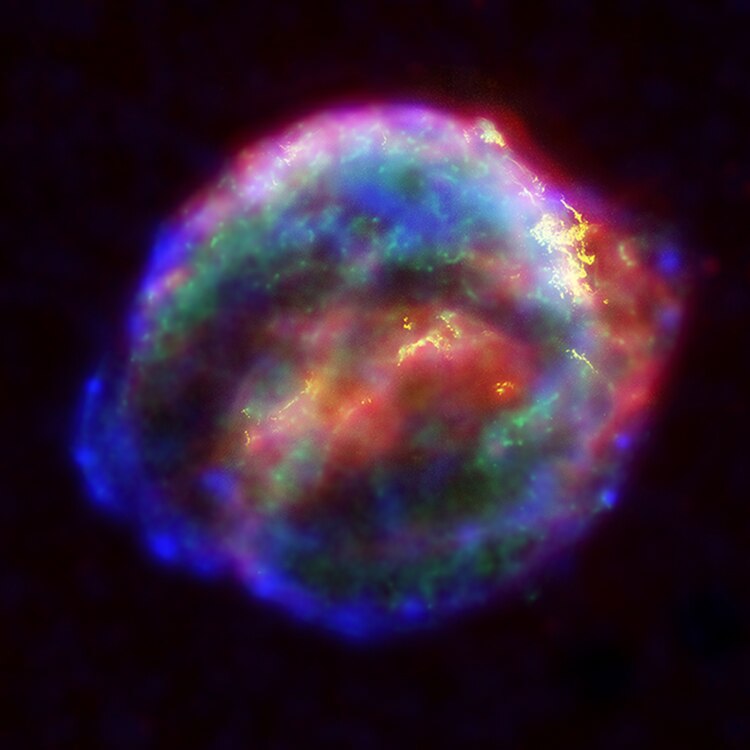
Cosmic rays are incredible things. The Earth is constantly being bombarded by them and we are protected from this massive influx of extra-terrestrial radiation by our magnetic field and atmosphere, which deflects about 90% of the low energy cosmic rays. Check out last weeks awesome guest post about Earth’s magnetic field. There are two types of cosmic rays. Primary cosmic rays generally originate outside of our solar system and travel throughout space occasionally bumping into things like planets. In fact, it has only recently been discovered exactly where they come from. In February, 2013 a paper came out in Science called: Evidence Shows That Cosmic Rays Come From Exploding Stars that (surprise) stated primary cosmic rays are produced by exploding stars aka. supernovae in which an ancient star blows up, releasing massive amounts of energy, elements and cosmic rays!

File:Keplers supernova.jpg

Kepler’s Supernova (Source)

Primary cosmic rays are 99% protons and alpha particles (two protons and two neutrons) and the remaining 1% are the nuclei of heavy atoms or beta particles (electrons). These bits of atoms and radiation fly around in space and bang into everything. Sometimes, actually more often than sometimes, they bang into the Earth. In fact, they bang into the Earth a lot! There are billions of collisions every day. Some of the particles crashing into the Earth have low energies while others have high energies. The frequency that these low energy particles collide is many times greater than high energy ones. There are about 10,000 collisions per square meter per second for giga-eletronvolt particles. For the higher energy rays the rate of collision is less. They might arrive with a frequency of 1 per square metre per second, as is the case with tera-electronvolt particles. The decrease in collision frequency continues as energy increases up until the very highest energy of the exa-electronvolt which collides about 0nce per square kilometre per century.

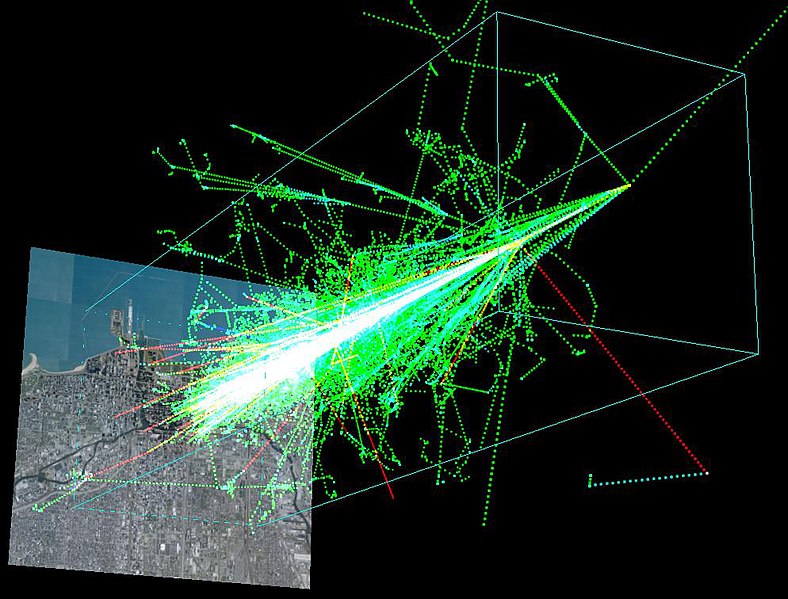
When cosmic rays pass through the Earth’s magnetic field is when things start to get really interesting, from a geochemical perspective that is. When primary cosmic rays enter the Earth’s atmosphere they start banging into all of the molecules and atoms floating around up there and produce secondary cosmic rays. Basically imagine a bowler throwing a strike. The bowling ball represents the primary cosmic ray and the pins are the molecules in the atmosphere. When the ball collides with the pins they fly off in every direction, which is analogous to the process occurring constantly in our atmosphere. When this takes place in the atmosphere the collision is so energetic the molecules and atoms can actually break apart. This is called spallation and results in a cascade of neutrons, protons and atoms called an air shower.

File:Protonshower.jpg

A simulation of a cosmic ray shower formed when a proton with 1TeV (1e^12 eV) of energy hits the atmosphere about 20km above the ground. The ground shown here is a 8km x 8km map of Chicago’s lakefront. This visualization was made by Dinoj Surendran, Mark SubbaRao, and Randy Landsberg of the COSMUS group at the University of Chicago, with the help of physicists at the Kavli Institute for Cosmological Physics and the Pierre Auger Observatory. (Source)

What is produced?

Air showers produce all sort of radioactive isotopes that are formed no other way. Some are very short lived and decay away quickly, while others are extremely long lived and have half lives of millions of years, allowing them to accumulate in the environment.

A list of the major cosmic ray isotopes and their half lives. The ones in bold have geologic applications.

Other isotopes are produced when cosmic rays reach the ground and collide with minerals. This can cause other isotopes to form within the mineral crystal lattice. For example, the cosmogenic isotope, aluminum-26 is produced when a cosmic rays strikes a quartz crystal and transforms some of the silicon in the quartz structure into aluminum. These are referred to as in-situ cosmogenic isotopes.

The next part of the process concerns what happens to all of these isotopes once they have sprung into existence thousands of metres above our heads. The fate of these isotopes is varied and they all live in the atmosphere for a little while before becoming part of the hydrologic cycle. Eventually they fall down to Earth either stuck onto aerosols or incorporated into rain and begin to interact with water bodies, enter groundwater, stick to soil particles or get absorbed into people, plants or animals. Essentially, they begin cycling through the environment until they decay away. Since these isotopes get cycled through various parts of the environment we can use them as tracking tools to trace the pathways they take and learn about their interactions with other components of environmental cycles.

What is the use?

Cosmic rays isotopes are useful for more than just getting a good tan! In fact, the list of possible questions that can be applied to cosmogenic isotopes just goes on and on. I’ll just briefly cover a few of them since each one of these applications is a whole blog post by itself I’ll just give the highlights here.

Exposure age dating: Exposure age dating is one of the principle uses of cosmogenic isotopes and several different ones have been employed to this end. Exposure age dating is when we use cosmogenic isotopes to date how long something has been exposed to secondary cosmic rays at the Earth’s surface. For example, a rock at the toe of a glacier may have just been exposed to cosmic rays a year ago and its exposure age date will tell us this. Another rock, 20 metres further from the glacier toe may have been exposed 5 years ago and this difference will be recorded. Basically, the clock starts ticking once cosmic rays are able to reach the rock or bone, or whatever material is being dated. Exposure age dating has the power to date materials that range from only a few thousand years to millions of years depending on the half lives and concentrations of the nuclides in question. The way exposure dating works is that when a secondary cosmic ray impacts a rock containing Si (silicon) or O (oxygen) some of the neutrons on the silicon or oxygen are knocked off and the result is the production of aluminum-26 or beryllium-10 right in the mineral lattice. One common mineral that contains both silicon and oxygen is quartz. Quartz is pretty much everywhere and in everything, which opens the door for a wide range of materials that can be exposure age dated. All they have to contain is a bit of quartz. The decay of 26Al and 10Be allows the material to be dated. There are other isotopes that can be used for exposure age dating besides these two and other minerals that contain Si or O can also be used as well. The figure below shows the wide range of applications that exposure age dating can be applied to. For example, if you want to date a volcanic eruption it is easy to exposure age date the lava or ash, both of which have a lot of Si. It is also possible to date landslides, erosion rates, burial ages, the list goes on and on. There are many other isotopes that can be used as well besides 26Al and 10Be.

CLOUD Project: The CLOUD project is a CERN experiment that is investigating the possible linkage between cosmic rays and cloud formation. It has been hypothesized that cosmic rays can cause clouds to form by forming aerosols and it has been noticed by satellites that an increase in the cosmic ray bombardment can increase the amount of cloud cover. Cloud cover has a profound influence on the Earth’s energy balance and hence climate. It has been proposed that throughout geologic time changes in the cosmic ray flux have been responsible for climate change. However, proving this is difficult given the length of time in question and the evolving states of the cosmic ray flux and Earth’s magnetic field. However, CLOUD has set out to find the linkage between cosmic rays, clouds and climate if one exists.

Carbon-14: Carbon 14 is unquestionably the most used of any of the cosmogenic isotopes. It has applications in geology, archaeology, paleontology, anthropology, hydrogeology, and many other -ologies as well. 14C is produced primarily when neutrons collide with nitrogen in the atmosphere replacing a proton in the nitrogen nucleus and transforming it into carbon-14, although atmospheric nuclear weapons testing also produced a substantial amount of 14C. The primary use of 14C, or radiocarbon, is radiocarbon dating. Once radiocarbon is produced it enters the global carbon cycle and disperses throughout the environment. Since it is part of the carbon cycle it becomes incorporated into all living things, including people and animals. 14C continues to enter our bodies while we are alive. Once we die, there is no further addition of 14C and therefore, the clock starts ticking on its use as a dating tool. 14C has a 5,730 year half life and is therefore useful as a dating tool for biological materials up to ~45,000 years ago.

Cosmic rays are some of the most mysterious, yet useful phenomena on our planet and have allowed for incredible advances in many sciences. As new, more sensitive technology becomes available look for the use of cosmic rays and the isotopes they produce to accelerate as we find new questions they can be used to answer.

Cheers and thanks for reading,

Matt