EGU Blogs

Geophysics

The Search for Ithaca

This post unifies two of my absolutely favourite topics: geology and classical Greek history. I have always had a soft spot for the classics. In fact, when I started my undergrad I was planning on doing a double major of geology and classics. I decided to focus on geology, but I have not lost my love of ancient civilizations particularly the ancient Greeks and Romans.

File:Head Odysseus MAR Sperlonga.jpg

Odysseus (Source: Wikipedia)

Most of us are familiar with the story of the Odyssey, but I’ll recap it here briefly. The Odyssey is the tale of Kind Odysseus’s journey back from Troy to his home island of Ithaca. Odysseus, despite being a pretty shrewd guy, angers the god Poseidon who condemns him to wander the ocean for decades before he can go home. During this time Odysseus experiences many wild adventures in is quest to return home to his wife, Penelope and his son, Telemachos. Eventually, Odysseus returns home, but just in time to prevent his kingdom falling into rival hands. It is a classic good guy triumphs over evil tale and one of the best classical poems ever written. Homer obviously took substantial creative licence in the poem, as was customary at the time, however many of the places he mentions are real, as are the people such as Agamemnon, Menelaus, Troy, Mycenae, Sparta, etc. However, there has always been a question…where is Ithaca?? Indeed, Ithaca was missing. The home of the principle character in the poem was nowhere to be found and this just doesn’t jive with the accurate nature of rest of the poem.

This is a question that had baffled classical scholars for decades. At first, many believed that Homer just made up Ithaca since at that time Troy was believed to be fictional as well. However, once Troy was discovered it no longer made sense to think that Ithaca was made up and therefore, it must be some place amongst the Greek islands.

The passage in the Odyssey that describes the location of Ithaca is as follows:

 εἴμ’ Ὀδυσεὺς Λαερτιάδης, ὃς πᾶσι δόλοισιν

ἀνθρώποισι μέλω, καί μευ κλέος οὐρανὸν ἵκει.

ναιετάω δ’ Ἰθάκην ἐυδείελον: ἐν δ’ ὄρος αὐτῇ

Νήριτον εἰνοσίφυλλον, ἀριπρεπές: ἀμφὶ δὲ νῆσοι

πολλαὶ ναιετάουσι μάλα σχεδὸν ἀλλήλῃσι,

Δουλίχιόν τε Σάμη τε καὶ ὑλήεσσα Ζάκυνθος.

αὐτὴ δὲ χθαμαλὴ πανυπερτάτη εἰν ἁλὶ κεῖται

πρὸς ζόφον, αἱ δέ τ’ ἄνευθε πρὸς ἠῶ τ’ ἠέλιόν τε,


I am Odysseus, Laertes’ son, world-famed

For stratagems: my name has reached the heavens.

Bright Ithaca is my home: it has a mountain,

Leaf-quivering Neriton, far visible.

Around are many islands, close to each other,

Doulichion and Same and wooded Zacynthos.

Ithaca itself lies low, furthest to sea

Towards dusk; the rest, apart, face dawn and sun.


So there you have it in beautiful Homeric Greek. The location of Ithaca…it is the westernmost of the Greek islands, which today is Cephalonia, formerly known as Sake, and not Ithaca. As for the current Greek island called Ithaca it in no way meets the description of Homer’s Ithaca and therefore it cannot be the same island, unless Homer was trying to play a massive joke on us all or did not understand basic geography, neither of which is very likely. So where did ancient Ithaca go?

Over the past few years a new theory has emerged to answer this question. In short the idea is that the thin isthmus of land between Paliki and the rest of Cephalonia was at one point underwater separating the two places and resulting in two islands. Indeed, there is classical text to back up such and idea. Strabo, the renowned ancient geographer wrote “where the island is narrowest it forms an isthmus so low-lying that it is often submerged from sea to sea.” If we trust Strabo, this means that during classical times there were actually two islands that are now one. Perhaps, westernmost Paliki was Ithaca during Homer’s time and the current island called Ithaca was another island was Doulichion. However, how can we prove that this idea is more than just an interesting theory?

Elevation map of Cephalonia. The white test is the current names and the yellow text is the name in Homer’s time. (Source: Odysseus Unbound)

Well, to answer this question we must turn to geology…we had to get there sometime.

The geological investigation of Stabo’s channel, now known as the Thinia valley, is being carried out by John Underhill, a professor of seismic and sequence stratigraphy in the University of Edinburgh department of geosciences. The geological evidence that Strabo’s channel existed is outlined in a paper by Dr. Underhill published in Nature Geoscience and is freely available online. However, I’ll give a brief outline of the evidence here.

In order to prove that Paliki was once an island the geology must show that the Thinia valley was once under water. However, the problem is that the elevation of the Thinia valley is 180m above sea level…and sea level certainly has not changed 180m is only 3000 years!!! However, there are other geologic features that can account for some of the uplift. The Eastern side of the Thinia valley is divided by a large thrust fault known as the Aenos Thrust, which is an extremely active fault to this day. Indeed, the last major earthquake on Cephalonia was a 7.2 magnitude in August 1953. The seismicity is generated by the collision of the Eurasian plate with the African plate. However, the earthquakes, while they cause substantial uplift did not occur often enough or have enough displacement to result in over 180m of uplift since the time of Homer. Therefore, another mechanism is needed to fill in the valley and raise it to 180m. Mapping of the island and the valley revealed a possible solution to this problem. The mapping revealed the occurrence of several large landslides and rockfalls in the valley. In fact, large blocks from the valley walls are easily observable within the valley. These massive landslides and rockfalls were caused by the earthquakes and storms and a lot of material fell from the steep valley walls into the valley.

A resitivity survey of the Thinia valley. The blue is Cretaceous bedrock, red is water, and the green and yellow are unconsolidated sediments. (Source: Odysseus Unbound)

 To further prove the existence of Strabo’s channel, however, direct evidence of marine sediments must be observed underneath all of the landslide fill. In order to do this Underhill’s team drilled numerous boreholes around the valley and found many places where there was indeed marine sediment. In addition to drilling they also conducted geophysical surveys in order to map the subsurface geology of the valley in greater detail, which would allow them to map the channel and prove that it actually separated Paliki from the rest of Cephalonia. The geophysical techniques allowed them to determine the amount of fill in the valley from landslides, the depth to bedrock and the bedrock contours. Further surveys also revealed that there were drainage features in the sediment of the embayments on either side of the valley which shows that water flowed into the sea through the valley. Combining the boreholes, and the geophysical mapping all of the evidence points to the fact that Strabo’s channel did exist 2000-3000 years ago and that since that time uplift from earthquakes, landslides and rockfalls has filled in the channel and joined Paliki (Ithaca) to the rest of the Cephalonia concealing Ithaca from us!!!

Thanks for reading and please feel free to post any questions or comments!

References:

Odysseus Unbound: http://www.odysseus-unbound.org/

Underhill, J. (2009). Relocating Odysseus’ homeland Nature Geoscience, 2 (7), 455-458 DOI: 10.1038/ngeo562

Note: This is a repost from my pre-EGU blog location with minor updates. It was originally posted in June 2012.

Guest Post: Dr. John W. Jamieson – Using seafloor mapping to find missing Malaysia Airlines flight MH 370

Guest Post: Dr. John W. Jamieson – Using seafloor mapping to find missing Malaysia Airlines flight MH 370

On March 8th, 2014, Malaysia Airlines flight MH370 disappeared while en route from Kuala Lumpur to Beijing.  Evidence from satellite tracking suggests that the aircraft may have crashed into the Indian Ocean several 1,000 kms west of Australia and this is where the search is now focused.  No debris or oil slick related to the aircraft has so far been found.  However, signals consistent with the “pings” of the flight data recorder were detected in two areas, several 100 kms apart from each other.  A search of the northernmost location, using an autonomous underwater vehicle (AUV) owned and operated by the United States Navy has so far turned up no sign of wreckage of the aircraft.  The intent of this blog post is to explain what instruments are being used to locate the wreckage, how they work, what are their limitations, and hopefully provide some clarity and perspective on the monumentally difficult task that lies ahead for the searchers.

Why is finding something on the seafloor so difficult?  The methods we use for mapping and surveying on dry land (e.g., aerial photographs, satellite imagery, laser and radar mapping) rely on the electromagnetic spectrum (e.g., radio frequencies, the visible spectrum and even infrared photography).  Electromagnetic waves attenuate quickly in seawater, however, and can only propagate over short distances (sunlight only penetrates the top 200 m of the ocean, known as the photic zone).  The result is is that we cannot see through water very well using electromagnetic waves, and the oceans effectively shield us from surveying the seafloor using traditional means used on land (and on other planets!).  So, to map the seafloor, alternative techniques are required.

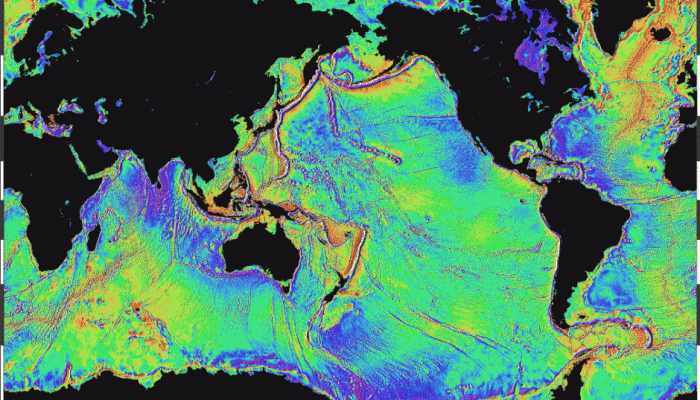
On any world map that includes information on the ocean floor (e.g., Google EarthTM) you can see features such as ridges, seamounts, the continental shelves and submarine trenches.  These features were mapped using satellite altimetry, a technique in which orbiting satellites use radar to measure small spatial variations in sea level.  The uneven surface of the ocean results from variations in Earth’s gravitational field, which is stronger above positive features (e.g., a volcano) on the seafloor, due to the presence of more mass, relative to regular abyssal plain.  The increased gravitational pull causes seawater to preferentially flow to that location, resulting in an elevated ocean surface height directly above the volcano, or a dip in ocean surface height above a trench.  These sea surface variations can be translated into a map of topographic features on the seafloor (Fig. 1).  The resolution of the map, however, is only 1-3 km, which means features on the seafloor smaller than a few kilometers cannot be resolved (note that most media outlets covering the Malaysia Airlines search have been inaccurately reporting the resolution as 20 km).

Figure 1: Global seafloor topography map derived from satellite altimetry data.  Source: http://topex.ucsd.edu/WWW_html/mar_grav.html

Figure 1: Global seafloor topography map derived from satellite altimetry data. Source: http://topex.ucsd.edu/WWW_html/mar_grav.html

To generate maps of the seafloor with higher resolution, hydroacoustic or SONAR (Sound Navigation And Ranging) methods are used.  Unlike visible light or radio waves, sound waves are compression waves and can travel greater distances in water, and hydroacoustic techniques (e.g., the “pinging” of a flight data recorder) are the standard methods used for underwater mapping and communication.  Multibeam sonar is a mapping technique where a series of acoustic beams are emitted simultaneously downward to the seafloor in a fan-shaped geometry perpendicular to the direction of travel of a ship, submarine or other carrier platform.  The time taken for the acoustic signals to reflect off the seafloor back to a receiver is converted into a depth.  By using multiple beams, a swath underneath the ship that is roughly equally to 2 to 7 times the depth can be mapped, producing a 3-D topographic image of the seafloor beneath a vessel as it moves forward.  Modern multibeam systems can produce maps with a resolution of ~30 m (actual resolution is dependent on several parameters including depth and speed of the vessel).  It would take a fleet of 10 ships 15 to 45 years of continuous surveying to map the entire ocean floor at a resolution of ~40 m.  Although the resolution of multibeam mapping is significantly higher than the global satellite map, it is still inadequate to be of any use for finding a downed aircraft.

Higher resolution maps can be generated if the multibeam transmitter and receiver are closer to the seafloor.  This is achieved by mounting multibeam systems onto instruments towed deep beneath a ship by a cable, or, more recently, using AUVs such as the U.S. Navy’s Bluefin-21, which are effectively underwater drones that can be programmed to fly at prescribed altitudes above the seafloor.  From heights of 50-100 m above the seafloor, resolutions of less than 1 m can be achieved, which is good enough to find objects on the seafloor such as sunken ships, containers that have fallen off cargo ships, or aircraft wreckage (Fig. 2).

Figure 2: Example of a 2 m resolution image of the seafloor, derived from autonomous underwater vehicle (AUV) multi-beam SONAR data.  This image is from the Juan de Fuca Ridge, in the NE Pacific Ocean. The mound in the foreground has a diameter of ~75m and a height of 26 m.

Figure 2: Example of a 2 m resolution image of the seafloor, derived from autonomous underwater vehicle (AUV) multi-beam SONAR data. This image is from the Juan de Fuca Ridge, in the NE Pacific Ocean. The mound in the foreground has a diameter of ~75m and a height of 26 m.

A related hydroacoustic method that is commonly used (including for the Malaysia Airlines search) is side scan sonar.  Instead of emitting acoustic beams downwards, beams are emitted outward and downward at a wider angle, relative to multibeam sonar.  The intensity of the reflected signal is measured, producing an acoustic “image” of the seafloor.  The advantage of side scan sonar is that hard, solid objects stand out clearly, and, because the survey “swath” is wider than that for a multibeam survey, a larger area can be covered.

The initial search area for MH370 was a 314 km2 area where a pinging consistent with that of the Boeing 777’s black box was detected.  This area was surveyed with a U.S. Navy Bluefin-21 AUV using side-scan sonar, covering an area of ~40 km2 per day.  This initial survey turned up no evidence of the missing aircraft.  As the search radius expands, the area of seafloor to be covered increases exponentially.  For example, expanding the survey area to cover 60,000 km2 of seafloor, which is likely the next step, would take over two years with a single AUV.  However, this area will first be mapped using ship-based multibeam (a process that has already started), before choosing new targets to survey more thoroughly with an AUV.

In 2009, Air France flight AF447 crashed in the Atlantic Ocean en route from Rio de Janeiro to Paris. The wreckage of the aircraft, including the flight data recorder, was found two years later after searching nearly 17,000 km2 with 3 REMUS6000-type AUVs (one from GEOMAR in Kiel, Germany, and two from Woods Hole Oceanographic Institution, in Massachusetts, USA).  Figure 3 shows side scan reflections that were the first images of wreckage on the seafloor from the Air France flight.  Luckily, the wreckage came to rest in a flat, featureless area within a very mountainous region of seafloor near the Mid-Atlantic Ridge, so that the reflections seen in the image stood out easily.  Had the wreckage come to rest in an area such as that shown in Figure 2, the wreckage would not necessarily stand out so clearly.

Figure 3:  Side scan image of initial discovery of Air France 447.  The debris appears as bright reflections on an otherwise flat seafloor.  Source: http://www.bea.aero/docspa/2009/f-cp090601e3.en/pdf/f-cp090601e3.en.pdf

Figure 3: Side scan image of initial discovery of Air France 447. The debris appears as bright reflections on an otherwise flat seafloor. Source: http://www.bea.aero/docspa/2009/f-cp090601e3.en/pdf/f-cp090601e3.en.pdf

A major difference with the Air France search, compared to the Malaysia Airlines search, is that floating debris was discovered within a week of the crash, providing searchers a clear target from which to base their search.  The current search location in the Indian Ocean is constrained by satellite data, which defines a broad area spanning 1,000s of kms, and two separate reports of potential acoustic flight recorder pings, spaced 100 kms from each other.  With no physical sign of any wreckage, this search is indeed daunting and may take many years.


About the author:

John Jamieson is a research scientist at GEOMAR – Helmholtz Centre for Ocean Research, in Kiel, Germany.  John obtained his B.Sc. in geology from the University of Alberta in 2002, his M.Sc. in isotope geochemistry from the University of Maryland in 2005, and his Ph.D. in marine geology from the University of Ottawa in 2013.  John specializes in the study of mineral deposits that form at hydrothermal vents (or “black smokers”) on the seafloor, and the development of technology and methods for submarine exploration.  His research has led to participation on several research cruises and projects in the Pacific, Atlantic and Indian Oceans.  He has twice dived in the ALVIN submersible on the Juan de Fuca Ridge in the NW Pacific to depths of over 2,000 m.  His research currently focuses on the use of autonomous and remotely-operated vehicles and their mapping capabilities to locate and understand the geological controls on the formation of mineral deposits on mid-ocean ridges.  He works with governments, international organizations and industry on aspects related to seafloor mining.

The author, on board the French research vessel Pourquoi Pas?, with the GEOMAR REMUS6000-class AUV “Abyss” which was used in the search for the Air France flight AF447 wreckage.

The author, on board the French research vessel Pourquoi Pas?, with the GEOMAR REMUS6000-class AUV “Abyss” which was used in the search for the Air France flight AF447 wreckage.

#AESRC2014 Highlights

Well, AESRC is done for another year and with it my role as co-chair of the organizing committee! Thank goodness for that! Hopefully, I can finally get some actual thesis related work done in the coming months…and maybe get back to blogging a bit as well. However, as grateful as I am that AESRC is done, I have to say that it was a fantastic conference this year with a host of terrific talks from keynotes and grad students alike.

As I mentioned in my conference opening post AESRC is the only conference in Ontario, maybe Canada for all I know, that is organized by and for graduate students. The entire organizing committee is composed of graduate students and all of the talks, with the exception of keynotes, are given by graduate students. AESRC is meant to be a place where new and experienced grads alike can talk about their work in a less nerve-racking environment. We encourage in progress research or research that does not even have results yet. The idea is that every graduate student can feel comfortable, practice presenting to an educated audience and hopefully enjoy themselves and meet their colleagues from across the province.

Logo2

This AESRC was by far the most well attended in the past 10 years, with over 100 delegates attending from 8 different universities. The conference kicked off with the Icebreaker at a campus pub, where we all got meet each other or reconnect in many cases, while watching hockey and drinking beer. A nice relaxing end to the week and prelude to the science of the weekend. On a personal note, it is always worth attending the Icebreaker at every conference I have been to. More often than not there is free food and drink, but it is a great opportunity to meet new people, spot that keynote you want to talk with and introduce yourself. I try to make of point of meeting at least one new person at every Icebreaker I go to.

Saturday started with some great talk on Environmental Geoscience (my session) and Sedimentology and Petroleum Geology. We had two keynote speakers on Saturday: Paul Mackay from the Canadian Society of Petroleum Geologists and Dr. Jack Cornett from uOttawa. The video of Jack’s talk is below.

Click here to display content from YouTube.
Learn more in YouTube’s privacy policy.


To summarize, in case you didn’t watch the entire video, Jack discusses the incredible range of radionuclides that are found naturally occurring on Earth and the vast range of geologic problems these nuclides can be applied to. He also talks about how we can use accelerator mass spectrometry to measure these radionuclides at incredibly low levels, which is how we are able to apply them to geologic questions. To illustrate this point Jack discussed the case study of chlorine-36 in the Cigar Lake uranium mine in Saskatchewan, Canada.

Saturday concluded with a fantastic dinner at the nearby National Arts Centre and another terrific keynote by Dr. Becky Rogala on the challenges of extracting bitumen from the oil sands and the importance of having an accurate understanding of the sedimentology to ensure maximum efficiency of SAGD recovery. There was also quite a bit of beer.

Sunday started nice and early with the Geophysics session as well as the Paleontology and Tectonics sessions as well. Our keynote for the geophysics session was Dr. Glenn Milne from uOttawa, who was an author on the most recent IPCC report and is an expert on sea level change.

Click here to display content from YouTube.
Learn more in YouTube’s privacy policy.


We also had another great keynote from uOttawa in the tectonics session in Dr. Jon O’Neil. The video of his talk on the oldest rocks on Earth (4.4 billion years old) is coming soon! That pretty much wraps up AESRC2014! It was a great weekend, there was lots of great science and I am really glad its over. I likely won’t be around for next year’s AESRC at Queens University (fingers crossed), however, I am sure it will be great.

IMGP1447

Yours truly giving his talk on iodine-129 fallout from Fukushima. (Photo: Viktor Terlaky)


The Most Epic Unboxing Ever

The Most Epic Unboxing Ever

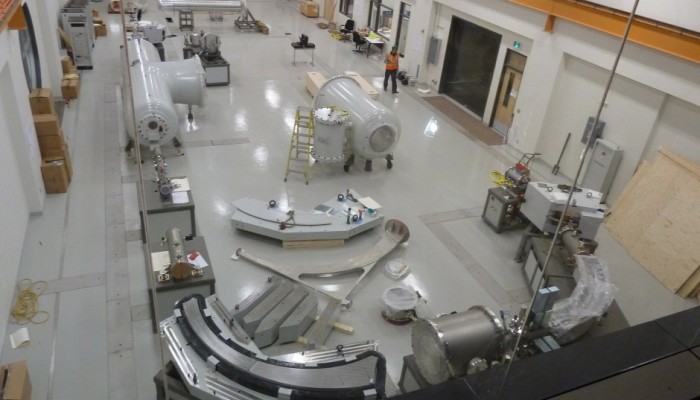
There is a strange phenomenon on the internet called unboxing. Unboxing is when a person receives a new package of something and takes a video or pictures of the process of opening it for the first time and posts it online.  Mostly, from what I can see, people “unbox” electronics or hockey cards or things of that nature. However, what I have today could be called the granddaddy of all unboxings; I have a series of photos of the unboxing and, initial stages of set-up of the University of Ottawa’s new, 3 million volt, accelerator mass spectrometer (AMS), which cost 5 million dollars. This takes opening your new laptop or that Sidney Crosby rookie card to a whole new level!!! The AMS will be housed in uOttawa’s new Advanced Research Complex.

The accelerator portion in its shipping container being transferred into our new building. (Photo: Dr. Liam Kieser)

The accelerator portion in its shipping container being transferred into our new building. (Photo: Dr. Liam Kieser)

P1030935r

Easy does it. Now pivot!!! (Photo: Dr. Liam Kieser

Since I am showing pictures of this incredible piece of equipment being installed I’ll explain a bit about what it is an how it is used as well. I use the AMS in my own work to analyze iodine-129, chlorine-36 and once or twice carbon-14. In short, tools that can be used for groundwater dating. However, the AMS is capable of analyzing for a huge range of isotopes and this allows its use a wide variety of disciplines from health science to homeland security.

The AMS works on the same principles and a regular mass spectrometer, but it has a few key differences that make it extremely powerful.

Untitled

P1030975a

Lots of boxes to open. (Photo: Dr. Liam Kieser)

P1040117a

Once the boxes have been unloaded the building begins. It is like building an IKEA desk, but somehow more… (Photo: Dr. Liam Kieser)

The process of AMS analysis begins with the preparation of the samples, which involves large amounts of lab time in extremely clean conditions. Contamination of samples with unwanted isotopes is a real problem in AMS so great care has to be taken to prepare good samples. The sample is then mixed with niobium powder and pressed into a steel cartridge. The cartridge then gets loaded into the ion source where cesium ions get fired at the sample like shooting a gun. The Cs ions physically break bits of the sample off the cartridge and these get negatively ionized and accelerated out of the ion source towards the first magnet. 

P1040128a

Xiao-lei carefully taking the glass rings that are in the accelerator. These are to kill any free electrons that could escape from the stripper canal as well as keep the ions on a stable flight path. X-rays charged to 3 million volts are very bad! (Photo: Dr. Liam Kieser)

P1040147a

The glass rings all put together with the stripper canal in the centre. The stripper canal is where electron get stripped off the negative ions turning them into positive ions as well as keeping the ions on a straight and even flight path. (Photo: Dr. Liam Kieser)

This is what the ion source looks like. Up to 200 samples sit in the big wheel waiting their turn. The AMS control room is those windows in the background.

2014-02-07 13.11.18

Our fancy new SO-110 ion source. (Photo: Matt Herod)

Once the samples leave the ion source they are accelerated to the first bending magnet which can bend an incredible range of masses. From tritium to plutonium tri-fluoride.

2014-02-07 13.11.43

The first magnet looking towards the accelerator. (Photo: Matt Herod)

The next step is firing the ion into the particle accelerator that carries a charge of 3 million volts! Inside the accelerator is a passage called a stripper canal that pulls electrons off the ions turning them from negative into positive ions. The reason for this is that this allows us to get rid of interferences that normal mass spectrometers face. For example, chlorine-36 has an interference with sulphur-36 making it impossible to analyse using normal mass specs. Actually, our AMS has another modification that makes 36Cl analysis possible on a 3MV machine, which is generally considered too small for this isotope. Usually, 36Cl needs a much larger accelerator however, our isobar separator for anions (ISA) allows this. Once the ion leaves the stripper canal it is accelerated at very great speed into the next magnet.

2014-02-07 13.10.31

Dunh, dunh, dunh. This is the A in AMS! (Photo: Matt Herod)

2014-02-07 13.10.57

This is the biggest magnet I have ever seen!! It is over 3m long and weighs 18 tonnes! This is why the room needs an overhead crane. (Photo: Matt Herod)

Once the ions are redirected and isotopes are further separated by the magnet they are ready to be analyzed in either the Faraday cups for the common isotopes or the gas ionization detector for rare isotopes.

2014-02-07 14.39.53

Me, touching the Faraday cups. (Photo: Laurianne Bouchard)

2014-02-07 13.10.39

The gas ionization detector. This bad boy literally counts atoms as they come around yet another magnet and through a silicon nitride window. Once they enter the detector which is filled with gas they ionize it which leads to pulses of electricity that are counted. This is the end of the AMS!!! (Photo: Matt Herod)

Once the atoms are counted in the gas ionization detector their trip around the AMS is over! It is quite a journey and full of positives and negatives (haha, a little pun there). Seriously, though this gigantic instrument is used to quantify the smallest of small quantities and can very literally count atoms. The AMS has a massive number of possible uses and I’ll likely be posting about these as this new facility starts to ramp up in the next few months. In addition to the AMS we also have an SEM, microprobe, stable isotope equipment, two noble gas mass spectrometers, ICP-MS, LA-ICP-MS, ICP-AES and a host of other MS’s as well. There will be very few types of isotopes that we cannot analyze for and this facility will be one of the best in the world for this type of geological research. Stay tuned for further developments as we start to move in soon!

Cheers,

Matt