EGU Blogs

Geochemistry

My EGU2013 (Tuesday)

Firstly, I am not actually attending EGU 2013 this year. However, that does not mean I can’t participate. In fact, it has been incredibly easy for to me join in, although I have had to wake up very early in the morning to make up for the time difference between Vienna and Ottawa.

I took part in two press conferences on Tuesday. The first called: The consequences of nuclear accidents: Fukushima and Europe and promised to be extremely interesting especially from my point of view as a researcher of environmental radionuclides. In fact, I was tuned in for more than just the EGU blogging part since I am in the midst of a project investigating the effects of Fukushima here in Canada and the transport of radionuclides from the accident. I intend to present the work at Goldschmidt later this year and write a publication on it which will comprise a part of my thesis.

The session was started by Dr. Yuichi Onda from the Centre for Research in Isotopes and Environmental Dynamics at the University of Tsukuba.

Dr. Onda and his group are studying the transfer and fallout of Fukushima radionuclides in every aspect of the environment. This is an incredibly daunting task. The infrastructure required to sample so many different environmental reservoirs is mind-boggling and Dr. Onda showed in several of his slides how tough it could be. The group sampled trees, soil, soil water, soil erosion, water in both cultivated and non cultivated environments, sediment in rivers and lakes as well as transport between these reservoirs and then finally the transport to the ocean from all of these sources. Basically, they set up one bad-a$$ monitoring network!

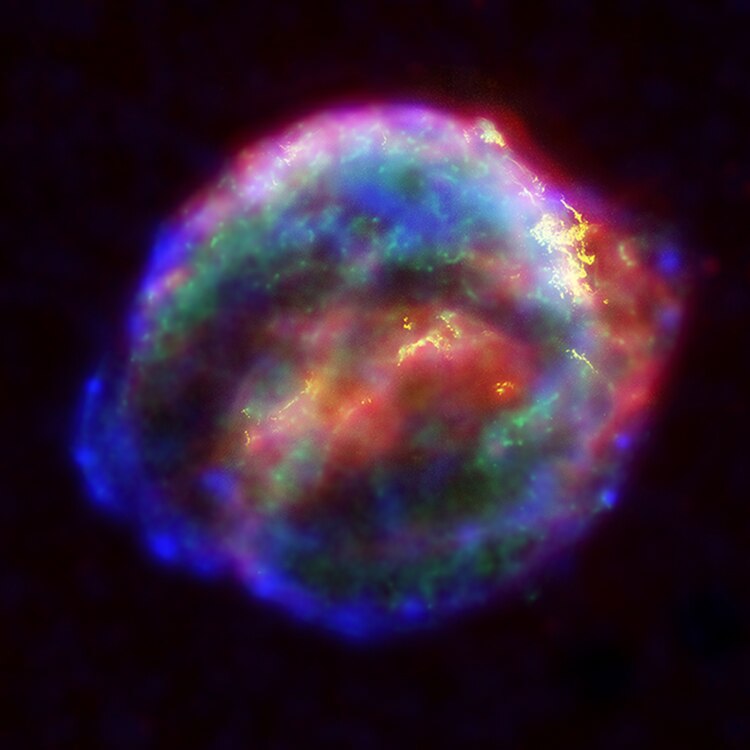
The conclusions from this network were that the deposition process of the radionuclides began by falling on trees but then over time washes off and between .2 and 3.5% of the fallout washes into streams and rivers where it is then transported to the oceans. In a very basic way it kind of looked like this:

File:HydrologicalCycle1.png

Source: Wikipedia

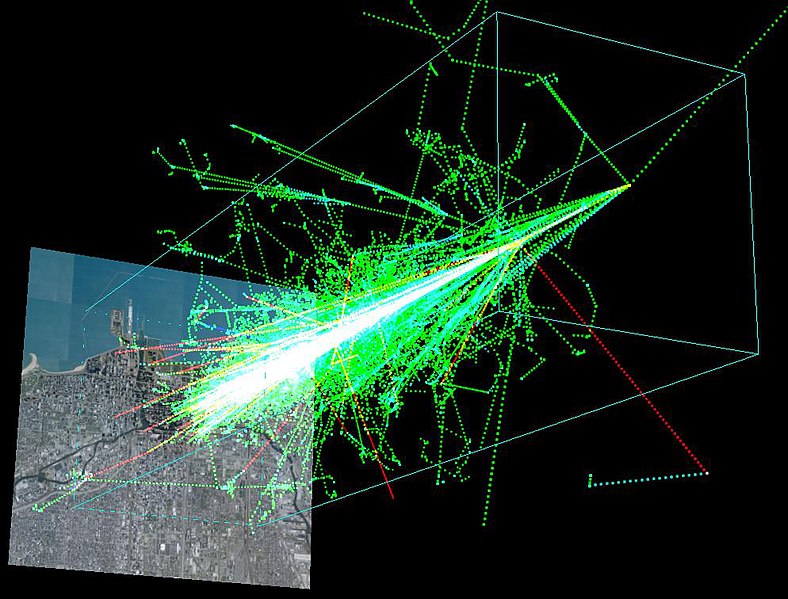
The next speaker was Dr. Kazuyuki Kita from Ibaraki University. He was explaining one step earlier in the whole transport process than Dr. Onda since Dr. Kita’s focus is on the atmospheric transport and dispersion of radionuclides from Fuksuhima. Basically, once the accident occured tons of radionuclides were released into the atmosphere and blown hither and yon until they are eventually deposited in rain or adsorbed onto aerosols and settle because of gravity’s relentless nature. They can also be re-suspended after the fact. This is particularly common with iodine (I know about this one…) Dr. Kita then went on to show a picture of the fallout of cesium-137 over Japan, which is pictured below. Furthermore, the measured concentrations agreed very well with the predictions made by atmospheric modelling, which is a tricky business at the best of time, but must be even more so when the entire world is breathing down your neck asking where will the radionuclides go? The difference were due to rainout, which is difficult to predict.

Slide from Dr. Kita’s talk showing the actual fallout vs. the modelled fallout.

Dr. Kita then went on to talk about the variation of radionuclides in the atmosphere over time following the accident  and the influence of re-suspension on radionuclides sitting on the land surface. He showed this graph which illustrates very clearly how 137Cs and 134Cs concentrations spiked following the accident and then declined over time. However, if you look in October you can see that the levels start to rise again, which Dr. Kita attributes to re-suspension. Furthermore, these peaks were coincident with the transport of air parcels from Fukushima as well making it certain that this was the source of the radionuclides. Another source of radionuclides since the disaster has been the re-emission of iodine and cesium from the ocean surface as well.

A slide from Dr. Kita’s talk showing the temporal trend in cesium fallout from Fukushima.

The final talk of the press conference was by Dr. Petra Seibert from the University of Vienna. Dr. Seibert, a meteorologist, gave a truly fascinating, yet somewhat scary talk about how prepared (or not) Europe is for nuclear accidents and the consequences they have with context from both Fukushima and Chernobyl. Dr. Seibert makes the point that despite ample opportunity to learn from our nuclear mistakes we have not addressed all of the deficiencies that exist.

Concerning Fukushima, Dr. Seibert points out that the dispersion of radionuclides from the nuclear plant is not simple and results in contamination outside of predicted zones. This means that the evacuation pattern of simply evacuating people in concentric circles depending on the distance from the plant is not a very effective way of ensuring that people are not affected since the atmospheric spread of radionuclides is not circular. Therefore, in order to be prepared for potential disasters a predictive model of dispersion is needed. Dr. Seibert has developed such a model and shows some of the incredibly variable, and somewhat artistic, results in the following image. The blank space shows a movie of a very complex dispersion.

A slide from Dr. Seibert’s talk showing the incredibly variable nature of radionuclide dispersion from a point source.

Dr. Seibert’s ultimate point is that despite what we have learned from Fukushima and Chernobyl we are not yet prepared enough to handle another large nuclear disaster. Indeed, she makes the point that one in Europe could result in continental scale contamination and that in order to prepare for this proactive measures like iodine tablets should be widely distributed. Furthermore, data distribution and communication between organizations and nations is not adequate as well, which would only serve to exacerbate the seriousness of a nuclear accident should one occur.

In my opinion to keys to avoiding another Chernobyl or Fukushima lies in open communication and learning everything we can from these two disasters. However, I put it to you, what do we still need to learn? What are our shortcomings when if comes to disaster preparedness. Do you agree with measures like iodine distribution in order to mitigate the risk from another accident or should we just cease nuclear energy production entirely?

I also tuned into the fantastic press conference on the Chelyabinsk meteorite fall, but Jon has covered it excellently so head over to his blog a for a summary of it. If you would like to watch the livestream of the press conference for yourself it can be found here: http://streams.h82.eu/EGU2013/index.php?modid=18&a=show&pid=206


It’s rainin’ isotopes…

This post is kind of a continuation of Laura Roberts excellent guest post on the Solar Storms and the Earth’s Magnetic field. However, this is a bit of a different spin on it. I am not writing about what get’s kept out, but rather what slips by the shield and gets in. Of course, I am speaking about cosmic rays and the wonderfully useful isotopes they produce that rain down upon us. Yes, it is literally raining isotopes…all the time! I know that this sounds weird, when I first learned about this phenomenon it came as a complete surprise to me. Not only are isotopes raining down all the time, but there is a lot that we can learn about our planet by analyzing these  amazing by-products of cosmic ray collisions.

What are cosmic rays?

Cosmic rays are incredible things. The Earth is constantly being bombarded by them and we are protected from this massive influx of extra-terrestrial radiation by our magnetic field and atmosphere, which deflects about 90% of the low energy cosmic rays. Check out last weeks awesome guest post about Earth’s magnetic field. There are two types of cosmic rays. Primary cosmic rays generally originate outside of our solar system and travel throughout space occasionally bumping into things like planets. In fact, it has only recently been discovered exactly where they come from. In February, 2013 a paper came out in Science called: Evidence Shows That Cosmic Rays Come From Exploding Stars that (surprise) stated primary cosmic rays are produced by exploding stars aka. supernovae in which an ancient star blows up, releasing massive amounts of energy, elements and cosmic rays!

File:Keplers supernova.jpg

Kepler’s Supernova (Source)

Primary cosmic rays are 99% protons and alpha particles (two protons and two neutrons) and the remaining 1% are the nuclei of heavy atoms or beta particles (electrons). These bits of atoms and radiation fly around in space and bang into everything. Sometimes, actually more often than sometimes, they bang into the Earth. In fact, they bang into the Earth a lot! There are billions of collisions every day. Some of the particles crashing into the Earth have low energies while others have high energies. The frequency that these low energy particles collide is many times greater than high energy ones. There are about 10,000 collisions per square meter per second for giga-eletronvolt particles. For the higher energy rays the rate of collision is less. They might arrive with a frequency of 1 per square metre per second, as is the case with tera-electronvolt particles. The decrease in collision frequency continues as energy increases up until the very highest energy of the exa-electronvolt which collides about 0nce per square kilometre per century.

When cosmic rays pass through the Earth’s magnetic field is when things start to get really interesting, from a geochemical perspective that is. When primary cosmic rays enter the Earth’s atmosphere they start banging into all of the molecules and atoms floating around up there and produce secondary cosmic rays. Basically imagine a bowler throwing a strike. The bowling ball represents the primary cosmic ray and the pins are the molecules in the atmosphere. When the ball collides with the pins they fly off in every direction, which is analogous to the process occurring constantly in our atmosphere. When this takes place in the atmosphere the collision is so energetic the molecules and atoms can actually break apart. This is called spallation and results in a cascade of neutrons, protons and atoms called an air shower.

File:Protonshower.jpg

A simulation of a cosmic ray shower formed when a proton with 1TeV (1e^12 eV) of energy hits the atmosphere about 20km above the ground. The ground shown here is a 8km x 8km map of Chicago’s lakefront. This visualization was made by Dinoj Surendran, Mark SubbaRao, and Randy Landsberg of the COSMUS group at the University of Chicago, with the help of physicists at the Kavli Institute for Cosmological Physics and the Pierre Auger Observatory. (Source)

What is produced?

Air showers produce all sort of radioactive isotopes that are formed no other way. Some are very short lived and decay away quickly, while others are extremely long lived and have half lives of millions of years, allowing them to accumulate in the environment.

A list of the major cosmic ray isotopes and their half lives. The ones in bold have geologic applications.

Other isotopes are produced when cosmic rays reach the ground and collide with minerals. This can cause other isotopes to form within the mineral crystal lattice. For example, the cosmogenic isotope, aluminum-26 is produced when a cosmic rays strikes a quartz crystal and transforms some of the silicon in the quartz structure into aluminum. These are referred to as in-situ cosmogenic isotopes.

The next part of the process concerns what happens to all of these isotopes once they have sprung into existence thousands of metres above our heads. The fate of these isotopes is varied and they all live in the atmosphere for a little while before becoming part of the hydrologic cycle. Eventually they fall down to Earth either stuck onto aerosols or incorporated into rain and begin to interact with water bodies, enter groundwater, stick to soil particles or get absorbed into people, plants or animals. Essentially, they begin cycling through the environment until they decay away. Since these isotopes get cycled through various parts of the environment we can use them as tracking tools to trace the pathways they take and learn about their interactions with other components of environmental cycles.

What is the use?

Cosmic rays isotopes are useful for more than just getting a good tan! In fact, the list of possible questions that can be applied to cosmogenic isotopes just goes on and on. I’ll just briefly cover a few of them since each one of these applications is a whole blog post by itself I’ll just give the highlights here.

Exposure age dating: Exposure age dating is one of the principle uses of cosmogenic isotopes and several different ones have been employed to this end. Exposure age dating is when we use cosmogenic isotopes to date how long something has been exposed to secondary cosmic rays at the Earth’s surface. For example, a rock at the toe of a glacier may have just been exposed to cosmic rays a year ago and its exposure age date will tell us this. Another rock, 20 metres further from the glacier toe may have been exposed 5 years ago and this difference will be recorded. Basically, the clock starts ticking once cosmic rays are able to reach the rock or bone, or whatever material is being dated. Exposure age dating has the power to date materials that range from only a few thousand years to millions of years depending on the half lives and concentrations of the nuclides in question. The way exposure dating works is that when a secondary cosmic ray impacts a rock containing Si (silicon) or O (oxygen) some of the neutrons on the silicon or oxygen are knocked off and the result is the production of aluminum-26 or beryllium-10 right in the mineral lattice. One common mineral that contains both silicon and oxygen is quartz. Quartz is pretty much everywhere and in everything, which opens the door for a wide range of materials that can be exposure age dated. All they have to contain is a bit of quartz. The decay of 26Al and 10Be allows the material to be dated. There are other isotopes that can be used for exposure age dating besides these two and other minerals that contain Si or O can also be used as well. The figure below shows the wide range of applications that exposure age dating can be applied to. For example, if you want to date a volcanic eruption it is easy to exposure age date the lava or ash, both of which have a lot of Si. It is also possible to date landslides, erosion rates, burial ages, the list goes on and on. There are many other isotopes that can be used as well besides 26Al and 10Be.

CLOUD Project: The CLOUD project is a CERN experiment that is investigating the possible linkage between cosmic rays and cloud formation. It has been hypothesized that cosmic rays can cause clouds to form by forming aerosols and it has been noticed by satellites that an increase in the cosmic ray bombardment can increase the amount of cloud cover. Cloud cover has a profound influence on the Earth’s energy balance and hence climate. It has been proposed that throughout geologic time changes in the cosmic ray flux have been responsible for climate change. However, proving this is difficult given the length of time in question and the evolving states of the cosmic ray flux and Earth’s magnetic field. However, CLOUD has set out to find the linkage between cosmic rays, clouds and climate if one exists.

Carbon-14: Carbon 14 is unquestionably the most used of any of the cosmogenic isotopes. It has applications in geology, archaeology, paleontology, anthropology, hydrogeology, and many other -ologies as well. 14C is produced primarily when neutrons collide with nitrogen in the atmosphere replacing a proton in the nitrogen nucleus and transforming it into carbon-14, although atmospheric nuclear weapons testing also produced a substantial amount of 14C. The primary use of 14C, or radiocarbon, is radiocarbon dating. Once radiocarbon is produced it enters the global carbon cycle and disperses throughout the environment. Since it is part of the carbon cycle it becomes incorporated into all living things, including people and animals. 14C continues to enter our bodies while we are alive. Once we die, there is no further addition of 14C and therefore, the clock starts ticking on its use as a dating tool. 14C has a 5,730 year half life and is therefore useful as a dating tool for biological materials up to ~45,000 years ago.

Cosmic rays are some of the most mysterious, yet useful phenomena on our planet and have allowed for incredible advances in many sciences. As new, more sensitive technology becomes available look for the use of cosmic rays and the isotopes they produce to accelerate as we find new questions they can be used to answer.

Cheers and thanks for reading,

Matt

The Truth about Radon

There are few things on Earth that evoke more fear than radioactivity. Most people’s response to radioactivity is one of immediate fear and confusion and I can’t say I blame them. There is something very frightening about a substance that shoots off invisible rays that can kill you if you’re exposed to enough of them. However, most people really don’t need to worry about being exposed to large amounts of radiation in their lifetimes. That said we are all exposed to radiation all the time. There is no escaping radioactive materials. They are in the food we eat, the water we drink and the air we breathe.

This constant exposure to radiation is called background radiation and there is simply no way to avoid it. The largest portion of background radiation comes from the radioactive gas, radon, which composes around 50-60% of our background radiation exposure. Radon is one of the most innocuous, yet ubiquitous radionuclides around and it is crucial that everyone be conscious that we all inhale some radon and what this means for our health.

The chemical symbol for radon (Source)

As with most things radioactive the first questions asked are: what is it and where did it come from? How does it behave in the environment and what does this mean for me and others (aka: is it dangerous)?

What is it and where does it come from?

Radon, chemical symbol Rn, is an odourless, colourless radioactive gas. In order to understand where radon comes from we have to discuss the radioactive decay of uranium, which is its source. Uranium is a radioactive metal that occurs naturally in almost all places on Earth. The major isotope of uranium is 238U. 238U comprises 99% of all uranium isotopes and has a half life of 4.47 billion years. One of the daughter products produced by the decay of uranium is radon.

Figure 1 shows the decay chain of Uranium-238, the most common form of uranium. Here α is Alpha radiation and β is Beta radiation

The decay chain of Uranium-238 (Source)

As the diagram above shows, the decay of 238U occurs over many, many years and there are several steps to be taken before radon is produced. There are two modes of decay shown in the diagram above: alpha and beta. Alpha decay is the radioactive decay process that occurs when the nucleus of a radioactive element ejects two neutrons and two protons (a helium nucleus). Alpha particles have a low penetration ability, but can be very energetic. This means that they cannot travel very far or through objects, but they have a high enough energy to be dangerous to living things when they are emitted very near them. Ingesting or inhaling alpha emitters is dangerous to people but, merely being in their presence is not as dangerous since alpha particles cannot penetrate skin. The other type of radiation emitted during the decay of uranium is beta. Beta decay involves the emission of an electron from around the atom and it is more penetrating than alpha radiation. Gamma radiation is also emitted at several steps in the uranium decay process.

As these alpha particles and electrons are emitted, the decay progresses and eventually radon is produced. The radioactivity that comes from radon when it decays into Polonium-218 constitutes an alpha particle that has an energy of 5.59 million electron volts, which is quite high.

How does radon behave?

The meaning of the question how does radon behave encompasses several other questions such as: how does it travel and how does it interact in the environment and where in the environment is it produced?

The noble gases. Notice radon is the only one sitting, because he is the heaviest. Haha, a little chemistry humour there. (Source)

Radon is a noble gas. This means it is very un-reactive in the environment and does not interact readily with other compounds or elements around it. This also means that in the environment radon travels all on its own and does not attach itself to other elements as a way to get around. This independent behaviour does not hinder the ability of radon to transfer from air to water and back again, in fact, radon transfers very readily between the two. As a gas radon is present in the atmosphere, in the gas trapped between soil grains, it can even be found dissolved in groundwater or surface water.

Up until now I have been taking it for granted that radon is in the environment, but I have not explained how it gets there in the first place. In order to do this we have to look for the uranium. Uranium is present ubiquitously throughout the environment. It is in soil, it is in rocks, it is in the oceans, it is even in lakes, rivers and groundwater. Of course, as we know, the decay of uranium produces radon and since there is uranium in pretty much everything radon can be produced from all of these places. The amount of radon produced is proportional to the amount of uranium present. And what controls the concentration of uranium in soil and rocks? The geology. I have included a table below showing average concentrations of uranium that one might expect to find in different bedrock types. As you can see they vary wildly from massive concentrations in an ore body, where the radon is practically pumped out of the rock to groundwater, which in carbonate sedimentary regions has almost no radon. Obviously there are lots of exceptions to these situations, but they do provide a general guideline from which to base predictions about the amount of radon that we might find in a house built on any of these rock types. Indeed, it is possible to predict, based on the bedrock alone, whether or not a house is likely to have elevated radon levels in the soil or groundwater. These are not hard and fast rules since so many other factors can affect the radon concentration in a house at any given time such as humidity, air pressure, temperature, etc, but they are at least a starting point.

Material Concentration (ppm U)
High-grade orebody (>2% U) >20,000
Low-grade orebody (0.1% U) 1, 000
Average granite 4
Average volcanic rock 20 – 200
Average sedimentary rock 2
Average black shale 50 – 250
Average earth’s crust 2.8
Seawater 0.003
Groundwater >0.001 – 8

(Source)

Is radon dangerous?

The short answer to this question is: yes, radon is indeed dangerous. The why, how are we exposed and what can we do about it are a bit longer. As I mentioned above radon is an alpha emitter, meaning that it is only dangerous when we are in very close proximity to it or it has been ingested or inhaled. Furthermore, once in our body the radon will continue to decay and produce other daughter products such as 214Pb and 214Bi, which are also highly radioactive and very dangerous. The unfortunate thing is that it is very easy for us to inhale radon making it extremely dangerous. In fact, it is estimated that ~10% or more of lung cancers are caused by radon inhalation, making it an extremely serious threat to human health.

Radon accumulates in confined spaces such as in our houses or other buildings, particularly in basements as radon is heavier than air. In the open air there is no threat from radon, however, Canadians and many other northern cultures spend a great deal of their time inside, especially during winter (it is  -20 with wind chill as I write this). This is a major concern as all of this time spent indoors can greatly increase radon exposure.

So how does radon get indoors and why does it accumulate there? Firstly, radon can enter our homes through two main pathways. It can come in as a gas through holes in our basements, sump pumps, windows… essentially any place where our homes are connected to soil or rock, it will even diffuse through walls with ease. It can also enter in our water, especially if we use groundwater. Once radon is dissolved in water it needs to interact with air in order to leave the water so a perfect place is our taps, and showers which cause air-water interaction and force any radon dissolved in the water to de-gas.  The source of radon for our homes has to do with the type of soil and bedrock where we live. If there is lots of uranium in the soil or bedrock our homes are built on then there will be lots of radon produced as well. Radon also tends to accumulate in basements by dint of its large mass. It is by far one of the heaviest components of air and therefore tends to sink.

how radon enters a house

Pathways that radon can take to enter a house (Source)

In Canada the Health Canada limit for radon in air is 200Bq/m^3. Here is a map showing where radon exceeds this level in Canada.

Figure 2.

Radon map of Canada showing the percentage of dwellings above 200Bq/m^3 (Source)

The figure shows a mean 222Rn emissions map from soil for 2006. Since I now blog for the EGU I thought I should include a Europe version as well. (Source)

Happily, there are lots of simple remedial actions that you can take to get rid of radon. These generally constitute plugging access point and installing ventilation from the basement so that the air pressure in the basement is greater than outside and the radon will not migrate into the basement. Radon test kits are also readily available in most hardware stores so that you can test the radon levels in your home yourselves.

Case Study: My undergrad thesis….

Radon is not all bad though. There are uses for it too…there is always something. One of my first summer jobs in the geology industry was as a hydrogeology field assistant for a professor of Civil Engineering who specialized in the ridiculously complicated field of fractured bedrock hydrogeology. I worked for several of his grad students during the summer and one, who is now a professor at McGill University, was looking at radon concentrations in the groundwater and surface water of a local watershed.  He was looking to see if it was possible to trace and quantify groundwater discharge into surface water using radon.

This project then led me to propose a radon in water investigation for my honours project, although the aim was a bit different. I was looking to see if radon could be used as a tracer of radioactive waste in groundwater and surface water. I was working in Port Hope, Ontario at a low-level radioactive waste site and sampling the adjacent creek and installing some mini-piezometers. I have added the abstract below so you can see what I found. Long story short though, radon was elevated in both surface and groundwater although not where I expected it to be.

Port Hope, Ontario is home to 1.5 million cubic metres of low-level radioactive waste. This waste decays to produce the noble gas radon. Radon can be used as a tracer of waste migration in groundwater and surface water. In this experiment radon was sampled in a creek adjacent to a waste site in order to determine if elevated radon was produced by low level radioactive waste and if it could be found in water. Previously measured dissolved uranium concentrations were also used to determine if uranium and radon were linked in surface water. Background levels of radon in an uncontaminated local river was 18.1 +/- 6.28 pCi/L. Radon in water was detected in the field using a radon-in-air analyzer with an alpha spectrometer and outfitted to analyze water samples. The water samples were placed in a sealed chamber and forced to degas. This gas then entered the radometer and was analyzed. Elevated radon levels were detected along the length of the creek with the highest readings being 115 pCi/L upstream of the waste site and progressively dropping along the reach to a low of 45 pCi/L due to degassing. The trend in the radon was opposite to the trend in the uranium data with a high of 0.032mg/L adjacent to the waste site and a low of 0.017mg/L upstream at the same point of highest radon. The source of the radon is therefore hypothesized to be previously contaminated groundwater entering the creek at a point upstream of the waste site. The source of the uranium is solid waste that is present in the creek as well as aqueous complexes that have undergone redox transformations in organic mud present at the waste site. The flow of the creek is too fast for radon and uranium to achieve equilibrium. Therefore, these two contaminants are not linked in this system. This has implications for understanding the movement of uranium and radon in natural systems and how they may be related in nature from a hydrogeological and geochemical perspective.

By the way, in case you were wondering 1pCi/L is equivalent to 37Bq/m^3. Therefore a measurement of 115 pCi/L is 4,225 Bq/m^3. Remember, this is in water though so the transfer to air changes things a lot.

Links:

Health Canada:

http://www.hc-sc.gc.ca/ewh-semt/radiation/radon/index-eng.php

Canadian Nuclear Safety Commission:

http://www.nuclearsafety.gc.ca/pubs_catalogue/uploads/February-2011-Radon-and-Health-INFO-0813_e.pdf

Matt

Note: This post was previously published at my pre-EGU blog Geosphere on March 4, 2011. Although several changes and new sections were added to this post.

Fun with PHREEQ at Red Creek

Most freshwater on earth is not that highly saturated with dissolved metals or minerals. However, there are exceptions to be found all over the world from natural acid rock drainage to the alkali springs of Jordan. If the concentrations of dissolved metals are high enough the water can be toxic. For example, water draining from gold mines is often very high in arsenic and must be contained and cleaned. It is incredibly important to understand what will happen to these dissolved ions because they have profound implications on the health of the environment and people. Water like this can occur naturally or due to mining, deforestation, or other human industrial activities.

One tool that we can use to understand water and what is happening to the dissolved metals and minerals is the geochemical modelling program called PHREEQC a.k.a PHREEQ (pronounced freak) to those in the business. PHREEQC is pretty much the industry standard amongst geochemists for modelling the composition and behaviour of dissolved ions and minerals in water and every aspiring geochemist has to be familiar with the basics of the program and what the information it provides is telling us. PHREEQC is a quick, easy and free way to do a huge number of tedious calculations really, really quickly. Yep, that’s right, it’s free on the USGS website, which is another great thing about it.

PHREEQC works by taking the concentration of ions in water such as calcium, sodium, sulphate, etc and calculating the concentration of these ions that actually participate in geochemical reactions at certain temperatures, pressure, salinities, pH’s and redox conditions.   Once we know these values PHREEQC then calculates how much of these ions and the minerals that they combine to form are dissolved in the water and if they will precipitate out of solution to form actual minerals. It can do a lot more than this as well such as incorporate isotopes, model ion-ion interactions, ion-surface interactions, etc.

For this post I thought it might be interesting to show the PHREEQC output from one of the creeks that I sample called Red Creek and it is a bit of a weird one. Red Creek is located in the central Yukon and the most notable thing about it is the colour of the water and the rocks around it.

A view of Red Creek. Note the milky coffee colour and the red stained rocks. (Photo: Matt Herod)

Close up of a very iron stained rock. (Photo: Matt Herod)

As you can see the rocks around Red Creek are red and black. They are shale and are loaded with all sorts of interesting elements, particularly iron. In fact the iron concentration in this water is about 3 ppm, the nickel and zinc values are 0.3 and 0.9 ppm respectively and the sulphur concentration is a whopping 340 ppm. These numbers are all way out of the ordinary for the rest of the creeks I sampled throughout the Yukon. In fact, the Fe, Ni, and Zn values are at least 10 times higher than anywhere else! WOW…(did I just find a new mine?…I wish)

—————————-Description of solution—————————-

pH = 6.790
pe = 4.000
Activity of water = 1.000
Ionic strength = 1.170e-002
Mass of water (kg) = 1.000e+000
Total carbon (mol/kg) = 2.435e-004
Total CO2 (mol/kg) = 2.435e-004
Temperature (deg C) = 25.000
Electrical balance (eq) = 2.563e-004
Percent error, 100*(Cat-|An|)/(Cat+|An|) = 2.15
Iterations = 10
Total H = 1.110128e+002
Total O = 5.552116e+001

I have included some of the highlights for what is called the saturation index. Basically this number tells us if a mineral is under-saturated in the water, meaning it will stay in solution or over saturated, meaning it will precipitate. If the number is negative the mineral is undersaturated and will not precipitate and if it is positive it is over saturated and will. In Red Creek there are hundreds of mineral species that are undersaturated and only a handful that are oversaturated. I have listed the oversaturated ones below. Some of these numbers are super high such as magnetite and hematite, which are clearly  the ones precipitating on the rocks.

Barite — 0.47 — BaSO4

Fe(OH)2.7Cl.3 — 6.54

Fe(OH)3(a) — 1.89

Fe3(OH)8 — 2.35

Goethite  — 7.78 — FeOOH

Hematite — 17.57 — Fe2O3

Maghemite — 7.17 — Fe2O3

Magnetite — 18.83 — Fe3O4

ZnSiO3 — 1.12

Red Creek is obviously a pretty wild place geochemically and the PHREEQC modelling opens the door for us to interpret it. There is a lot going on and one has to ask, where did all of the high concentrations of these metals come from? Well, in this case the question is a fairly easy one to answer. All you have to do is look around at the bedrock.

Some nicely bedded, overturned shales in the Red Creek region (Photo: Matt Herod)

The local bedrock is black shale, a rock that is notoriously full of metals due to is high organic content. Red Creek is fed by springs issuing from the shale  and the groundwater, which has had moved from its recharge point to discharging in the creek, has had time to leach metals from the rock.  The water gets so loaded with metals from the bedrock that it carries them along as minerals in suspension as well as dissolved, which is why the water is that weak coffee colour. Actually, when the spring emerges from the shale the water is not white/red. It is, in fact, black!!! And I mean jet black. This is because it is loaded with reduced iron in suspension. Once the iron oxidizes at the surface it turns red. Futhermore, there is so much sulphur in the water that elemental sulphur often precipitates around the springs and the reduced, and highly toxic form of sulphur, hydrogen sulphide gas is bubbling out of the water as well because of the massive partial pressure difference in H2S in the atmopshere versus the water. What a wonderful place for a geochemist!!

A spring coming out of the shale near Red Creek. Yes, that water is black!!! (Photo: Matt Herod)

Places like Red Creek have interesting geochemical stories to tell. In this case the dissolved metals are naturally occurring and no one lives in the area so no remedial action is necessary to make the water drinkable. However, water like this has major impacts on the life that can survive in the region and in the creek. Indeed, natural places like this are home to a wide variety of life that has adapted to survive and flourish in these harsh conditions that are found in very few places on Earth and we can learn a lot about life on our planet and potential life on others from places like Red Creek. However, if such a water body was the result of mining operations it is absolutely necessary that it be treated lest is thoroughly contaminate the local environment with heavy metals such as arsenic or mercury. It is the geochemists responsibility to ensure that places like this are understood so that when remedial actions are necessary the lessons learned from natural places can be applied.

Hope you enjoyed this geochemical adventure to Red Creek!

Cheers,

Matt

Some nicely stained shale showing the high water mark in the spring at Red Creek. (Photo: Matt Herod)