After the UK’s wettest winter since 1910, spring has sprung with several warm and clear days in March so far. High pressure has been the dominant meteorological situation, which has seen clear skies during the day and cold nights, with fog settling overnight and continuing into the morning. While the high pressure and much reduced rainfall has brought much needed respite to those affected by the severe flooding during the winter, it comes with a sting in the tail in terms of air quality.
Surface pressure analysis chart for midnight on the 14th March 2014. Source: Wetterzentrale.de and the Met Office.
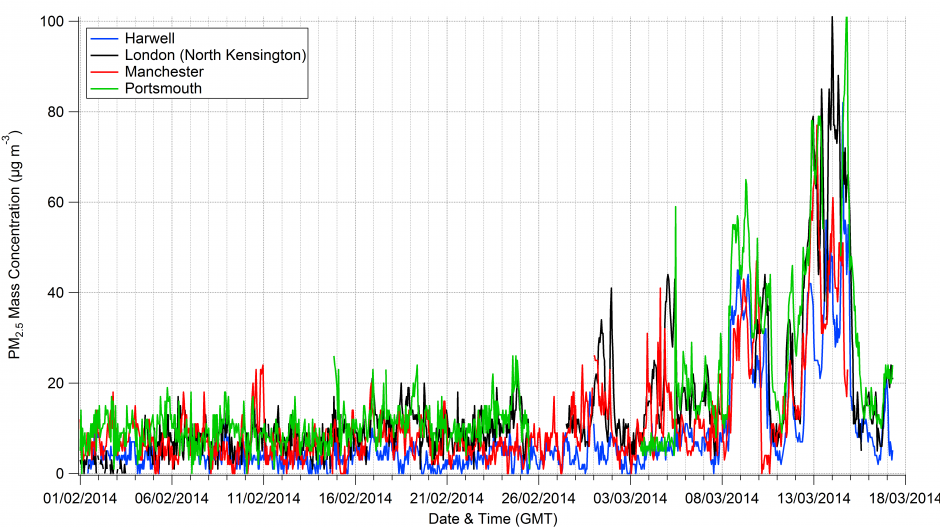
This is illustrated on the graph below, which shows hourly aerosol mass concentrations from four sites in England from the beginning of February through until 0800 on the 14th March. Throughout February, the concentrations were relatively low at the four sites. Once we move into March, there are periods of increased aerosol concentrations lasting a few days at a time.
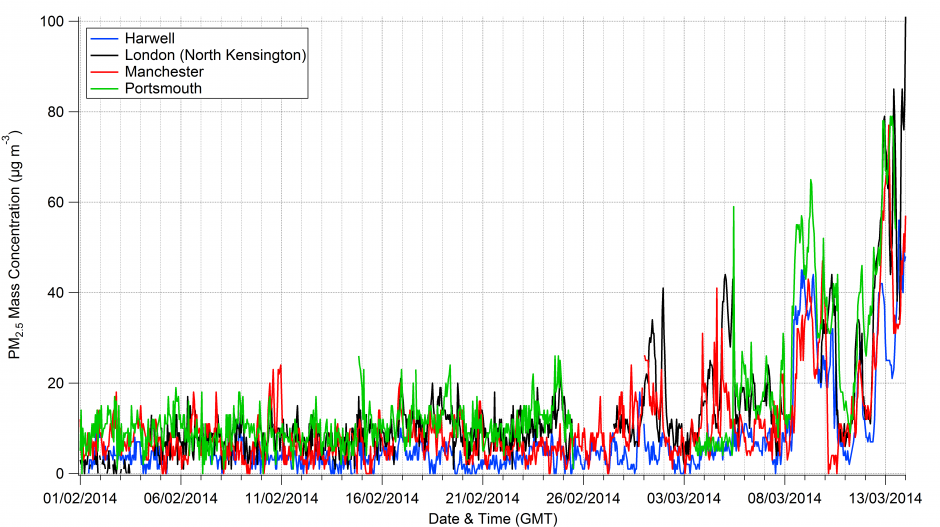
Aerosol mass concentration expressed as particulate matter with a diameter of less than 2.5µm from four air quality monitoring stations in England during February and March 2014. Data source: UK-Air.
The interesting thing about the past week has been that the concentrations have risen at all of the sites. While Manchester, London and Portsmouth are likely to have a large contribution from more local urban sources, such as cars, Harwell is in Oxfordshire and is less influenced by such sources. This suggests that the pollution event is also regionally driven. The meteorological situation recently has led to air from mainland Europe being blown across the UK and this air is likely contributing to the pollution situation.
This is typically a strong driver of regional pollution episodes in the UK, as easterly or southerly winds bring pollution from the continent to the UK, which exacerbates more local pollution problems. My PhD research focussed a lot on this very phenomenon; a couple of open access papers I wrote are available here and here. We found that such periods were often associated with enhanced concentrations of ammonium nitrate aerosol, which forms due to a combination of urban and agricultural emissions.
I suspect that this particular species of aerosol will be playing a role in the current pollution episode.
————————————————————————————————————————————————-
Update: 17/03/14
A change in the weather over the weekend brought stronger winds over the UK, helping to disperse the build-up of pollution. This saw a large decrease in pollution levels over the UK, as seen in the updated graph below.
Aerosol mass concentration expressed as particulate matter with a diameter of less than 2.5µm from four air quality monitoring stations in England during February and March 2014. Data source: UK-Air.
In terms of what next for the pollution, the answer is blowin’ in the wind.
————————————————————————————————————————————————-
Air quality data acknowledgement
© Crown 2014 copyright Defra via uk-air.defra.gov.uk, licenced under the Open Government Licence (OGL).