EGU Blogs

Polluting the Internet

Pioneers of aerosol science: John Aitken

One fundamental point on which we have at present little information of anything like a definite character is as to the number of solid particles present in our atmosphere. We know that they are very numerous, and it seems probable the number varies under different conditions of weather; but how many particles are really present under any conditions, and how the number varies, we have at present very little idea.

The above quote dates back to 1888 from a paper by John Aitken entitled “On the number of dust particles in the atmosphere” from Knott, 1923 (Collected Scientific Papers of John Aitken). With the IPCC report due out over the comings days, the level of uncertainty relating to aerosol particles will fall under the spotlight. The advances since Aitken wrote the above passage have in many instances been driven by the continuation of the theories and observations of this giant of aerosol science. While Aitken was not the first to directly measure aerosols in our atmosphere, he did pioneer their systematic observation in a range of locations in both the UK and continental Europe.

Aitken established some of the fundamental principles of aerosol production and their vital role in cloud formation. If you cast your mind back to geography classes in school, you’ll perhaps remember that cloud formation is summarised as a process involving cooling, which promotes condensation, which then results in the formation of clouds. However, this leaves out a crucial ingredient required for that condensation process to occur – aerosol particles.

Blah.

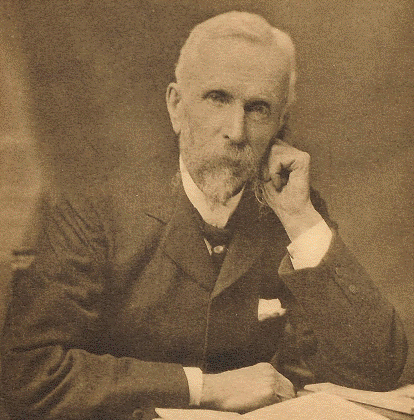
John Aitken (1839-1919).
Source: International Aerosol Research Assembly.

Aitken performed a number of experiments, including a version of the cloud in a bottle demonstration, to investigate cloud formation. He showed that water vapour will not condense to form a liquid cloud droplet in the atmosphere without a surface being present. In the same way that water drops form on a bathroom mirror after you’ve had a shower, cloud droplets require a surface in order to condense; aerosol particles form their initial seed. Aitken typically referred to aerosol particles as “dust” and in his paper “On Dust, Fogs, and Clouds”, he concluded that:

If there was no dust in the air there would be no fogs, no clouds, no mists, and probably no rain.

Aitken also established that this process would be dependent on the size of the seed aerosol particle; larger particles form cloud droplets more easily than smaller ones. He also suspected that the chemistry of the particles themselves played a role, with some types of particle forming better seeds than other. The role of particle size and chemical composition in cloud droplet formation is one of the most challenging aspects of modern aerosol science.

By exploiting these fundamental principles of aerosol science, Aitken was able to develop instruments that were capable of counting the number of aerosol particles in our atmosphere. The most common method used today is built upon the same basic premise as his early instruments. Aitken constructed an instrument with a section where the water vapour was supersaturated but contained no aerosol particles. This “supersaturation” means that the air is ripe for forming a cloud as there is a plentiful supply of water available to condense once a suitable surface is present. He then introduced aerosol particles from the air into this section, causing the water vapour to condense onto the particles. By doing this, Aitken was able to make the invisible (as far as the human eye and conventional analytical techniques was concerned), visible. This meant he could count the number of particles that had grown and establish how many particles were present in our atmosphere.

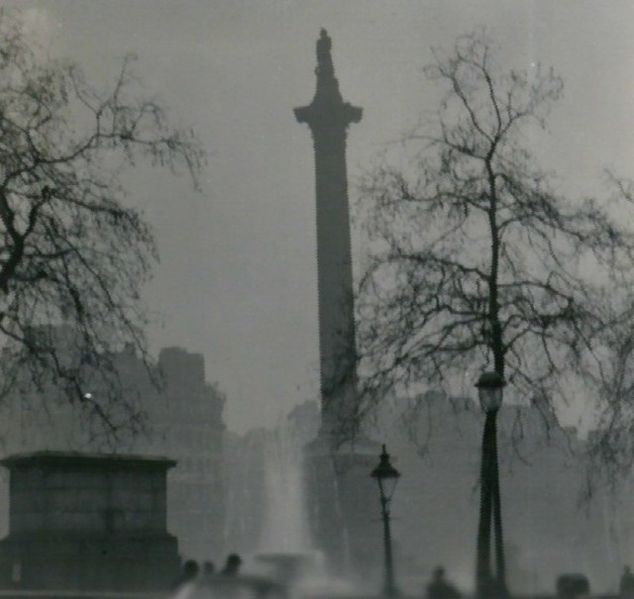
Nelson’s Column during the Great Smog of 1952. Aitken identified the role of sulphur emissions from coal in the formation of London smog in 1880 and suggested that a restriction on the amount of sulphur in coal be put in place. Source: J T Stobbs, Wikimedia Commons.

Aitken referred to these particles as “condensation nuclei” and he took versions of his instruments into the field to study their concentrations. He performed a series of studies in Scotland, which showed that the concentration varied from 500 to 3,000,000 particles in each cubic centimetre (a portion of air roughly equal to the size of a sugar cube). He performed measurements in France, Switzerland and Italy also and combined this information with measurements of weather variables such as temperature, humidity and wind direction and speed. He collected more than 1500 measurements and illustrated the role that high-pressure weather systems played in enhanced aerosol concentrations. He also identified the role of sulphur emissions in London with the dense smog that formed during winter, which gave rise to the famous “pea-soupers”.

Aitken’s contribution to aerosol science is encapsulated in the awarding of an entire size class of aerosols to his name – particles with a diameter less than 100 nanometres are known as Aitken nuclei. These particles are described as the building blocks of atmospheric aerosol particles, with their growth to larger sizes being hugely important for estimating the impact of aerosol particles on our climate. This is a fitting tribute to a scientist who served as the foundation for modern aerosol science, who was capable of remarkable modesty in relation to his work.

Much, very much, still remains to be done. Like a traveller who has landed in an unknown country, I am conscious my faltering steps have extended but little beyond the starting point. It is with reluctance I am compelled for the present to abandon the investigation. It is, however, to be hoped it will be taken up by those better fitted for the work.

John Aitken: “On dust, fog and clouds” (1880) from Knott, 1923.

 ————————————————————————————————————————————————————————————————————————————

This post is for a geoscience blog carnival called The Accretionary Wedge, which is being hosted by Matt Herod and you can see the call for posts here.

Biomass burning birthday

Last September I spent a month in Brazil for a research project aiming to study the pollution produced by deforestation fires in the Amazon Basin. The fires are mainly started by people for agricultural needs or land clearing for buildings and infrastructure. These fires produce huge amounts of smoke that blanket vast regions of South America during the “dry” season, which can lead to significant affects on weather, climate and people’s health. The name of the project was SAMBBA (South American Biomass Burning Analysis) and I’ve written a little about it previously here. There are several aspects to the project but my major role was on board the Facility for Airborne Atmospheric Measurement’s BAe-146 research aircraft. I was a mission scientist, which basically means I get to tell the pilots where to fly (subject to standard aircraft operating procedures like avoiding mountains, severe storms and not running out of fuel).

The Amazon usually conjures up images of pristine rainforest and giant meandering rivers but in the quest for air pollution, we were based in Porto Velho, which is the capital of Rondonia – a global poster-child for deforestation. Recently, a project involving Google, the U.S. Geological Survey (USGS), NASA and Time published an extraordinary series of satellite images from the Landsat program showing how the surface of the Earth has changed since the program began in 1984. One of the areas highlighted was Rondonia and the images showed how dramatically the landscape has changed over several decades. While deforestation began there in the 1970’s, the changes detailed in the images from Landsat are clear to see and are shown below. In 1984, the typical ‘fish-bone’ pattern of deforestation is already evident as pathways into the Amazon rainforest are cleared and tributaries of fire branch out from these. By 2012, the deforestation has spread out to envelop large swathes of areas that were previously rainforest.

Comparison of deforestation of part of the Amazon rainforest in Rondonia state, Brazil from 1984 and 2012. The area pictured is to the south and south-east of Ji Parana and covers an area of approximately 60 x 120 miles. Images are from Google. An interactive version where you can expand the view and also visit other areas of the globe is available here, which is worth doing as it gives a feel for the scale over which the deforestation occurs.

This tweet by the EGU twitter account reminded me that it is a whole year since one of our most successful flights of the campaign, which took place in Rondonia. The image below shows the view of the fire we flew through from a satellite, with the smoke plume extending over 80km downwind and also a side-on view of the fire that I took from the aircraft. The fire was to the south-west of Porto Velho in a protected area, where you wouldn’t usually expect to see fires. After travelling to the home of deforestation in Brazil, the largest fire we found was actually a wildfire!

Satellite (top) and side-on view taken from Bae-146 research aircraft (bottom) of a large fire plume that was sampled in Rondonia on 20th September 2012 during SAMBBA. The red line overlayed on the satellite image is 80km long, with the fire plume visible to the left of the line. The satellite image is from NASA’s Terra mission.

The key thing we were trying to investigate during the flight was how the properties of the smoke plume changed as it blew downwind. This is the crucial intermediate step between the actual initial conditions on the ground where the fire starts and the regional build up of smoke haze that affects weather and climate. To do this, we performed a series of flight patterns including:

  1. Flying across the plume at regular intervals along the length of the plume e.g. above the fire, 20km from the fire, 40km from the fire etc.
  2. Flying directly up the length of plume, which is a particular challenge for the pilots as the plume doesn’t generally follow a straight line and you can’t actually see anything.

With these measurements, we can can compare how the properties of the smoke change with distance from the fire. We can combine this information with measurements just a few hundred metres above the fire, as well as flights in older regional pollution to understand the entire life cycle of fires in this region and compare it with other types of fire in various areas of the globe.

We’ve been working hard over the past year analysing the data from this flight and all of the other SAMBBA flights and hopefully there will be much more of the actual science story to tell on this over the next 12 months and more. Stay tuned.

Smoky summers

The past summer has seen a great deal of media coverage of fires burning across the globe. When I consider what to write about for the blog, it has often been difficult to avoid commenting on yet another instance of a fire burning somewhere. This has been especially difficult given my current research project investigates biomass burning aerosol from deforestation and agricultural fires in Brazil. Fire and smoke is often dangerous and can have devastating consequences, however, the imagery available via satellites, scientific missions and the media is often breathtaking and they are fascinating for someone who thinks a lot about how these things evolve.

The huge number of man-made fires on the Indonesian island of Sumatra earlier this summer highlighted the impact of fires on air quality and human health, as vast plumes of smoke shrouded Singapore in a thick record-breaking haze. Another batch of fires were burning there in the August 22-27 period, although the wind conditions were more favourable for Singapore on this occasion. Europe has also had its share of fires, with Portugal being particularly affected in late August by wildfires and Russia saw extensive man-made agricultural fires in the Spring. South Wales has also seen several grass fires, including the Glyncorrwg fire in June, which I wrote about here. Australia is the latest region to hit the headlines, with the fire season igniting early around Sydney. South America and Southern Africa have also seen numerous fires that vastly outnumber those currently burning in the USA and Europe. I’m planning to write a separate post on these in due course.

Fire in the Taco Bell

The region that has garnered the most media attention is the USA, where numerous wild fires have burnt their way through many areas, furthering concerns around fire management and potential links with climate change. I’ve written previously about the impact of wild fires on Rocky Mountain National Park, which I saw first hand in July. The latest major event is the Rim Fire in the Sierra Nevada, which is currently 80% contained and is at present the largest fire in the 2013 season. The scale and impact of the fire has led to some incredible imagery of the fire and the extensive smoke plume emanating from it. The progression of the fire through a sequence of night-time images put together by the NASA Earth Observatory is quite incredible.

Blah.

Image of the Rim Fire and the plume of smoke produced by it from 31st August 2013 from the Moderate Resolution Imaging Spectroradiometer (MODIS) instrument on the AQUA satellite. Image courtesy of the NASA Earth Observatory. Click on the image for a larger view.

One of the things that struck me when reading about the recent erroneous reporting of an ‘Indian Summer’ in the UK was the association of the term with smoky or hazy conditions in the USA. Apparently, the earliest known usage of the term dates to the 18th Century and the link with Native Americans may also have been directly related to the benefits of the hunting season occurring during such a hazy period. The potential major cause for such haziness, bearing in mind this is prior to large scale industrial combustion, may very well have been smoke from fires. This would fit in with the natural wildfire season in the USA or man-made burning to create/accentuate any hazy conditions by the Native Americans themselves. Fires have been with us throughout history, with some impressive research illustrating how the numbers of fires has changed over millennial time scales e.g. this paper by Tom Swetnam, which is covered by Science Daily here.

Intervention

The fires in the USA have led to several pieces on the role of wildfires in these environments, with scientists and journalists highlighting the potential ecological benefits of the Rim Fire in particular. Wildfires are not a new phenomenon, although there are concerns that there are a greater number of the large, intense fires like the Rim Fire, rather than a collection of smaller fires. This was noted in this piece by Brandon Keim for Wired:

Fire is a natural, inevitable phenomenon, and one to which western North American ecologies are well-adapted, and even require to sustain themselves. The new fires, though, fuelled by drought, a warming climate and forest mismanagement — in particular the buildup of small trees and shrubs caused by decades of fire suppression — may reach sizes and intensities too severe for existing ecosystems to withstand.

What is clear is that wildfires are a natural part of our landscape but there are genuine concerns about how human activities are changing their intensity and frequency.

The dual nature of fires in the Earth system is probably best summed up in this piece by John Fleck, where he interviews Tom Swetnam:

“Is fire good? Is fire bad?” Swetnam asked. “Yes. Both.”

Aerosols from space #1

A short post to illustrate the changing nature of aerosol in the atmosphere in terms of their spatial extent, source and properties. There are two images below showing the scene from the TERRA satellite as it passed over the Eastern Atlantic off the coast of Morocco. The first image shows the plume of smoke from wildfires from Madeira that swept through the island last weekend. The second image shows dust over the ocean that has likely originated from the Sahara Desert.

Image of the smoke plume from Madeira on 17th August 2013 from the Moderate Resolution Imaging Spectroradiometer (MODIS) instrument on the TERRA satellite. Image courtesy of NASA. Click on the image for a larger view.

The smoke plume is quite well defined and doesn’t cover a large geographical extent. Typically, smoke plumes are dominated by small particles (less than 1µm) with very large concentrations in the plume. As the plume blows downwind it quickly mixes with the cleaner air in the region and is diluted by this mixing process in the same way that you mix cordial with water to make squash. At the closest point to the fire, the plume is like mixing the cordial with a glass of water, whereas downwind you are progressively mixing the same amount of cordial with more and more water (e.g. a bathtub, a swimming pool, a lake). Eventually you won’t be able to make out the smoke plume visibly although that doesn’t mean that it isn’t still around – you probably need some sophisticated instruments to pick it out of the atmosphere.

Image of the dust plume on 20th August 2013 from the Moderate Resolution Imaging Spectroradiometer (MODIS) instrument on the TERRA satellite. Image courtesy of NASA. Click on the image for a larger view.

The dust plume on the other hand has a much greater geographical extent due to the much larger source region. The dust is emanating from a much larger area as high winds pick up dust from the desert and cast it into the atmosphere. In contrast to the smoke, dust plumes usually contain relatively more larger particles (for aerosols), with sizes often greater than 1µm extending up to around 100µm. In aerosol parlance, such particles are referred to as ‘coarse’. These particles generally can’t be transported as far as the smaller particles as they fall out of the atmosphere more easily. However, Saharan dust is famous for bucking this trend as it has been observed to traverse the Atlantic Ocean and reach the Amazon Rainforest. It can even make it to the UK!

These are just a couple of examples of how we can observe aerosols from space. The above are just visible images but satellite observations can provide us with more detail than this. I’m always quite amazed at what we can pick up so no doubt I will return to this in the future.