Hello everyone. Great that you could make it out to my blog post. I would like to introduce you to some ideas about environmental modelling that I have recently discovered during my work. These ideas are from this paper by Christine Koltermann and Steven Gorelick back in 1996. Whilst the primary focus of their paper is on modelling hydrogeological properties such as hydraulic conductivity, I think there is crossover with other modelling too.
What I find the most interesting about this work are the words they used to describe modelling approaches, meaning the way the modeller sees the world. They break down modelling into three different approaches: structure-imitating, process-imitating, and descriptive methods. Over the next few mousewheel-scrolls I hope I can explain these ideas in simple terms so that they are easy to understand.
This paper discusses models that are spatially distributed – this means that we are trying to estimate values at different locations in space. In the following diagrams I have simplified things to one dimension to hopefully make things a bit clearer. It is also important to note that many models will combine elements of one or more of the following model approaches – often at different scales.
Descriptive methods
Descriptive modelling approaches are primarily conceptual – kind of like joining the data dots in Figure 1 to produce the circle. There might be no hard and fast rules here, although models may be based on years of experience and observation in the field. These models may not be so rigorous and possibly difficult to replicate in different environments.
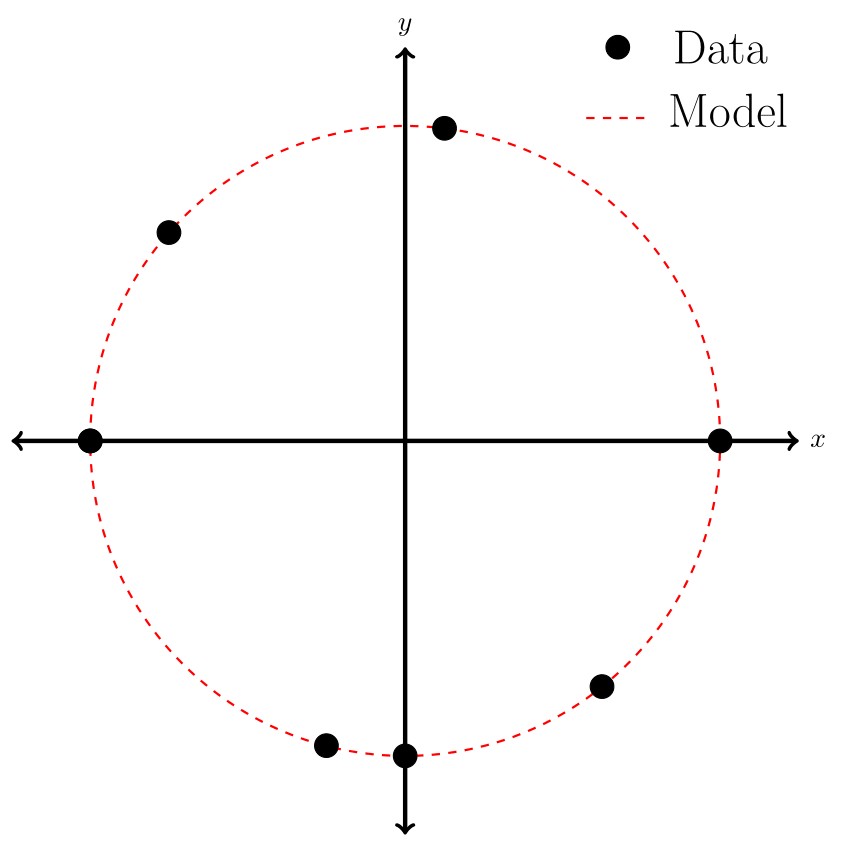
Fig.1. Descriptive diagram
A good example of descriptive modelling are geological cross sections. They are constructed using borehole data and similar lithologies at similar depths are assumed to be part of the same geological formation. More experienced practitioners will have better intuition for connecting the dots and interpreting the stratigraphic record. In many cases thes cross sections are a suitable model. However in some hydrogeological applications this level of modelling is insufficient as more information is required about the geometry of the formation, and perhaps variations in its hydraulic properties – something that is difficult to derive solely from descriptive methods.
Structure-imitating methods
Structure-imitating modelling approaches quantify observations of the thing to be modelled and use these rules to produce something that looks similar. The structure that is imitated could be the actual shape of the object to be modelled, or it could be something more abstract, such as the geostatistical structure of the observations. To demonstrate: In Figure 2 we have some data shown with black lines. We can then derive information about this data, say in this case the distance of each data point from the centre. From this structural information we can model the rest of the circle.
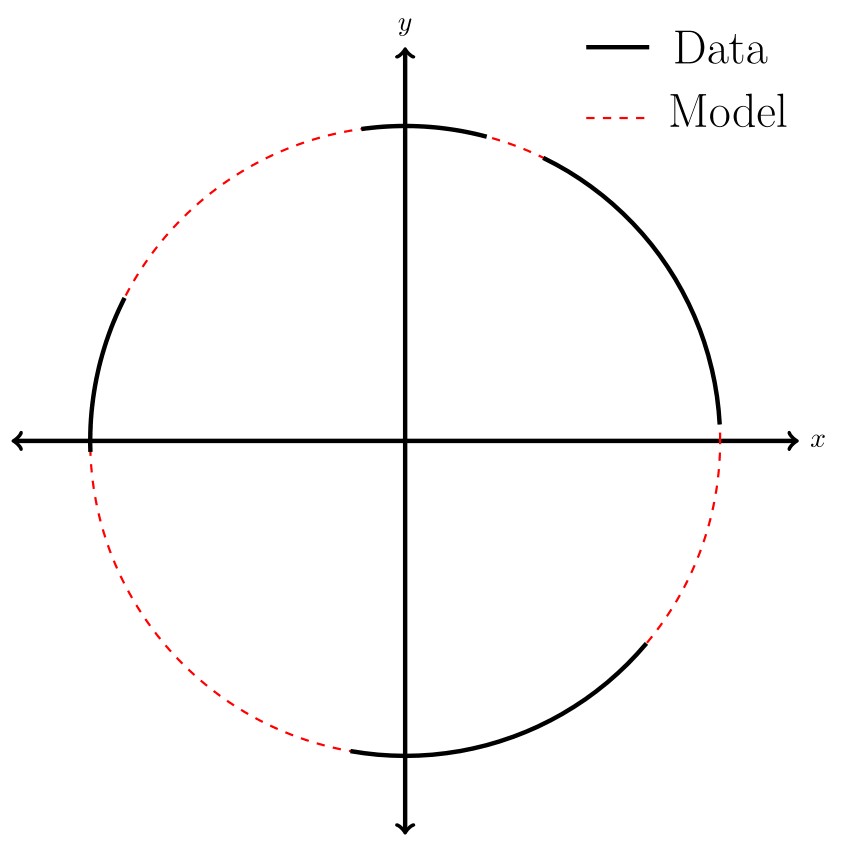
Fig.2. Structure-imitating diagram
A well-known structure-imitating method is kriging. This method uses the geostatistical structure (i.e. mean and covariance) of a set of observations to estimate values of a variable at other locations. A typical criticism of kriging and other geostatistical methods is that defined boundaries between facies become indistinct and don’t look so geologically plausible. Many other methods have been developed, such as multiple-point statistics, to address these arguments.
Process-imitating methods
Process-imitating modelling approaches rely on the governing equations of a process to produce a plausible model. Governing equations describe the physical principles underlying processes such as fluid motion or sediment transport. This type of approach can occur both as forward or inverse modelling. Forward models require setting key parameters in the model (such as hydraulic conductivity) and then predicting an outcome, such as the distribution of groundwater levels. Inverse models start with the observations and try to fit the hydrogeological parameters to the data.
Our final circle model is in Figure 3. In this particular case we know the equation that gives us the circle. As with all process-imitating modelling approaches there is some kind of parameter input required (or forcing). Here we have assumed that the circle is centred about the origin, and our parameter input is the radius of the circle (4) on the right hand side of the equation. Thus we can model the circle based on the equation and a parameter input.
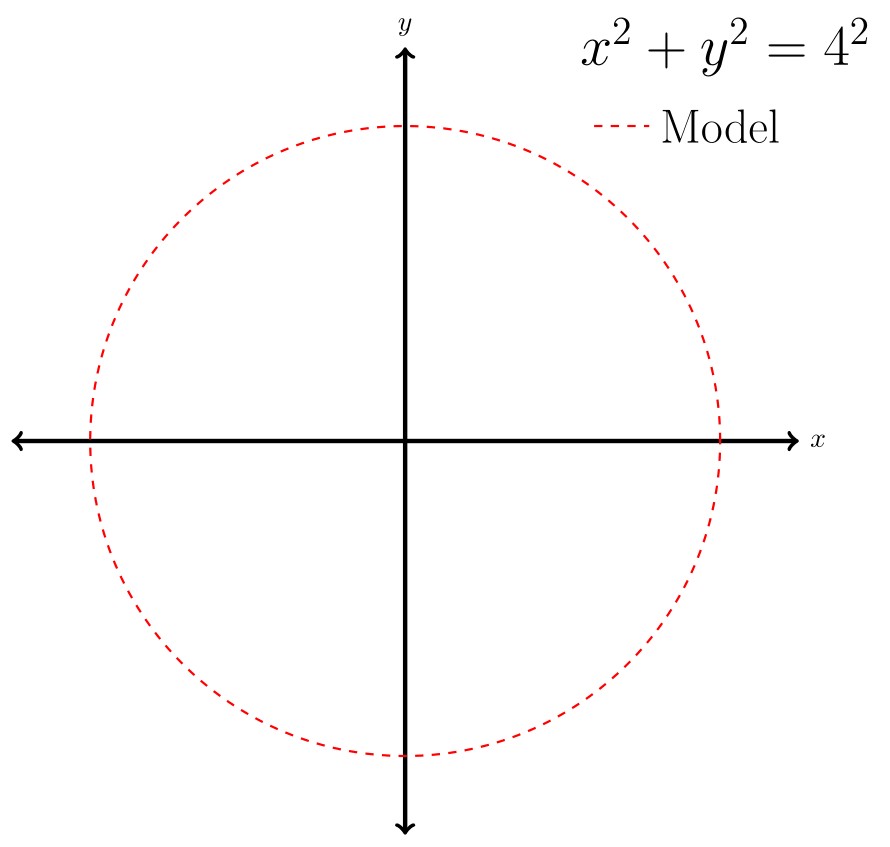
Fig.3. Process-imitating diagram
The classic process-imitating model approach in hydrogeology is aquifer model calibration. This is a relatively simple, but widely used, application where zones of hydraulic conductivity are created and adjusted to reproduce measured groundwater levels (hydraulic heads). Often these zones are tweaked using a trial-and-error process to get a better match (or reduce the error). Aquifer model calibration is considered a process-imitating approach because it attempts to replicate the governing equations of fluid flow within porous media. MODFLOW is a model from USGS that is often used in this type of modelling.
Thanks for making it all the way down here. My aim was to provide you with a couple of new words to describe modelling approaches in geosciences and beyond. If you are working in hydrogeology then this paper by Koltermann and Gorelick is definitely worth a read – it gives an excellent foot-in-the-door to hydrogeological modelling.
Reference
Koltermann, C. E., and Gorelick, S. M. (1996). Heterogeneity in Sedimentary Deposits: A Review of Structure-Imitating, Process-Imitating, and Descriptive Approaches. Water Resources Research, 32(9), pp.2617-2658.
About Jeremy 
Jeremy Bennett is conducting doctoral research at the University of Tübingen, Germany. He is researching flow and transport modelling in heterogeneous porous media. Prior to his post-graduate studies in Germany he worked in environmental consultancies in Australia and New Zealand. Jeremy figures there is no better way to understand a concept than to explain it to others – hopefully this hypothesis proves true. Tweets as @driftingtides and blogs here.