Events of meteorological significance, such as thunderstorms, hurricanes, cyclones, jet streams and global-scale circulations can be described by a general term: atmospheric dynamics. When it comes to it, atmospheric dynamics deals with nothing more than air, which, in truth, is very difficult to directly observe, (with the exception of clouds and precipitation). This makes the study of atmospheric dynamics problematic!
So how is it that we know so much about weather systems and atmospheric dynamics? Scientists are able to observe changes in the temperature, pressure, density (or thermodynamic state to use the technical term), and the general state of the air, as well as changes in its motion, including its direction and speed (ie the winds). But even if the observations can be made, visualising the dynamic events still remains a problem.
That is where rendering – the process by which an image can be generated from 2D or 3D data – comes in. From simple line plots over two-dimensional contours, to three-dimensional visualization and even animations, every type of rendering has its own place and utility in atmospheric science research.
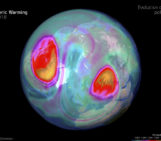
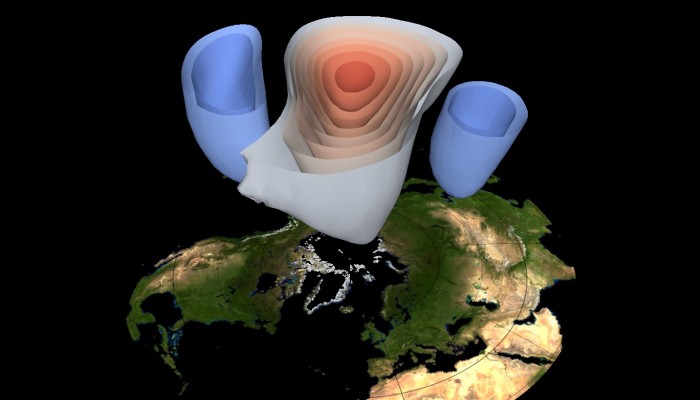
Stratospheric Sudden Warmings (SSWs) are prime examples of global scale atmospheric events that cannot be observed directly, as neither clouds, nor precipitation, nor any other visible structures are involved. SSWs are events where the stratospheric polar vortex –a persistent large-scale cyclone which circles the poles – breaks down within a few days, and strong anomalies can be measured in many variables, such as temperature, wind, and its height position relative to sea level and adjusted for the effects of gravity.
Today’s Imaggeo on Mondays image is a rendering of the SSWs and its associated height anomalies on February 23, 1979, (taken from the European Centre for Medium-Range Weather Forecasts ERA-Interim reanalysis dataset). From the image, Martin Jucker, a researcher at New York University, was able to show that the 1979 event spanned the entire polar and subpolar regions and throughout the stratosphere.
“Not seen in this picture (as it is a temporal snapshot) is the influence such SSWs can have even on the state of the atmosphere at surface levels. Indeed, there can be implications throughout the atmospheric column all the way to the surface, with the jet streams being perturbed and prolonged periods of unusual weather observed in mid- to high latitudes,” explains Martin.
This is a great example of how three-dimensional renderings can give intuitive understanding of the internal structure of important global scale atmospheric events. They can help appreciate the spatial extent of the anomalies generated throughout the atmosphere. Phenomena which are not visible without the help of computer visualisation techniques can be categorised and even defined!
By Martin Jucker, researcher at New York University and Laura Roberts, EGU Communications Officer.
Imaggeo is the EGU’s online open access geosciences image repository. All geoscientists (and others) can submit their photographs and videos to this repository and, since it is open access, these images can be used for free by scientists for their presentations or publications, by educators and the general public, and some images can even be used freely for commercial purposes. Photographers also retain full rights of use, as Imaggeo images are licensed and distributed by the EGU under a Creative Commons licence. Submit your photos at http://imaggeo.egu.eu/upload/.