EGU Blogs

An Atom's-Eye View of the Planet

Meteorite impact turns silica into stishovite in a billionth of a second

Meteorite impact turns silica into stishovite in a billionth of a second

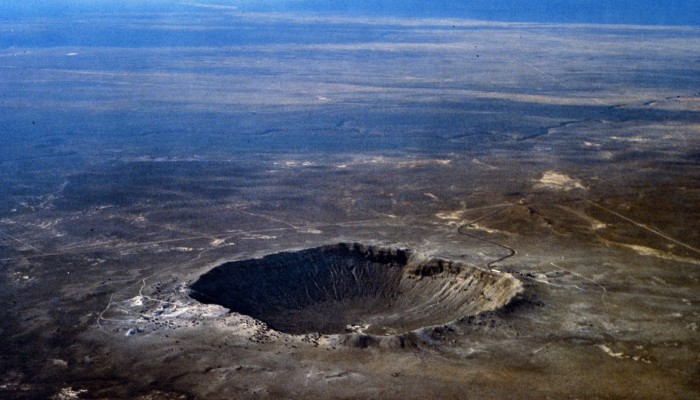
The Barringer meteor crater is an iconic Arizona landmark, more than 1km wide and 170 metres deep, left behind by a massive 300,000 tonne meteorite that hit Earth 50,000 years ago with a force equivalent to a ten megaton nuclear bomb. The forces unleashed by such an impact are hard to comprehend, but a team of Stanford scientists has recreated the conditions experienced during the first billionths of a second as the meteor struck in order to reveal the effects it had on the rock underneath.

The sandstone rocks of Arizona were, on that day of impact 50,000 years ago, pushed beyond their limits and momentarily – for the first few trillionths and billionths of a second – transformed into a new state. The Stanford scientists, in a study published in the journal Nature Materials, recreated the conditions as the impact shockwave passed through the ground through computer models of half a million atoms of silica. Blasted by fragments of an asteroid that fell to Earth at tens of kilometres a second, the silica quartz crystals in the sandstone rocks would have experienced pressures of hundreds of thousands of atmospheres, and temperatures of thousands of degrees Celsius.

A meteroite impact event would generate shock waves through the Earth.
NASA

What the model reveals is that atoms form an immensely dense structure almost instantaneously as the shock wave hits at more than 7km/s. Within ten trillionths of a second the silica has reached temperatures of around 3,000℃ and pressures of more than half a million atmospheres. Then, within the next billionth of a second, the dense silica crystallises into a very rare mineral called stishovite.

The results are particularly exciting because stishovite is exactly the mineral found in shocked rocks at the Barringer Crater and similar sites across the globe. Indeed, stishovite (named after a Russian high-pressure physics researcher) was first found at the Barringer Crater in 1962. The latest simulations give an insight into the birth of mineral grains in the first moments of meteorite impact.

Click here to display content from YouTube.
Learn more in YouTube’s privacy policy.

Simulations show how crystals form in billionths of a second.

The size of the crystals that form in the impact event appears to be indicative of the size and nature of the impact. The simulations arrive at crystals of stishovite very similar to the range of sizes actually observed in geological samples of asteroid impacts.

Studying transformations of minerals such as quartz, the commonest mineral of Earth’s continental crust, under such extreme conditions of temperature and pressure is challenging. To measure what happens on such short timescales adds another degree of complexity to the problem.

These computer models point the way forward, and will guide experimentalists in the studies of shock events in the future. In the next few years we can expect to see these computer simulations backed up with further laboratory studies of impact events using the next generation of X-ray instruments, called X-ray free electron lasers, which have the potential to “see” materials transform under the same conditions and on the same sorts of timescales.

The Conversation

This article was originally published on The Conversation. Read the original article.

Why Kathmandu was so vulnerable

The magnitude 7.9 earthquake that hit Nepal this morning is shocking news. For some time scientists have realised that the Kathmandu valley is one of the most dangerous places in the world, in terms of earthquake risk. A combination of high seismic activity at the front of the Tibetan plateau, poor building standards, and haphazard urbanisation have come together today with fatal consequences.

The quake hit just before noon, local time, around 48 miles north west of Kathmandu. The Indian tectonic plate is driving beneath the Eurasian plate at an average rate of 45mm per year along a front that defines the edge of the Tibetan plateau. This force created the Himalayas, and Nepal lies slap bang along that front. The quake was shallow, estimated at 12km depth, and devastating as the Indian crust thrust beneath Tibet one more time.

Shake map released by the US Geological Survey.
USGS

Historic buildings in the centre of Kathmandu have been reduced to rubble. Brick masonry dwellings have collapsed under clouds of dust. Weakened buildings will now be vulnerable to aftershocks, which continue to rattle Nepal through the day. Multiple aftershocks above magnitude 4 hit in the six hours following the earthquake.

The search for survivors has only just begun.
Narendra Shrestha/EPA

Away from the populated Kathmandu valley, in the heights of the Himalaya, climbers on Everest tweeted reports of damage to base camp, and fatal avalanches on the flanks of the mountain. The steep valleys and precipitous dwellings of the more populated areas are vulnerable to landslides. It seems inevitable that the areas beyond the city itself will bear bad news to come. Now is the time for us all to consider how we can help those most in need, in practical ways.

Although one cannot predict the day or the hour, the scenario that we see on our TV screens today had been thought through many times already, with one particularly prescient article written almost two years ago to the day. The likely impacts of the quake can be readily estimated, and in any case will soon be reported directly from the surroundings.

Early reports of deaths nearing the thousands are only, tragically, going to increase, with the US Geological Survey putting estimates of fatalities in the range of thousands to tens of thousands.

The Dharahara, also called Bhimsen Tower, was destroyed in the quake.
Narendra Shrestha/EPA

Just one week ago my geophysicist colleagues returned to the UK from a meeting in Kathmandu, Nepal, as part of the Earthquakes Without Frontiers research project. The focus was earthquake risk reduction and hazard awareness in Nepal. The risks have been recognised for some time, but I don’t suppose any of the participants expected their work to be thrown into the spotlight so soon.

Professor James Jackson, of Cambridge University and one of the leaders of the Earthquakes Without Frontiers project, talked with me on his return from Kathmandu last weekend. He described tall, thin houses, with extra stories built up on top, explaining how they arise from the Nepalese tradition of sharing inherited property between siblings, with houses split vertically between them.

The only way to build is upwards. In a seismic area, it’s a recipe for disaster, and one can’t help but wonder what this phenomenon has wrought on families in Kathmandu today.

The Conversation

This article was originally published on The Conversation.
Read the original article.

How the air we breathe was created by Earth’s tectonic plates

Volcanism, driven by plate tectonics, built Earth’s atmosphere to make a habitable planet.

How is it that Earth developed an atmosphere that made the development of life possible? A study published in the journal Nature Geoscience links the origins of Earth’s nitrogen-rich atmosphere to the same tectonic forces that drive mountain-building and volcanism on our planet. It goes some way to explaining why, compared to our nearest neighbours, Venus and Mars, Earth’s air is richer in nitrogen.

The chemistry of the air we breathe is, at least partly, the result of billions of years of photosynthesis. Plant life has transformed our world from one cloaked in a carbon dioxide-rich atmosphere – as seen on Mars or Venus – to one with significant oxygen. About a fifth of the air is made up of oxygen, and almost all the rest is nitrogen. But the origins of the relatively high nitrogen content of Earth’s air have been something of a mystery.

Geoscientists Sami Mikhail and Dimitri Sverjensky of the Carnegie Institution of Washington have calculated what nitrogen is expected to do when it is cycled through the rocks of the deep Earth by the churning cycle of plate tectonics. Active volcanoes not only shower volcanic rock and superheated ash as they erupt molten rock into the air, they also vent huge amounts of gas from Earth’s depths. The latest eruptions in Iceland, for example, have been noted for the amounts of sulphurous fumes that they have emitted.

Alongside sulphur, steam and carbon dioxide, volcanoes next to active tectonic plate boundaries pump massive quantities of nitrogen into the air. Mikhail and Sverjensky explain this through the chemistry of what goes on beneath those volcanic roots.

As oceanic crust is subducted (that is, dragged down beneath continental crust) down into the depths of the Earth by the cycle of plate tectonics, it releases “volatile” elements into the rock above. These volatile elements contain nitrogen – and its fate could be to either end up locked in minerals or be released as gas into the atmosphere. The chemical composition of the overlying rocks decide the fate of the volatiles.

The volcanic eruption at Holuhraun, Iceland, active since last month is releasing immense clouds of steam, carbon dioxide and sulphur dioxide every day.

Nitrogen deep in the Earth’s crust will tend to form ammonium ions (NH4+) which get incorporated into solid silicate minerals easily. Silicate minerals are among the most abundant kind of minerals in Earth’s crust. This is presumed to occur to much of the nitrogen on Earth and pretty much all of the nitrogen on Venus and Mars. But when those silicate minerals react under certain conditions, such as in the presence of oxygen or oxygen-containing compounds, the ammonium molecules break down to a mixture of water (H2O) and nitrogen (N2). The latter then finds its way to the surface and the atmosphere through volcanic vents.

Mars and Venus have no plate tectonics and relatively little nitrogen. The nitrogen-rich atmosphere that made Earth a home for life thousands of millions of years ago appears to have its origin in the fact that the planet itself is a geologically active beast. Subduction, a driving force for plate tectonics, also creates the chemical reactor to make deep nitrogen. The same forces that drive the formation of mountains and continents, oceans and islands, are also responsible for our atmosphere and biosphere.

The findings suggest that nitrogen first started building in the atmosphere more than three billion years or so ago, and implies that plate tectonics was already active on Earth at that time. This fits in with other estimates for how long Earth has been an active planet, and it contrast starkly with the geologically stagnant picture we have of Mars and Venus. The results provide new insights into the pre-conditions guiding the likely character of life-hosting planets around distant stars, elsewhere in the universe.

The Conversation

This article was originally published on The Conversation.
Read the original article.

Global warming increases risk of winter flooding

Overwhelmed

Britain’s warm, wet winter brought floods and misery to many living across southern England, with large parts of Somerset lying underwater for months. When in January rainfall was double the expected average over wide areas, many people made cautious links between such extreme weather and global climate change. There were nay-sayers at the time but it now seems that there is evidence for those links.

Speaking at the European Geosciences Union annual meeting here in Vienna, Myles Allen, a professor of geosystem science at the University of Oxford, presented his take on the issue. At the gathering of more than 12,000 geoscientists, Allen reported an ambitious computer experiment that his team has undertaken over the last two months to test whether the winter floods could be attributed to climate change. And it seems that they can be linked.

The floods of January 2014 certainly were extreme. According to Oxford’s records of daily rainfall, they were unprecedented in 250 years. The records at the UK Met Office from the 20th century also show that this winter was, historically, uniquely bad.

Flooded rivers wash huge amounts of sediment into estuaries around southern Britain in February.
NEODAAS/University of Dundee

The IPCC report does suggest that extreme weather events should be expected as the world warms but the prediction is couched in cautious terms and the risk is assessed as “medium” confidence.

At the Environmental Change Institute in Oxford, researchers Nathalie Schaller and Friederike Otto analysed results from almost 40,000 climate model calculations to test the impact of climate change on Britain’s winter rains. Their calculations modelled the weather across the country on a 50km grid. They compared the results of 12,842 simulations based on the current global sea surface temperatures, with 25,893 results computed on the assumption that global warming had never occurred – that fossil fuel burning had not raised CO2 to today’s levels and ocean surfaces were cooler.

Such a huge number of calculations was needed to tease out the statistical differences between the two scenarios. It was only possible through the participation of thousands of members of the public in the work’s biggest ever climate modelling exercise: they offered up spare processing capacity on their home computers to run the calculations via the Climate Prediction citizen science climate modelling programme.

The difference between observed winter (blue) and climate change-free simulated winter (green) shows increased seasonal rainfall and greater likelihood of extreme rainfall.

The results showed a subtle bias towards more extreme weather in today’s warming world. Events that would have been expected once in 100 years before global warming can now be anticipated to occur once in 80 years. In essence, the probability of extreme winter floods appears to have increased by 25% on pre-industrial levels.

Allen pointed out that this is the first quantitative evaluation of the influence of global warming on Britain’s 2014 floods. Thomas Stocker, a professor of climate and environmental physics at the University of Bern and chairman of the IPCC working group charged with assessing the physical origins of climate change, said that the Oxford group’s results had “shown movement in one direction only – toward greater risk”.

Although the results from the models cannot yet give definite measures of the probability of a flood, they do provide an insight into how those risks have changed and continue to change – information that is of great interest to insurance underwriters, among others.

Otto said: “Past greenhouse gas emission and other forms of pollution have loaded the weather dice”, adding that she and others were still working on investigating the implications of the results, for river flows, flooding and ultimately the threat to property and lives.

Some will, no doubt, question the result on the basis that it is “simply” a statistical test. The results from the two modelling scenarios are, at first sight, very similar. But the fact remains that they are distinct, showing that rising global ocean surface temperatures directly influence UK winter rainfall.

The results affirm the strong and growing scientific consensus developing from the understanding of the physical origins and consequences of climate change, as outlined in the IPCC’s Fifth Assessment Working Group 1 report last September. Those that choose to ignore them, or contradict them, will (I predict) still be directly affected by them. And we will be hit where it hurts most – in our wallets. How likely is it that the insurance industry will ignore such results?

This article was originally published on The Conversation.
Read the original article.