Last year Kate Ravilious was awarded an EGU Science Journalism Fellowship to follow scientists studying continental faults. Now she’s out in Nepal alongside researchers who are working out when the county’s next big quake will be…
Sometimes the best rocks are found in the worst locations. Yesterday I was reminded of this as I watched Paul Tapponnier, from the Earth Observatory of Singapore, and his team tracing one of the most dangerous earthquake faults in the world, right next to a dusty, noisy, dirty and busy main road in southern Nepal. Hooters were blaring, bells ringing and people shouting. Clouds of fine orange dust (from quarrying down the road) coated us from head to toe and under our feet lay the rubbish chucked out of bus and car windows. Glamourous it was not.
But Tapponnier and his team are prepared to hold their noses and get on with the job in hand. They know that these rocks are likely to hold the answers to the puzzle they are trying to solve, and that studying them could eventually help to save many lives.
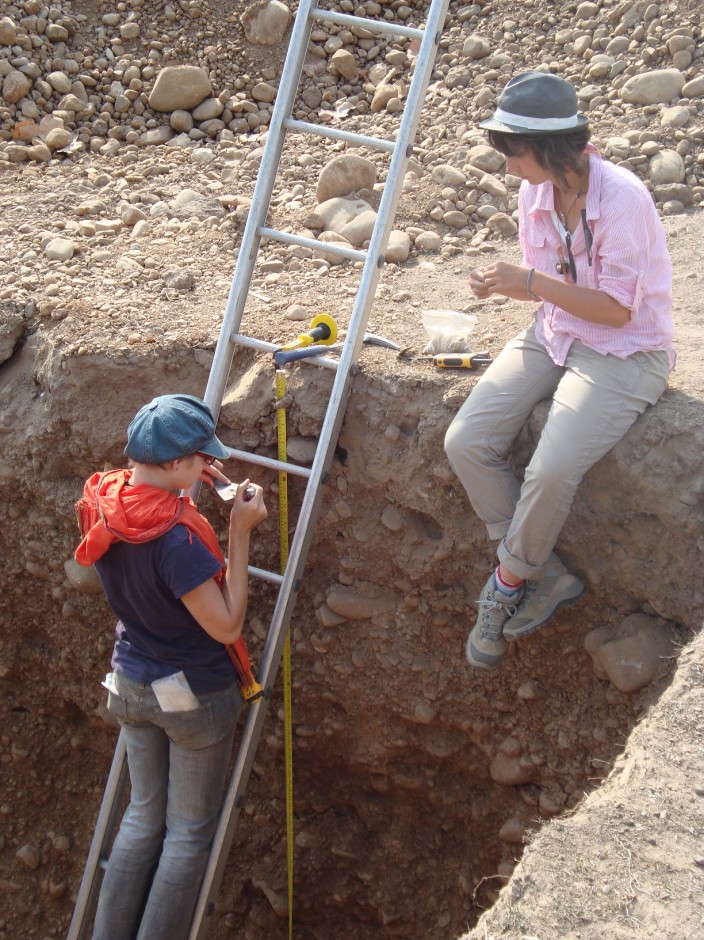
Chasing charcoal – the key to dating faults. (Credit: Kate Ravilious)
In Nepal earthquakes are a fact of life. India is slamming into Asia at a rate of 4 cm per year (pushing up the mighty Himalayan mountain range) and the strain that accumulates in the underlying tectonic plates releases itself periodically in the form of earthquakes. Tremors of magnitude 4 or 5 happen more than ten times every year, but the real worry is the ‘great’ earthquakes – magnitude 8 or more – which Nepal encounters once every few decades.
The last great earthquake – a magnitude 8.4 – occurred in 1934. It razed around one quarter of Nepal’s capital, Kathmandu, to the ground and killed 17,000 people across India and Nepal. Since then the population of Kathmandu has grown sevenfold and dangerous multi-story concrete buildings have sprung up everywhere. Kathmandu (which happens to be built on jelly-like ancient lake sediments) has risen to an unenviable first position in the world earthquake risk list and scientists estimate that up to one million people could be killed when the next big quake shakes the Himalayan region.
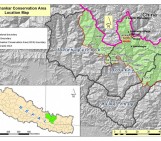
But when and where will this next big earthquake be? For decades no-one could even locate the fault that caused the 1934 quake, let alone estimate when it might move again. But Tapponnier has an uncanny nose for sniffing out earthquake ruptures, and in 2008 he found the culprit, hidden underneath layers of Nepalese jungle down on the edge of the hot Terai plains in southern Nepal. Since then he has returned every year, to uncover the extent of this massive fault and learn more about how it operates.
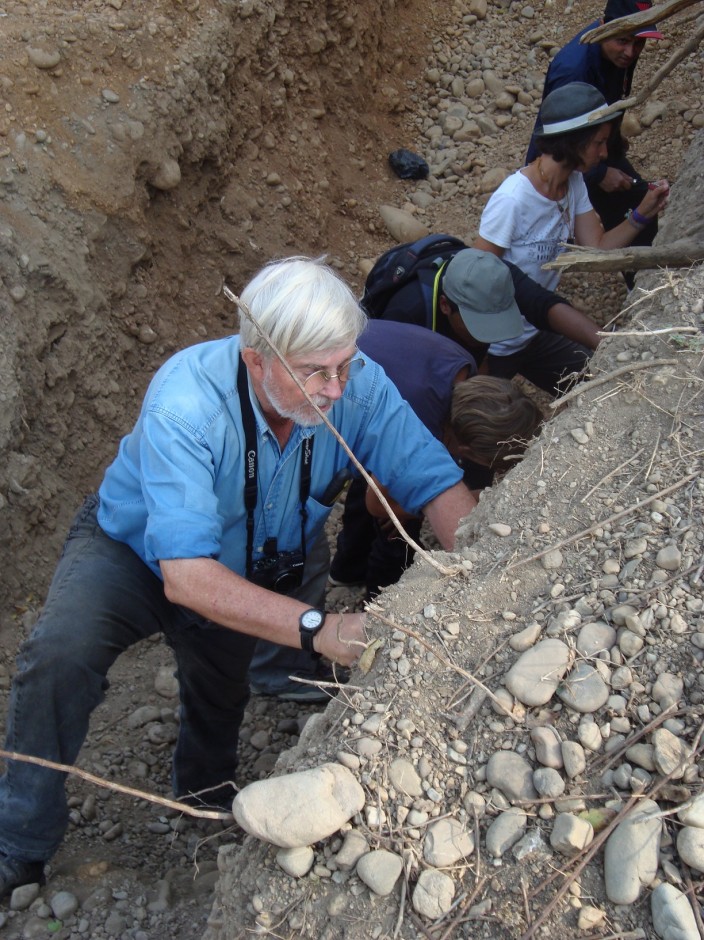
Paul Tapponier searching for signs of earthquakes past. (Credit: Kate Ravilious)
And so it was that I ended up standing next to the busy road, near the small town of Bardibas, thanks to a travel grant awarded by the EGU, to learn about the work that Tapponnier and his team are doing.
This year much of the focus of the field trip has been to map out the shape of the land, using a sophisticated LIDAR (Light Detection and Ranging) technology. This sleek silver canister rotates and sends out 150,000 pulses of laser light every second. The reflections are used to build up a high resolution three-dimensional picture of the surface.
Sorvigenaleon Ildefonso, a LIDAR technician from the Earth Observatory of Singapore, along with Aurélie Coudurier-Curveur and Çagil Karakaş, both post-doctoral researchers at the Earth Observatory of Singapore, have spent the last two weeks gathering as many measurements as possible, from a range of locations (many of which are beautiful and tranquil spots), often working until the light fades and they can no longer see what they are doing. The day I arrive they are hauling the LIDAR and associated equipment from location to location, ignoring the energy-sapping heat, blaring of horns, stink of rubbish and clouds of dust. While I am constantly distracted by what is going on around me, they are all completely focused, setting up their equipment with precision and great care, and recording their measurements meticulously.
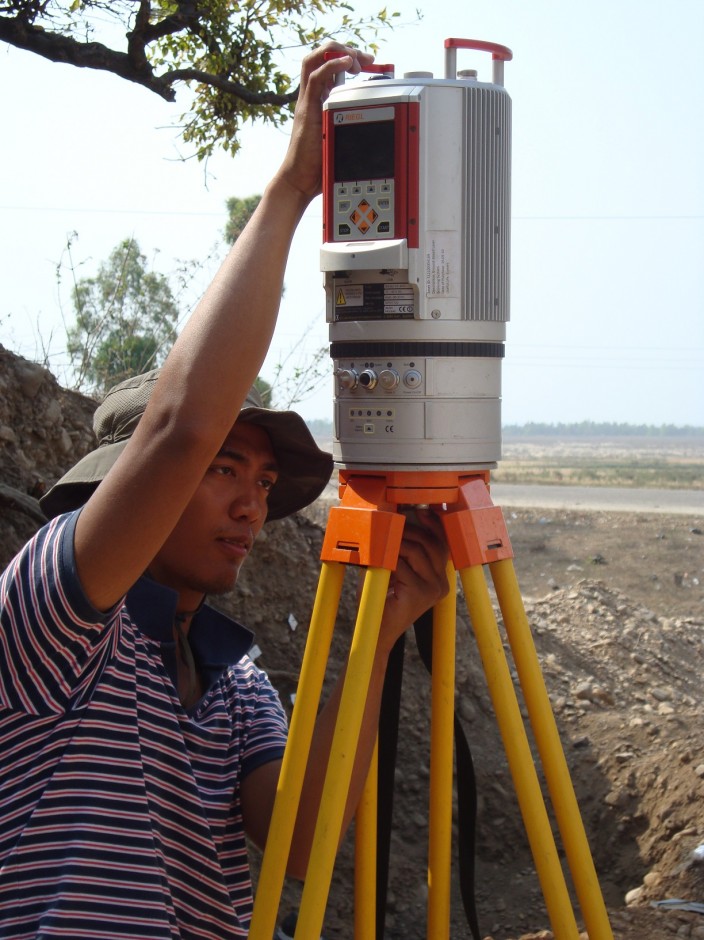
Sorvigenaleon Ildefonso setting things up for LIDAR. (Credit: Kate Ravilious)
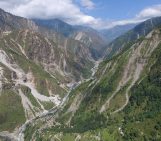
What they are searching for is changes in gradient, not always visible to the naked eye under the thicket of vegetation. Much of the hillside has a step-like appearance, and each of those steps may represent one upward thrust of the earthquake. By using the LIDAR to map out these steps in detail they can work out how many times the fault has moved, and how much land it thrust upwards each time.
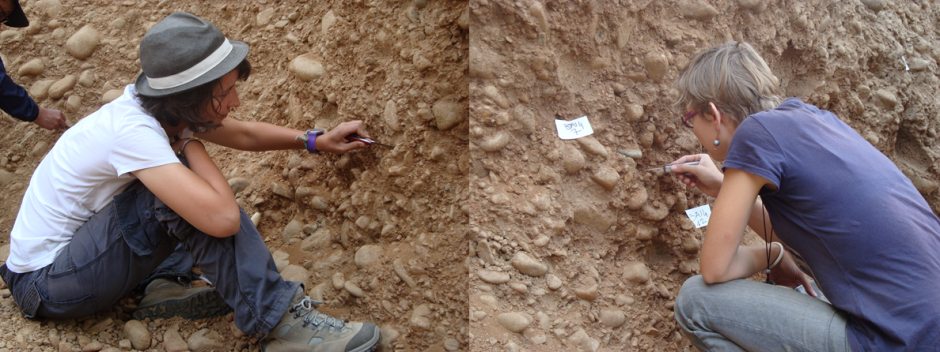
Meanwhile, down at the bottom of the hillside Tapponnier and his Nepalese colleague, Som Sapkota, from the Department of Mines and Geology in Kathmandu, are standing in a ditch, searching for miniscule pieces of charcoal in amongst the sand and cobbles of a small outcrop of rock. These incredibly precious fragments (often no bigger than a sesame seed) are the key to dating the timings of the fault movement and working out how often the fault moves on average.
In the pit, picking out charcoal and peering into the past. (Credit: Kate Ravilious)
It is hot, tiring and often tedious work, but for this group of scientists it is puzzle they refuse to leave unsolved. “We have to study these things, and do it quickly, before the next big earthquake strikes,” says Tapponnier.
By Kate Ravilious, Science Journalist (http://www.kateravilious.net)


Anna
Very good information!
Yvonne Chasukwa Mwalwenje
Very informative! It is very important that countries should have well placed instruments which can detect the forthcoming earthquakes. Such practice would reduce the number of causulties.