One of the only regions that have been observed to cool over the past century is the North Atlantic cold blob just south of Greenland.
In our recent paper, we analyse the cold blob or “warming hole” and the processes that contribute to its creation and evolution. While sea surface temperature has been reliably observed, the underlying mechanisms of changing ocean circulation are only sparsely measured. Therefore, we used climate models in different configurations to analyse the role of the ocean circulation in driving the warming hole and identify additional contributing processes. Overall, climate models do a pretty good job reproducing the warming hole (Menary & Wood 2018), albeit with some variation among them.
Climate in general and North Atlantic climate in particular are affected by the phenomenon of natural variability. North Atlantic sea surface temperatures and ocean currents show considerable variations on a decadal timescale, which can mask or strengthen a (until now) fairly weak global warming signal
(Jackson et al. 2016). Therefore, an important question to consider is to what degree the warming hole and its drivers are just natural variability. It is hard to tackle this question using observations alone, since there is only one observed reality and disentangling natural trends and from those forced by greenhouse gas emissions is not always possible.
To overcome this, we used a so-called large ensemble of a climate model, in our case the MPI-ESM-1.1 Grand Ensemble (Maher et al. 2019), and investigated 100 simulations of the historical period. The simulations were run with the same boundary conditions but different initial conditions, resulting in 100 different realisations of the past climate. In these simulations we find that the warming hole varies in strength and position, but is consistently simulated in some form across all ensemble members (Fig. 2). Further, averaging the surface temperature trend over all ensemble members produces a clear cooling patch.
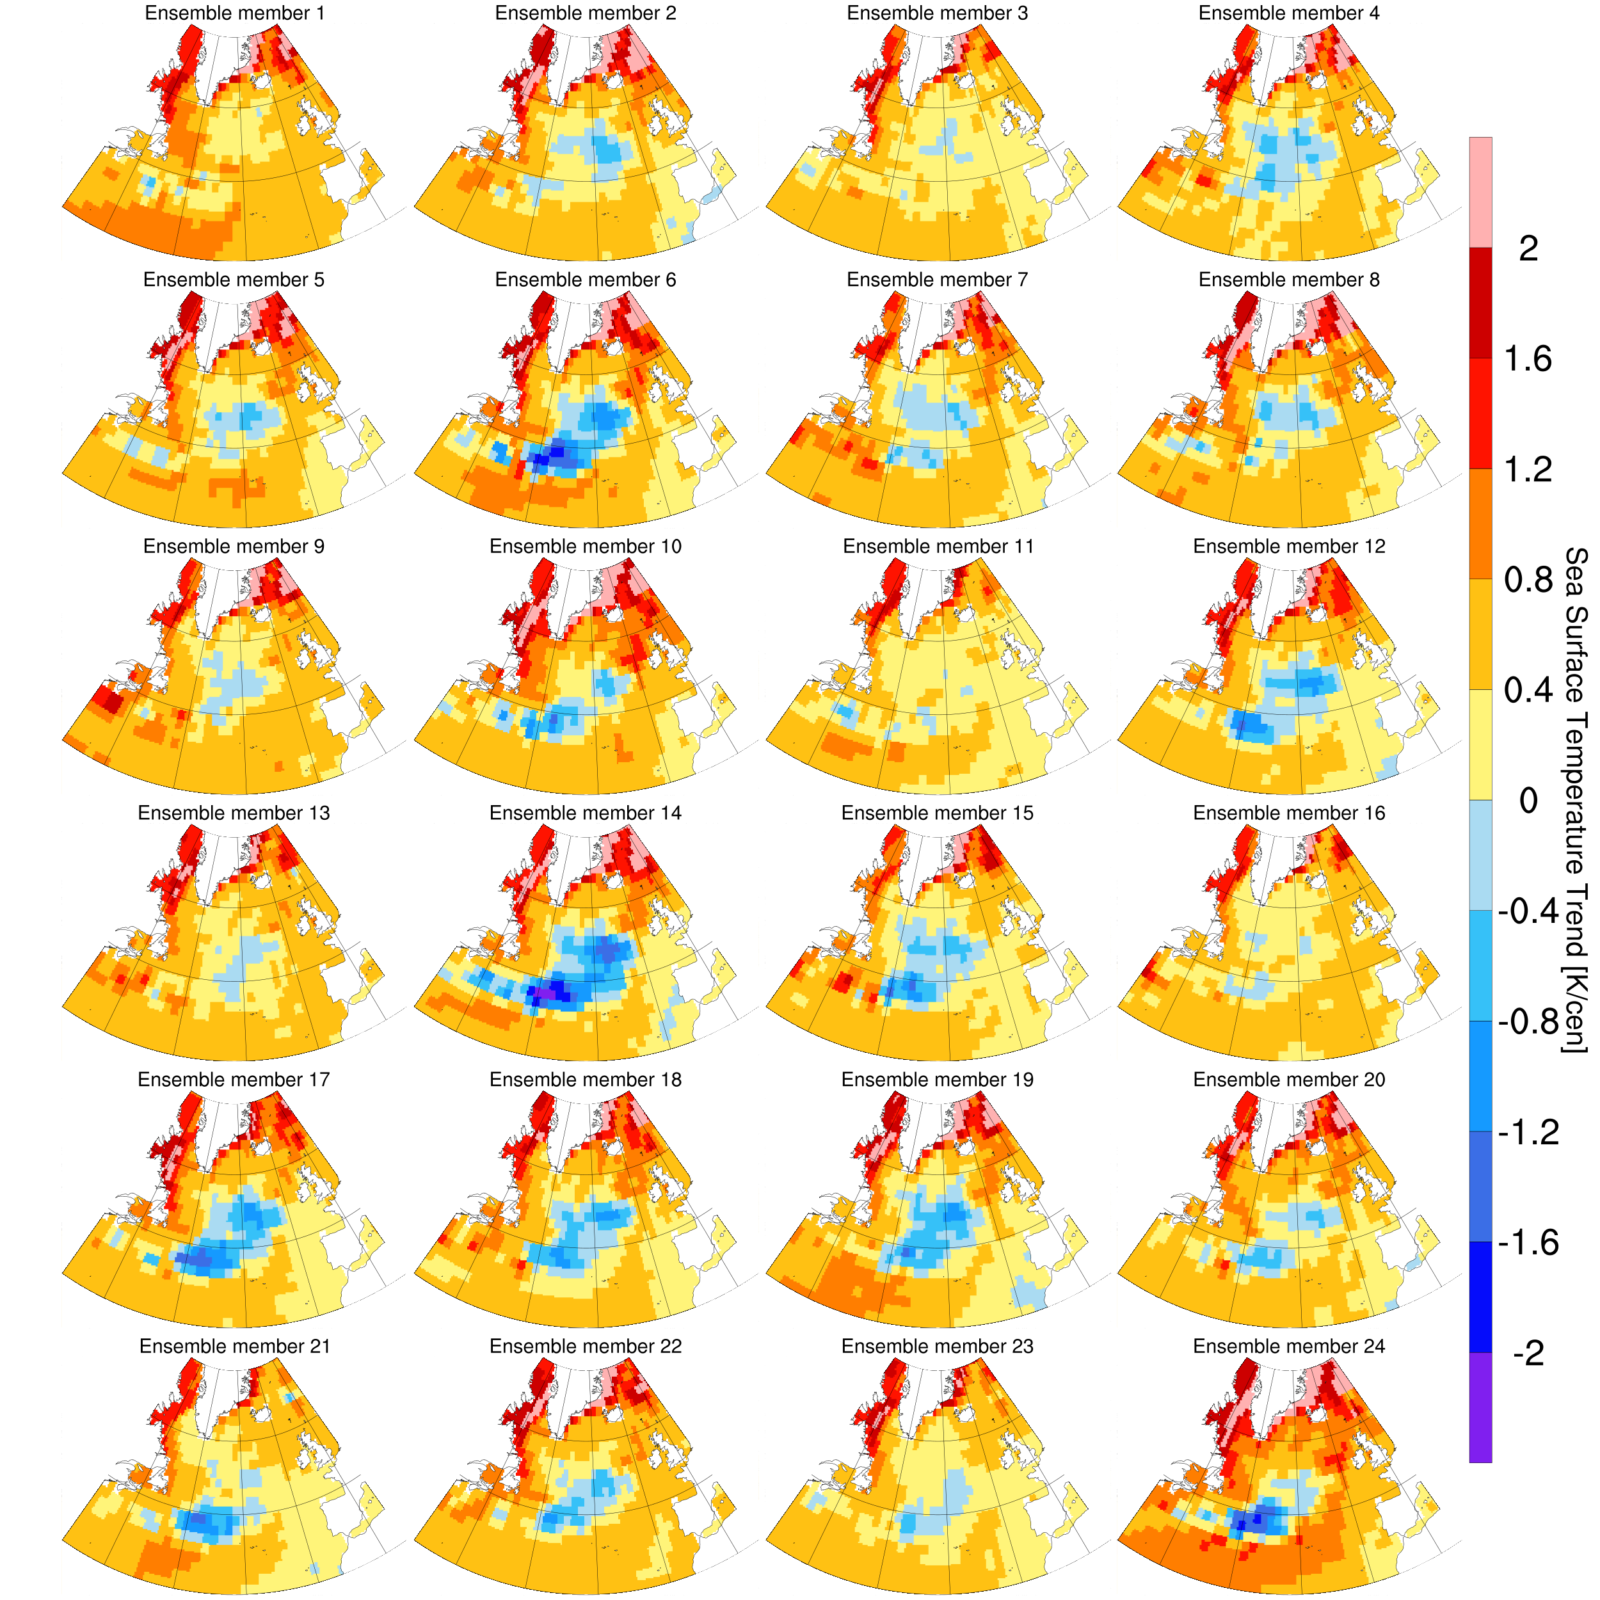
Simulated sea surface temperatures in the North Atlantic region for the first 24 ensemble members of the Grand Ensemble with historical forcing. Shown are trends in K per decade over the period 1870-2005. (Fig. 2; Credit: Paul Keil)
This means that the warming hole can indeed be attributed to global warming and is not just an expression of natural variability. Furthermore, examining a second set of 100 simulations with stronger CO2 forcing, we find that the warming hole is likely to strengthen and to emerge more distinctly from natural variability in the future.
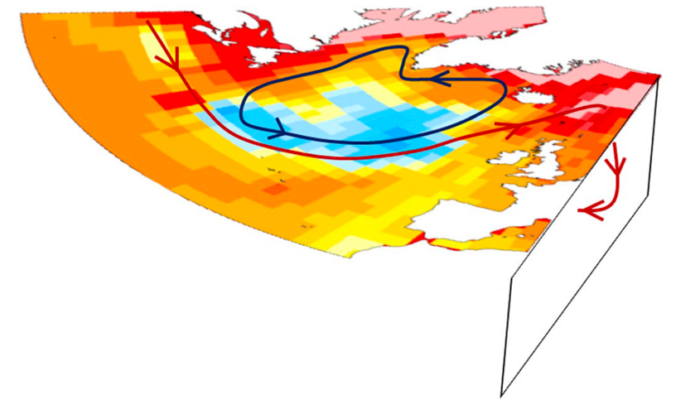
We can use a similar approach to examine the driving processes of the warming hole. A change in the ocean circulation which is coupled to the heat transport into the region is likely responsible for a large part of the cooling (Rahmstorf et al. 2015, Menary and Wood 2018). It was thought that the incoming heat transport from the south associated with the AMOC (Atlantic meridional overturning circulation) is the crucial driver of the warming hole. However, in our large ensemble of the historical period, we find that the heat transport south of the warming hole, mainly associated with the AMOC, does show a decreasing trend in some simulations, there is no coherent trend over all 100 simulations (Fig. 3b).
While the AMOC is projected to slow down, and does so in our second set of simulations with stronger CO2 forcing (Fig. 3a), here it does not emerge from natural variability. Instead, the heat transport north of the warming hole shows a significant positive trend over all simulations, which means an increase of exported heat to the Arctic, rather than a decrease of heat import from the south. We are further able to demonstrate that this increase in heat transport into higher latitudes is mainly associated with a heat transport from the horizontal gyre circulation. Thus, for the formation of the warming hole, the role of the subpolar gyre heat transport is crucial (illustrated as blue line in Figure 1). For our observed reality, of which there only is one, this means that the high latitude heat transport changes are likely causing the observed warming hole, especially in its early stages. Nevertheless, due to its large natural variability, the AMOC might also be contributing to it. As global warming progresses, the impact of the AMOC on the warming hole will increase.
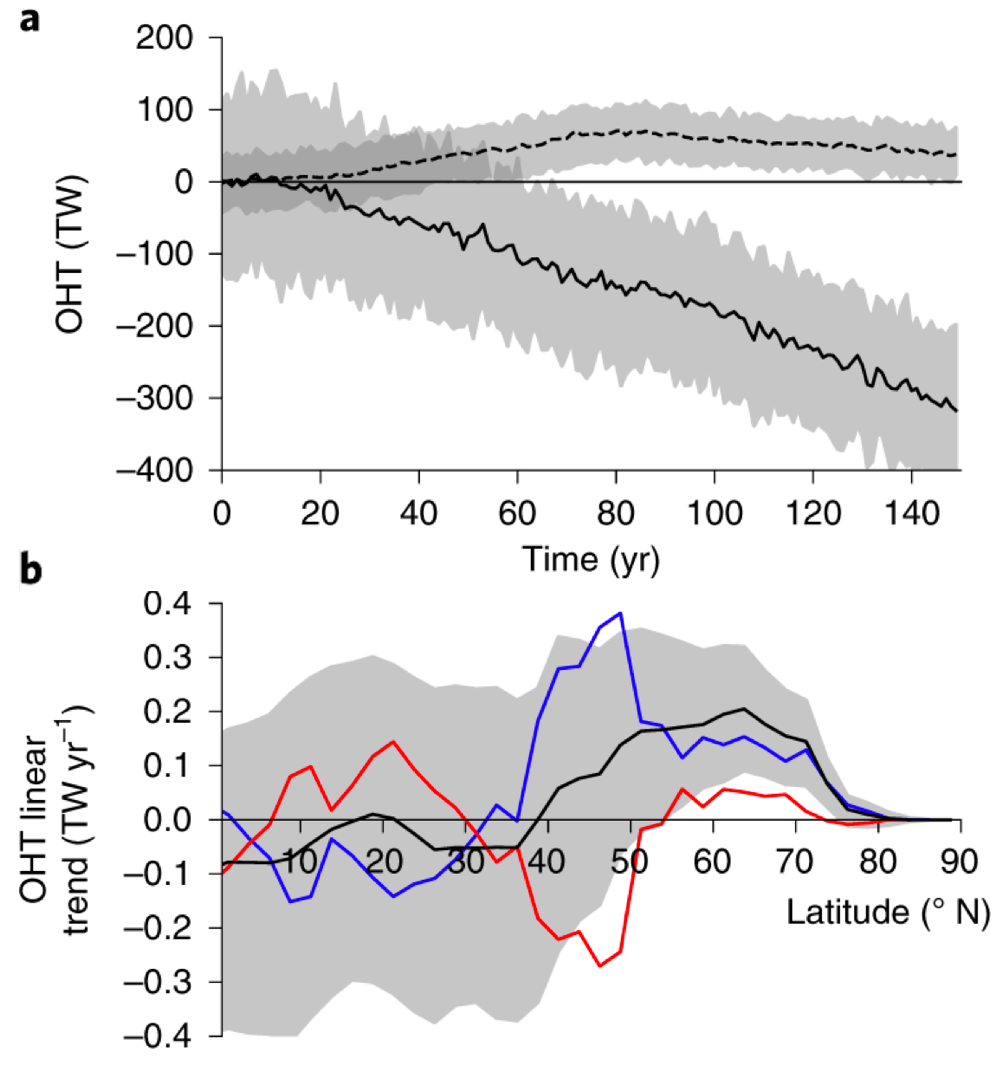
North Atlantic Ocean heat transport (OHT) changes in the Grand ensemble.
a, Evolution of the Atlantic heat transport anomalies relative to the preindustrial control simulation at 26.25° N (black solid line) and 63.75° N (black dashed line) in the 1pctCO2 experiment. Shading represents the 5th and 95th percentiles of the ensemble.
b, Ensemble mean linear trends of the Atlantic OHT in the historical ensemble from 1850 to 2005. Shading represents the 5th and 95th percentiles of the total heat transport trend (black line) of the ensemble. Linear trends of the AMOC and gyre components are shown in red and blue, respectively. (Fig. 3; Credit: Keil et al. 2020)
Climate models are far from perfect and continue to misrepresent some aspects of climate, and show considerable differences to the observations and amongst themselves. In our case for example, we have excluded a change in local vertical mixing as a driver for the warming hole, but this process plays an important role for the warming hole in some climate models (Menary and Wood 2018). Nevertheless, climate models can be a unique tool that helps us to understand the climate. We can even switch off the clouds and thereby erase any possible effect they might have on the warming hole (for more details see Keil et al. 2020).
The climate model helped us understand the mechanisms of changing ocean circulation, which are still measured sparsely over longer timescales. However, even if we had perfect measurements of the warming hole and its associated ocean circulation changes, we would still have trouble separating the climate change signal form the ever-present natural variability. With the 100 alternatives, but equally probable realities produced by the Grand Ensemble we were able to overcome this problem. This is just one aspect of how climate models let us construct artificial worlds, with which we explore the underlying mechanisms behind climate change.
References & Further reading:
Jackson LC, Peterson KA, Roberts CD, Wood RA (2016) Recent slowing of Atlantic overturning circulation as a recovery from earlier strengthening. Nat Geosci. doi:10.1038/ngeo2715
Keil P, Mauritsen T, Jungclaus J, Hedemann C, Olonscheck D, Ghosh R (2020) Multiple drivers of the North Atlantic warming hole. Nat Clim Chang. doi:10.1038/s41558-020-0819-8
Maher N, Milinski S, Suarez-Gutierrez L, Botzet M, Dobrynin M, Kornblueh L, Kröger J, Takano Y, Ghosh R, Hedemann C, Li C, Li H, Manzini E, Notz D, Putrasahan D, Boysen L, Claussen M, Ilyina T, Olonscheck D, Raddatz T, Stevens B, Marotzke J (2019) The Max Planck Institute Grand Ensemble: Enabling the Exploration of Climate System Variability. J Adv Model Earth Syst. doi:10.1029/2019MS001639
Menary MB, Wood RA (2018) An anatomy of the projected North Atlantic warming hole in CMIP5 models. Clim Dyn. doi:10.1007/s00382-017-3793-8
Rahmstorf S, Box JE, Feulner G, Mann ME, Robinson A, Rutherford S, Schaffernicht EJ (2015) Exceptional twentieth-century slowdown in Atlantic Ocean overturning circulation. Nat Clim Chang. doi:10.1038/nclimate2554
Carbon Brief article by Robert McSweeney (2020) Scientists shed light on human causes of North Atlantic’s ‘cold blob’.
Edited by Meriel Bittner