In January 2011, Santorini volcano in Greece began to show the first subtle signs of stirring after many decades of quiet – or at least many decades without detectable activity. This presented an exceptional opportunity to track the behaviour of a very well-studied volcano at the start of a phase of ‘unrest’. Although it may seem counter-intuitive, volcanologists don’t really have a terribly good idea of how volcanoes behave in the long intervals between eruption. Most of the time, resources are devoted to studying volcanoes that are about to erupt, are already erupting, or that have recently erupted, rather than the slumbering volcanoes that might be thought to pose rather less of an immediate hazard. In the case of Santorini, the signs that the volcano might be awakening that we saw in early 2011 presented a scientific chance not to be missed. With urgency funding from NERC (although we did have to explain what the urgency was, without an eruption having happened) and support from our Greek collaborators, we were able to mobilise quickly and make the most of the opportunity to observe and measure while the episode of ‘unrest’ unfolded. Now, two and half years on, the stirring has subsided, and Santorini seems to be settling back into another period of quiet slumber. With the benefit of this hindsight, we can now take a look back over the ‘pulse’ of unrest, and begin to think about what this tells us about how the volcano works.
At the beginning, in early 2011, the first signs of something stirring came from the tiny earthquakes that began to be detected beneath the centre of the volcano. Shortly afterwards, we were also able to see the signs of ground movement from both satellite and ground-based instruments, as the volcano began to swell. Measurements and modelling of this swelling both pointed strongly to the root cause of the unrest being the arrival of molten rock, or magma, about 4 kilometres beneath the volcano, at a point somewhere beneath the northern part of Santorini’s sea-filled caldera.

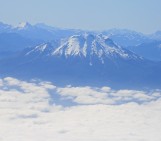
Vertical deformation of Santorini during the period of unrest in 2011 – 2012, determined by Michelle Parks (University of Oxford) from measurements of the deformation field across the islands. The deformation is best explained by the intrusion of magma about 4 km below the red dot.
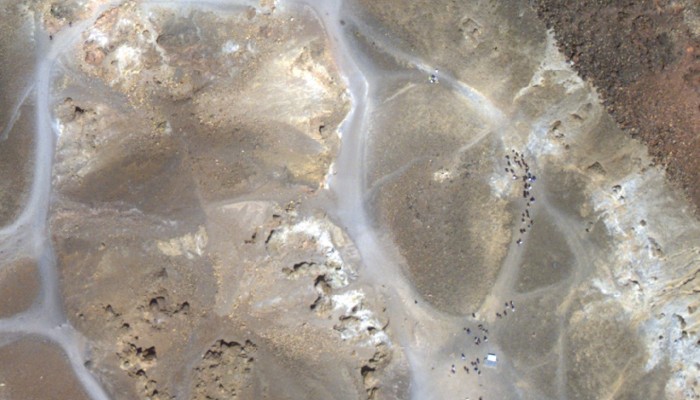
Over the course of the next 12 – 15 months (until about March – April 2012), ten to fifteen million cubic metres of molten rock slowly squeezed into this subterranean reservoir at depth, while we watched our instruments trace out the gradual changes at the surface. Over the same period we were also able to detect subtle changes in the gases leaking out of the summit craters of the Kameni islands; the young volcanic islands in the centre of the caldera. The Kameni islands are almost barren, formed from the overlapping fields of lava erupted over the course of a series of eruptions during the past 2000 years and more. You can get a sense of this from the aerial photographs captured by the NERC-funded aircraft that surveyed the islands in May 2012.
Right in the centre of the younger of these islands, Nea Kameni, the tourist trails circle around the shallow craters formed during eruptions over the past century. Although there is very little visible evidence, apart from a couple of small steamy vents, this summit area is gradually leaking carbon dioxide and other volcanic gases to the atmosphere. The concentrations of these gases are too low to be measured remotely (from satellites, or automated spectrometers), and instead have to be measured directly during field campaigns.

Aerial view of the summit area of Nea Kameni, Santorini, Greece, showing the tourist trails (in grey – look for the people) that run around the edges of the Agios Giorgios craters. Photo taken by the NERC Airborne Research and Survey aircraft on flight EU12-12, May 2012.
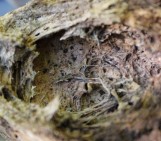
We were interested in measuring the carbon dioxide that is escaping out of the soil, as this is one of the gases that we expect to be released from magmas as they rise up through the Earth’s crust. Carbon dioxide is quite easy to measure, because it has a couple of strong absorption bands in the infra-red, and there are several tailor-made instruments available that can make these sorts of measurements routinely. Most ‘soil gas flux’ instruments are based on the ‘accumulation chamber’ method, a technique adapted for volcanic applications in the early 1990’s. This involves measuring the rate at which carbon dioxide seeps out of the soil into a small volume chamber, resting on the ground surface.

Soil gas measurement system using a PP systems accumulation chamber and portable gas analyser. The accumulation chamber sits on a collar, pressed into the soil. This picture is from a field setting on a volcano in Ethiopia.
In the field set up that we adopted on Santorini, Michelle Parks was also able to collect small fractions of the soil gas for carbon isotope analysis in parallel with the measurements she was making of the soil gas flux itself.

LiCOR soil gas accumulation system on Santorini, ready for deployment. Courtesy of Michelle Parks.
As well as measuring carbon dioxide, we also measured concentrations of the short-lived radioactive gas, radon-222 in the soil gas. Radon is a naturally-occurring radionuclide, which decays by alpha-decay. Radon can be measured using ‘passive’ detectors made of a special plastic (manufactured by TASL), that records the tracks left by the alpha particles that are released from the radon atoms as they decay. After exposure to the soil gas environment for a few days, the plastic detectors are etched to reveal the tracks, ready for counting and calculation of the radon gas concentration. Together, these measurements of carbon dioxide emission rate; of carbon dioxide concentration; of carbon isotopic composition, and the radon concentration – allowed us to tease apart the different sources of carbon dioxide that come together to form the ‘soil gas’. In particular, we distinguish the carbon dioxide produced by bacteria in the soil, from that produced deeper inside the volcanic system; and we can also distinguish between carbon dioxide that has recently escaped from a degassing body of magma, and the carbon dioxide released by reactions between the hot, intruding magma and the limestone rock that forms a part of the ancient basement to the volcano. Our new measurements show that after the intrusion of magma began in early 2011, the pattern of soil-gas carbon dioxide changed, as new gas percolated into and through the shallow parts of the volcano towards the surface, before escaping. This gas pulse has now passed through the system, and all of the signs now suggest that the volcanic system beneath Santorini is returning to a quiet state. We will, though, all be keeping a watchful eye.
Update: February 2015.
Santorini volcano remains in remission, and the episode of unrest has passed. The story of the past 20 years of satellite-observation of the slow ups-and-downs of the volcano has now been documented in another recent paper by Michelle Parks (Parks et al., 2015).
Further reading (non technical): http://santorini.earth.ox.ac.uk
Selected further reading (technical): a selection of the papers that describe some of the features of unrest on Santorini since 2011.
Foumelis, M. et al., 2013, Monitoring Santorini volcano (Greece) breathing from space, GEOPHYSICAL JOURNAL INTERNATIONAL Volume: 193 Issue: 1 Pages: 161-170 DOI: 10.1093/gji/ggs135
Lagios, E et al., 2013, SqueeSAR (TM) and GPS ground deformation monitoring of Santorini Volcano (1992-2012): Tectonic implications, TECTONOPHYSICS 594, 38-59 doi 10.1016/j.tecto.2013.03.012
Newman, AV et al., 2012, Recent geodetic unrest at Santorini Caldera, Greece GEOPHYSICAL RESEARCH LETTERS 39, L06309 DOI: 10.1029/2012GL051286
Papoutsis, I., et al., 2013, Mapping inflation at Santorini volcano, Greece, using GPS and InSAR GEOPHYSICAL RESEARCH LETTERS 40, 267-272 DOI: 10.1029/2012GL054137
Papageorgiou, E. et al., 2012, Long-and Short-Term Deformation Monitoring of Santorini Volcano: Unrest Evidence by DInSAR Analysis IEEE JOURNAL OF SELECTED TOPICS IN APPLIED EARTH OBSERVATIONS AND REMOTE SENSING 5, 1531-1537 DOI: 10.1109/JSTARS.2012.2198871
Parks, MM et al., 2012, Evolution of Santorini Volcano dominated by episodic and rapid fluxes of melt from depth, NATURE GEOSCIENCE 5, 749-754 DOI: 10.1038/NGEO1562
Parks, MM et al., 2015, From quiescence to unrest – 20 years of satellite geodetic measurements at Santorini volcano, Greece. Journal of Geophysical Research (Solid Earth), doi:10.1002/2014JB011540
Tassi, F., et al., 2013, Geochemical and isotopic changes in the fumarolic and submerged gas discharges during the 2011-2012 unrest at Santorini caldera (Greece) BULLETIN OF VOLCANOLOGY 75, 711 DOI: 10.1007/s00445-013-0711-8
—
M.M. Parks, S. Caliro, G. Chiodini, D.M. Pyle, T.A. Mather, K. Berlo, M. Edmonds, J. Biggs, P. Nomikou, & C. Raptakis (2013). Distinguishing contributions to diffuse CO2 emissions in volcanic areas from magmatic degassing and thermal decarbonation using soil gas 222Rn-delta13C systematics: application to Santorini volcano, Greece Earth and Planetary Science Letters, 377-378, 180-190 DOI: 10.1016/j.epsl.2013.06.046
Pingback: One year of volcanicdegassing | volcanicdegassing
Pingback: The Kameni islands, Santorini, Greece | volcanicdegassing
Pingback: Monitoring the London Volcano – londonvolcano