Our department was recently lucky enough to have Dr. Tim Lowenstein from SUNY Binghamton come give a guest lecture on the changes in the chemistry of seawater throughout geologic time.
Originally, we thought that the major ion chemistry in the past was more or less the same as it is today. However, over the last 10 years this long standing belief has been challenged by many researchers and championed by Dr. Lowenstein. Honestly, when you see the changes in sea water chemistry over geologic time it is pretty mind blowing. Especially when these changes are related to some pretty important events in earth history. I know that the fact that the ocean is really important should not come as a surprise, but it is still amazing when you realize that small thinks like the concentration of magnesium relative to calcium can have a huge global impact.
I don’t want to steal Dr. Lowenstein’s thunder by revealing everything, but I would like to provide some of the key points of his talk and the paper’s that it came from, as well as the innovative methods that his lab uses to find these results.
The whole premise of this research is based on salt and more specifically, where does the salt come from and how does it change over time? The salt in the ocean comes from two main sources. The first is rivers. Rivers carry sediment and dissolved salts from weathering of the continent into the ocean. Should this input of salt to the ocean from the rivers of the world change, so would the salinity of the ocean. There is another important source as well: hydrothermal vents/black smokers/mid-ocean ridges. Basically, sea floor volcanic activity and spreading is responsible for dumping a lot of dissolved minerals and ions into the ocean. These two sources mix to create the salinity of the ocean and control the chemistry of seawater. Should these inputs change over time, so would the chemical composition of the oceans. This is not really that far-fetched an idea, but it is still catching on within the scientific community.
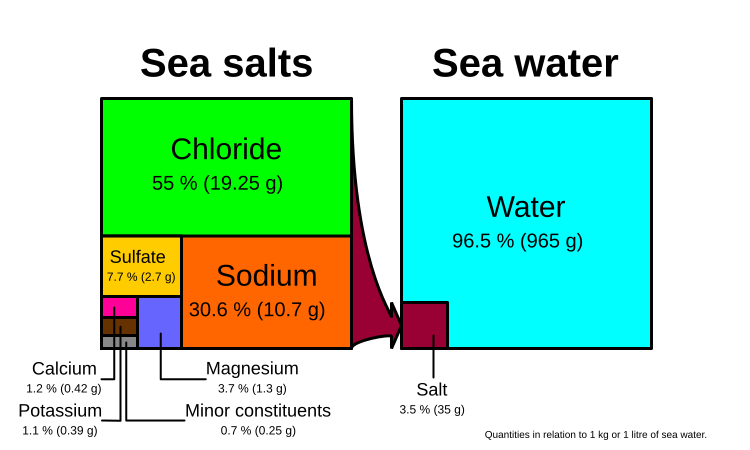
A good image showing both the modern salinity of sea water and the ionic composition of the salts. What if these proportions varied over time? (Source: Wikipedia)
In order to determine the chemistry of ancient seawater Dr. Lowenstein’s lab attempts to find places where seawater could have been trapped from its deposition to now. Obviously, this is a difficult task as there are very few ways to preserve water since, as we all know, it has a tendency to evaporate or flow away. To overcome this hurdle they use fluid inclusions in halite (salt) crystals.
This is pretty ingenious. Halite is formed from evaporating ocean water. As the crystals form they incorporate some of the water they’re forming from in tiny bubbles in the crystal structure, called fluid inclusions. This water is literally trapped forever, or until it is released by breaking the crystal. Therefore, in order to find old seawater all Dr. Lowenstein has to do is find old evaporite deposits, which are scattered all over the globe. I know of one that is Silurian in age not far from Ottawa, which means the fluid inclusions trapped in that halite are 445 million year old ocean water.
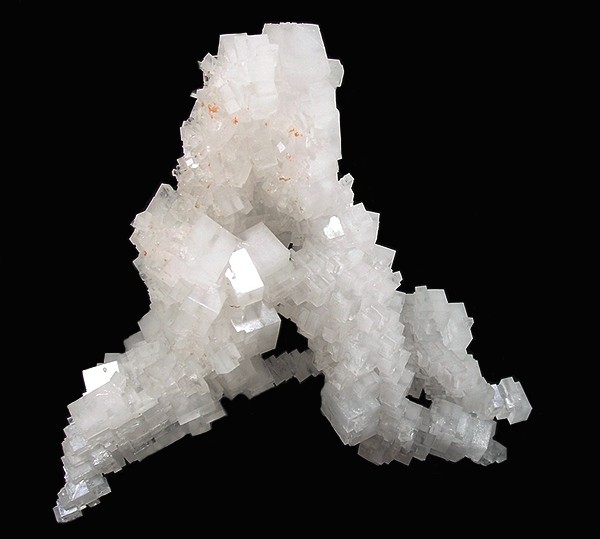
Halite from Potash Corporation of Saskatchewan Mine in Rocanville, Saskatchewan, Canada (Source: Wikipedia)
Once the halite has been collected it is examined under a microscope for the fluid inclusions, which occur along growth lines in the crystal. If they are present, the crystal is placed inside a scanning electron microscope, frozen using liquid N and cleaved along the growth line, exposing the frozen fluid inclusion to the electron beam. The microscope is able to analyse the composition of the ice bubble by producing x-ray spectra that vary based on dissolved ions. This is done 5 times for each inclusion. Using this method Dr. Lowenstein has been able to analyze ancient water throughout the geologic time scale and as far back as 830 million years!!

The scanning electron microscope at the University of Ottawa. (Source)
So what are the results and implications of knowing how the composition of seawater changes over time?
Dr. Lowenstein proposes a link between the chemistry of seawater and the types of skeletons that coral and benthic organisms such as molluscs can form. It is common knowledge to those familiar with the fossil record that the skeletal composition of corals and other reef building organisms has changed over time between calcite and aragonite. These cycles operate on roughly 100-200 million year timescales and it was believed that they were due to changes in the major ion chemistry of seawater in the past. However, these ideas were based on the rock record, which is subject to major chemical change during lithification, and as such the smoking gun to prove this was missing. Enter Dr. Lowenstein. The measurements presented by Dr. Lowenstein in his talk and his paper in Science show that the fluctuations in ancient seawater chemistry correlate very well with the timing of the calcite and aragonite seas and greatly reinforce our understanding of how important the chemistry of seawater is to sustaining and controlling life.
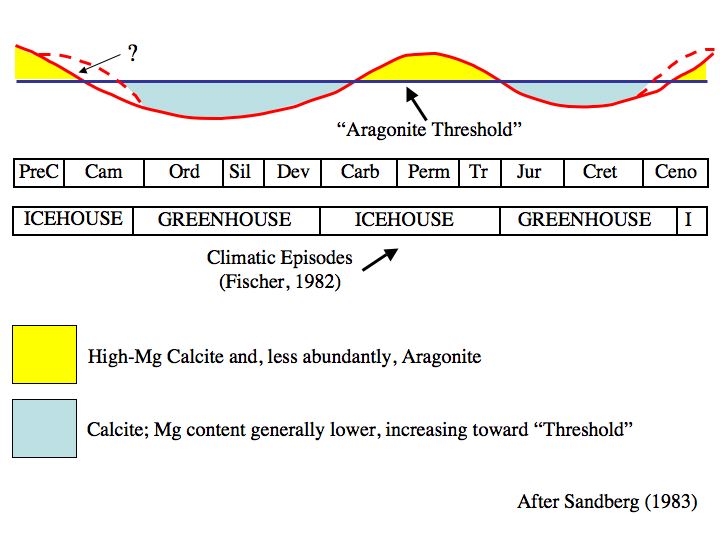
A graph showing the timing of calcite and aragonite seas. The graph by Lowenstein uses actual measurements to substantiate the timing. (Source)
The biggest implication of understanding the history of seawater is the fact that we now know that seawater chemistry has changed! The oceans play such an integral role in sustaining life on Earth and controlling the climate that understanding this system and how it can change over geologic time is crucial to making future predictions about the ocean and how things like climate change or tectonism could affect it. It is no longer acceptable to just think of the ocean as a salty bowl of soup. Indeed, we must now think of it in terms of a fluctuating system that has profound and basic linkages to the way our planet operates.
Thanks for reading,
Matt
References
Lowenstein, T. K., Timofeeff, M. N., Brennan, S. T., Hardie, L. A., & Demicco, R. V. (2001). Oscillations in Phanerozoic seawater chemistry: evidence from fluid inclusions. Science (New York, N.Y.), 294(5544), 1086–8. doi:10.1126/science.1064280
Timofeeff, M. N., Lowenstein, T. K., Brennan, S. T., Demicco, R. V, Zimmermann, H., & Horita, J. (2008). Evaluating seawater chemistry from fluid inclusions in halite : Examples from modern marine and nonmarine environments. Geochimica et Cosmochimica Acta, 65(14), 2293–2300.


.jpg)