EGU Blogs

Geophysics

The coolest way to visualise how planets work

The coolest way to visualise how planets work

It’s not always easy visualising the complex processes which operate on planet Earth. Even more difficult, at least for me, is explaining them to others. That’s why I’m always on the look out for tools that might just help me with that and which I can share with others too. Enter the NASA Visualisation Explorer, and the Scientific Visualization Studio (SVS), which I came across recently.

The first of the two is a cool little app which can you get straight on your mobile device. You can keep up with all of NASA’s most recent findings and search for animations, visualisations and images of the Earth and Sun. I’ve unashamedly taken from the page intro here, but I think it does a great job of explaining what the site aims to do:

“The NASA Visualization Explorer the coolest way to get stories about NASA’s exploration of the Earth, sun, moon, planets and universe.”

Next up, the SVS: If you ask me, a great communication tool, packed with more images, animations and visualisations, which are created by the SVS in collaboration with researchers and scientists. You could literally spend hours exploring the content on the site. The best bit? All the visualisations (of which there are more than 5,500) are free to download!

To showcase just one example of what you can look forward to on the site (just a warning, you could spend hours exploring the content!), I’ve downloaded one of my current favourites: a video showing solar wind hitting Mars’ magnetic field. The video, is part of a series of resources associated with the recent discoveries by the Mars Atmosphere and Volatile Evolution (MAVEN) mission about how Mars lost it’s atmosphere.

Click here to display content from svs.gsfc.nasa.gov

MAVEN has been able to determine that solar wind – a stream of particles, mainly protons and electrons, flowing from the sun’s atmosphere at a speed of about one million miles per hour – stripped the red planet of it’s atmosphere. The findings have huge implications about how crucial it is that the Earth has sustained its magnetic field throughout its lifetime -something which I’ve written about before (and is closely related to my PhD, so I was v. excited about these recent findings).

An Andy Warhol Moment for Liverpool’s Geomagnetism Group – dating the formation of the Earth’s Inner core

An Andy Warhol Moment for Liverpool’s Geomagnetism Group – dating the formation of the Earth’s Inner core

This week, my PhD supervisor, Andy Biggin, had a paper out in Nature. The findings of this new research point towards the Earth’s inner core being older than we’d previously thought. Recent estimates, suggest that the Earth’s solid inner core started forming between half a billion and one billion years ago. However, Andy’s (and co-workers) new measurements of ancient rocks as they cool from magma have indicated that it may actually have started forming more than half a billion years earlier.

I’m not going to go into the details of the findings, you can learn more about those from the paper itself and also from the press coverage (BBC news and an article in The Conversation by Andy himself). Instead, below you’ll find a blog post which Andy originally posted on the Liverpool Geomagnetism Group blog (I reproduced it here with his permission). I found it interesting because it explores (from a scientists’ perspective) the sometimes difficult relationship between research and media coverage. One way to inspire future generations of scientists is by getting new and exciting research in the public eye; something not always easy when researching the workings of the inner Earth – it just doesn’t have the mass appeal and wow factor of volcanoes, earthquakes and tsunamis! The new research has had plenty of media coverage, as Andy describes below, and it’s exciting, not only for palaeomagnetism, but also the broader public as it shed’s light on how the Earth formed and came to be as it is now.


Pop-artist Andy Warhol famously stated that: “In the future, everyone will be world-famous for 15 minutes”. I suspect yesterday may be the closest we will ever get to proving him right.

A paper on which I am lead-author claims that we have may have pinned down the point in Earth’s history when the inner core first started to freeze at the centre of the Earth to between 1 and 1.5 billion years ago.  I already thought this was big news so was a bit deflated when Nature decided not to run with the excellent picture (above) created by Kay Lancaster (cartographer at the University of Liverpool) on its cover or even feature it in its press release.

Nevertheless, our excellent press officer at Liverpool helped produce a great press release which saw a story featured on the popular Phys.org website from the outset and an article in one of Spain’s top newspapers El Pais.

Things were a bit slow-burning for a while – except in India and Finland. Then the break-though – a beautiful piece by Simon Redfern for BBC news online! I checked and it was even linked to the front page of BBC news (though you did have to scroll down a LONG way to get it…).

This was quickly followed up by a piece on the Daily Mail which our press officer tells me is the “most read online news site in the world”. A number of other things have followed including a post on one of my favourite blogs – IFLScience.

Then, just as I was packing up to go home, I received a phone call from the BBC World Service who wanted a short interview. I obliged in the evening and my nervous responses aired a few hours later. You can listen to the podcast here (it is the very last feature – “And finally…”). They refer before and after the interview to the finding as being that the magnetic field is much older than previously thought – incorrect in this specific case but relevant to another recent finding, albeit one that Liverpool people were not involved in making.

More informative is a piece I wrote for “The Conversation”. There has only been one comment at the time of writing – hopefully they will improve…

A summary from our press office indicates that there are 39 news outlets and counting featuring the story  and tweets still coming through every few minutes. The coverage extends over at least 11 countries ranging from USA to China,  Argentina to Pakistan so, while I can, I am claiming (brief) world fame for our research!

By Andy Biggin, Lecturer at the University of Liverpool

This article was originally posted in Geomagnetism.org, you can view the post here.

10 Minute Interview – Live from EGU 2014

Today I had the great pleasure of interviewing Cindy Mora-Stock.

It was a great success as I was finally able to put a face to the twitter handle that I’ve been following almost from my first days on Twitter.  What’s even better is that I can safely say I’ve come away from the interview having made a new friend, as Cindy and I hit it off straight away. The final bonus of choosing to do some 10 minute interviews at EGU 2014 is that I’m actually speaking to people face to face, rather than arranging the interviews via email, you simply can’t beat having a conversation with someone!

Cindy is presenting her research on Friday morning, 10.30-12.30 at session GMPV37 Volcano monitoring with instrument networks: novel techniques, observations and interpretations – Blue poster hall B779. Cindy has also published a number of papers, details of which can be found here.

For these live interviews from EGU2014, I’ve introduced a new question  regarding the interviewee’s experience of the conference. Remember, I’m on the look out for people to interview, so PLEASE get in touch via the blog or on twitter (@lauRob85) if you’d like me to feature you and your research!

Cindy_MoraVital Statistics


Q1) What are you currently working on?

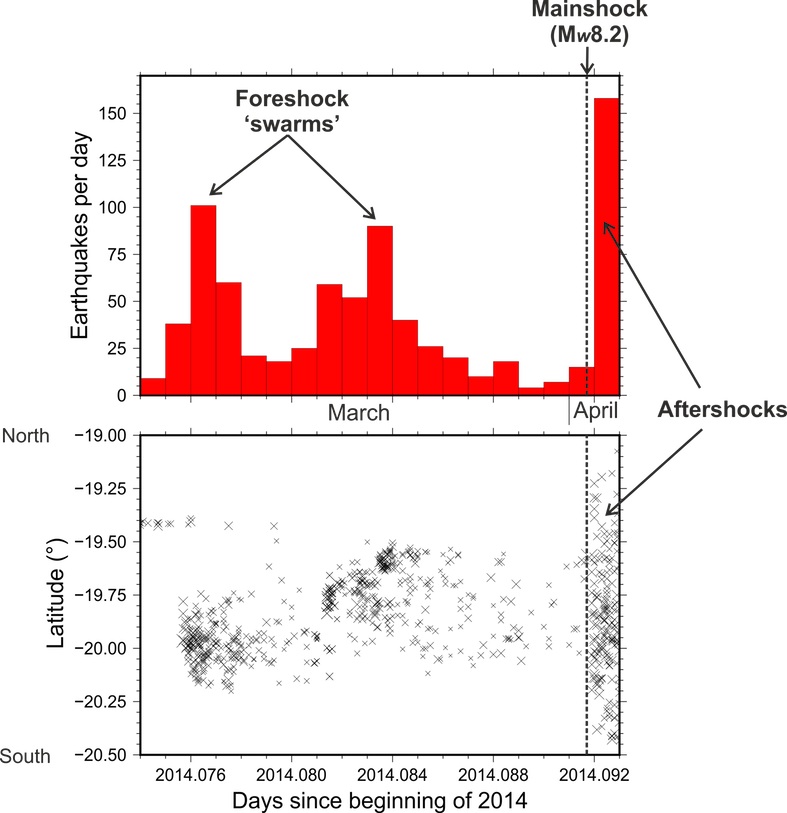
Seismicity and velocity structure of the Villa Rica Volcano, southern Chile.

Q2) What is a typical day like for you?

I would say there is never a typical day. As soon as I get into work I catch-up with colleagues and friends in the office. At the start of every week I like to make a To-Do list for that week and I set out to accomplish something from my To-Do list every day: that might be a figure, a section of code or writing something up. My day tends to end between 6-7pm dependant on how successfully I’m getting through the To-Do list.

Q3) What has been the highlight of your career so far? And as an early stage researcher where do you see yourself in a few years time?

The answer to this question has to be two fold.

Firstly, having had the opportunity to communicate science to people who may have limited scientific knowledge, through studying and researching geosciences.

Being able to visit and get to know places off the beaten track and the scenery of those locations is what really ignites my passion for science.

In a few years time, I’d like to be working at a University or as a researcher at a volcano observatory. Whatever I end up doing, I’m sure I want to continue to be involved with science through science communication, maybe through working in museums or a career in science communication.

Q5) To what locations has your research taken you and why?

I have two favourites: 1)The Chile desert – although I’m not a big fan of places without shade, the experience of being in a place without water, mobile phone signal, water or shelter makes me ask myself the question: If something happened to me out here, what would I do? The colours, structures and geology you can observe in the desert are incredible! 2) A national park in Chile (I can’t quite remember the name, sorry!). There is an amazing view point where you overlook a forest burnt down by a volcanic eruption, but in between the skeletal looking trees you can see new trees growing. That place makes me realise just quite insignificant humans are and how planet Earth would continue on regardless if the human race where to die out.

Q6) Do you have one piece of advice for anyone wanting to have a career similar to yours?

Don’t lose sight of the bigger picture! What your research focuses on might seem insignificant at times, but there is someone out there who does care and to whom your research matters. Motivation is really important!

Q7) What is your highlight of attending the EGU 2014 Assembly?

The opportunity to meet up with old friends and colleagues who work at other institutions and countries as well as meeting and networking with new people.

The short-courses and workshops are also a highlight for me. A couple of years ago I attended a Fourier Series short-course which taught me more in a couple of hours than I learnt during a whole module at University!

Q8) If you could invent an element, what would it be called and what would it do?

Transportanium – an element that would allow tele-transportation. It is important that it is good enough at its job that your body’s atoms aren’t chaotically rearranged once you reach your destination, so that you are still yourself.


When not studying volcanoes and their assocaites seismicity, Cindy can be found head banging at a metal music festival or bar! You can contact Cindy via twitter @Cindy_Sismologa

A foreseeable, yet surprising earthquake?

On Wednesday morning I woke up to a flurry of activity on my twitter feed: there had been a large earthquake in northern Chile. I followed up some of the tweets and realised that there had also been some tsunami warnings as a result of the earthquake. After ascertaining that the scale of the disaster wasn’t as large as I’d anticipated, given the size of the quake (I don’t want you to think for one moment that I am belittling the plight of the people affected by the earthquake. I was more relieved that the damage was not on a larger and wider scale, for instance similar to that caused by the 2011 Tōhoku earthquake and tsunami), I envisaged that there would be frenzied activity at the seismology and geodynamics group at my university.

Turns out I wasn't wrong about the frenzied activity in the seismology office! Photo courtesy of Steve Hicks.

Turns out I wasn’t wrong about the frenzied activity in the seismology office! Photo courtesy of Steve Hicks.

A large amount of the research done by the Liverpool seismology group revolves around understanding the structure and properties of the central Chile subduction zone. So, I got in touch with my fellow PhD student, Steve Hicks (who has guest blogged for us before on the hazards associated with earthquakes) and asked him to write a blog post that might shed some light on the events in Chile.

Steve describes the lead-up to Wednesday’s magnitude 8.2 earthquake, examines what we have learnt so far, and what it may mean for future earthquake hazard in northern Chile.

Earthquakes tend to take us seismologists by complete surprise, but this did not seem to be one of those. We were not alone. The people living in northern Chile were also waiting in anticipation. Over the past few weeks, they had become accustomed to the ground beneath their feet shaking. Within just one week in March, four magnitude 6 earthquakes struck northern Chile and were accompanied by over 300 smaller events.

Aerial view of the rupture area showing the location of the mainshock, and aftershocks with magnitude greater than 5. The colour image shows the preliminary USGS slip model for the mainshock.

Aerial view of the rupture area showing the location of the mainshock, and aftershocks with magnitude greater than 5. The colour image shows the preliminary USGS slip model for the mainshock.

An earthquake was long expected in northern Chile, too. For several decades now, it has been recognised as a seismic gap. We believed that this region was capable of producing large earthquakes, yet a large rupture had not been recorded since 1877. We could not be sure when it was going to rupture again, but the recent earthquake sequence was certainly keeping the seismological community on edge.

Chile is home to some of the world’s largest earthquakes. The country is situated where the eastern part of the Pacific seafloor (the Nazca plate) is sinking beneath the South American Continent. In shallow parts of this subduction zone, the two plates can become stuck and locked against each other, leading to big accumulations of tectonic stress that may be sporadically released every several hundred years.

By taking a closer look at the earthquake, we find that aspects of earthquake were in fact somewhat surprising. The earthquake was located at the edge of a region of the megathrust fault that was according to one model, highly locked. However, according to a preliminary model from the USGS, most slip was located to the southeast of the earthquake epicentre, in a region of low locking. Low locking implies that the fault is constantly sliding and less capable of producing large earthquakes. Data from on-land GPS stations are used to calculate locking, but the accuracy of these calculations tends to be poorer offshore, where much of the fault is located. The primitive nature of the rupture model means that it may also open to errors. To obtain a more robust slip model, scientists will now begin to analyse a wide range of datasets including GPS, seismic, satellite and tsunami observations – a process that will take many months.

Seismicity in northern Chile before and after the earthquake. Earthquake locations taken from the Servicio Sismológico Nacional, Chile.

Seismicity in northern Chile before and after the earthquake. Earthquake locations taken from the Servicio Sismológico Nacional, Chile.

The strong magnitude 7.6 aftershock that hit on Thursday morning reminds Chileans that earthquake hazard still remains high.

Some scientists believe that based on the earthquake’s size and location, it is possible that the northern Chile seismic gap has not yet fully closed. Attention may now be drawn further north and toward the Peruvian border where the potential for a large earthquake could remain. What is for sure though is that earthquake scientists will be working hard and listening to the fault’s crackles to understand better what it may have in store for the future.


If you want to know more about the Chile earthquake, a short list of resources:

http://earthquake.usgs.gov/earthquakes/eventpage/usc000nzvd#summary

http://rt.com/news/chile-earthquake-aftershock-evacuated-025/

https://news.liv.ac.uk/2014/04/01/fluid-pressure-responsible-for-earthquake-magnitude/

http://www.iris.edu/spud/backprojection/6690518