EGU Blogs

climate

Has climate change changed in the media?

Whether in a concerned, neutral, alarmist or sceptical tone, climate change is often reported in the media. But has the press approached this subject differently over the years? Marion Ferrat takes a look at the UK press coverage of the last two IPCC reports and investigates how the treatment of climate change has changed in British newspapers.

Glaciers outside of Ammassalik in Greenland - Source: Christine Zenino, Wikimedia Commons.

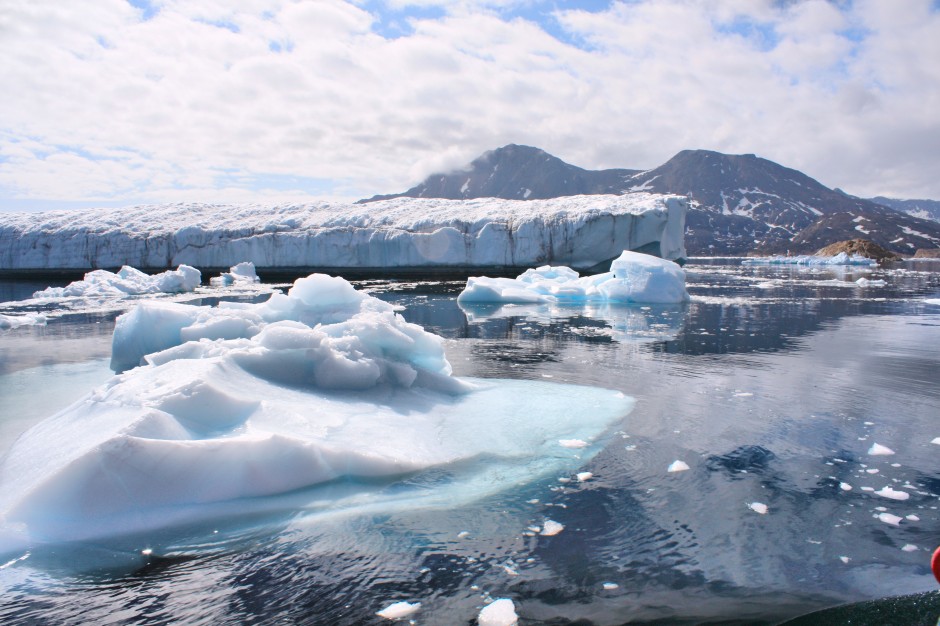
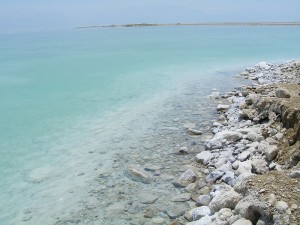
Glaciers outside of Ammassalik in Greenland – Source: Christine Zenino, Wikimedia Commons.

Last week, polling expert Leo Barasi posted the results of a very interesting study in his public opinion blog Noise of the Crowd. Following the waves of flooding that have hit the UK – and been at the centre of the UK press coverage – for the past month, he analysed the trends in flooding stories in the newspapers since 2005. He found that the number of news articles about flooding that also mentioned climate change dropped from 25% in 2009 to 11% last year.

This result reflects a broader trend in the public perception of climate change. Since the 2009 Copenhagen climate change conference, there has been a decrease in the number of people believing in human impacts on climate, and a rise in climate change scepticism.

One of the triggers of this change was the unfortunate email hacking incident at the University of East Anglia, commonly referred to as Climategate. In November 2009, over 1000 private emails between scientists of the Climatic Research Unit were stolen and released online. Some of these emails were interpreted as scientists hiding data in a bid to convince the world of the dangers of global warming. The controversy took the internet by storm and, although a careful investigation later showed that the scientists had not behaved in an untrustworthy way or manipulated any data, the damage was done.

The London Times, 6 July 1863 - Source: Wikimedia Commons.

The London Times, 6 July 1863 – Source: Wikimedia Commons.

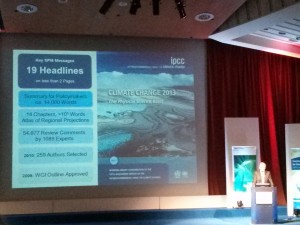
After the release of the last IPCC report in September 2013, I carried out a similar analysis of climate change coverage in the UK press. I compared the press coverage of this fifth Assessment Report (AR 5) with that of the previous report (AR 4) in February 2007. Using a newspaper database called Factiva, I read all the news articles published in eight UK daily newspapers during the week of the two reports’ release1. Here is what I found.

News coverage of IPCC AR 4 and AR 5

The 5th Assessment Report (2013) saw less coverage than the 4th Assessment Report (2007), with 22 and 33 articles, respectively. The majority were published in The Times, The Guardian, The Independent and The Daily Telegraph. Over 80% of the news stories were covered by specialist science or environmental correspondents in 2013, against 48% in 2007.

Table1

What type of climate change?

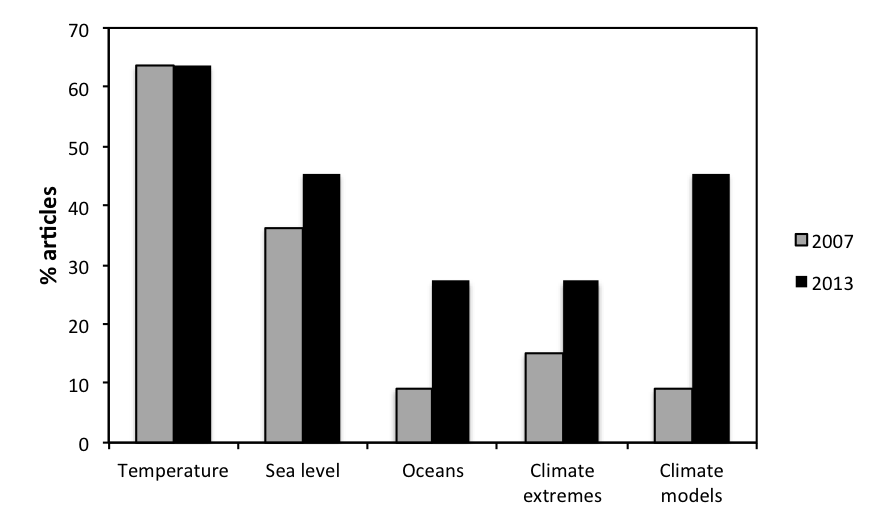
I was interested in what was actually being reported in the press. Were journalists more concerned by air temperatures or ocean warming, or perhaps extreme events?

In 2007 and 2013, all newspapers talked about changes in temperature (64% in both years). Discussions of changes in sea level increased from 36% to 45% in 2007 and 2013, respectively, and climate extremes from 15 to 27%.

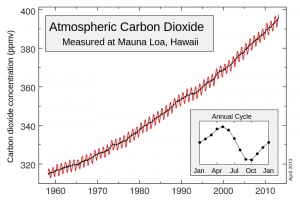
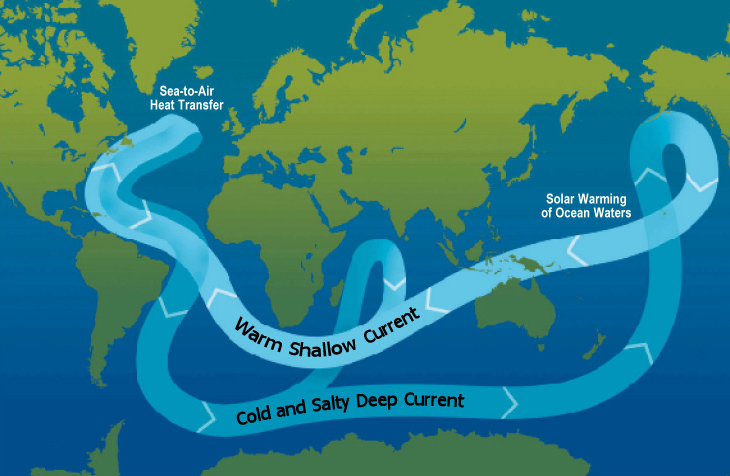
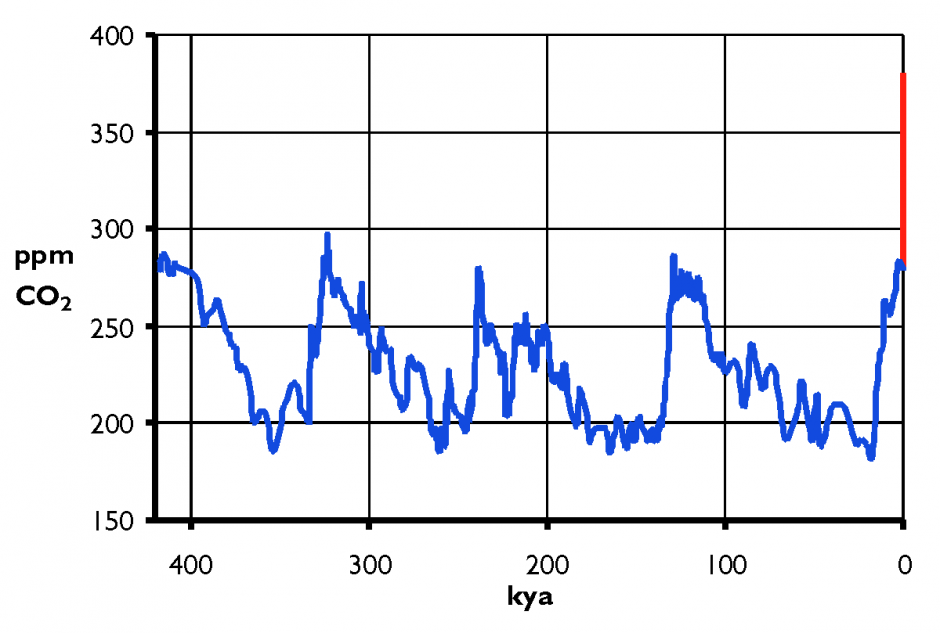
Coverage mentioning the oceans trebled from 9% in 2007 to 27% in 2013. This is interesting given the controversy surrounding the so-called “warming hiatus”. Global atmospheric temperatures have been relatively stable since 1998, and climate sceptics argue this is evidence that CO2 emissions do not dangerously affect temperatures. Scientists have suggested that the oceans have a complex role to play in modulating atmospheric temperatures.

But the most obvious change was the number of articles mentioning climate models. Despite being a central component of scientific results in both reports, references to models in the press were made in only 9% of the 2007 articles against 45% in 2013.

Table2

From scared to sceptical: a changing tone

In 2007, 42% of the articles across all news outlets but The Daily Mirror described the report as bleak, sobering, gloomy, frightening, grim, stark or terrifying. These adjectives were absent from the 2013 coverage, which rather used more neutral words such as most comprehensive, most authoritative or making the most overwhelming case (27% of the articles).

One big difference was the number of direct references to climate change scepticism or denial, which doubled from 30% in 2007 to 59% in 2013.

From cataclysm to careful concern in Britain

Newspapers such as The Daily Express, Daily Mail and The Sun were most concerned with consequences of climate change in Britain. Interestingly, these concerns were different in 2007 and 2013. The references were very sensationalist in 2007, with reports in The Daily Express, The Daily Mirror and The Sun that climate change “would devastate Britain”, which would face “disasters similar to the devastation […] caused by Hurricane Katrina”. They were more moderate in 2013, referring only to Britain likely experiencing “wetter winters and drier summers”.

Says who?

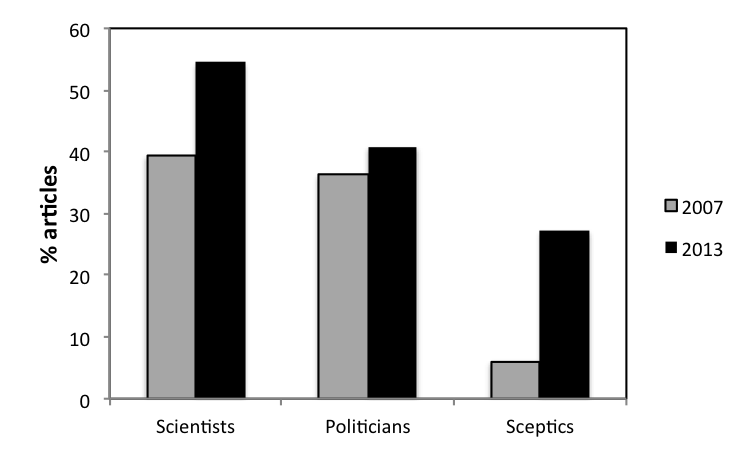
Quotes are an important part of a news article. They give weight to particular aspects of a story and enable journalists to convey opinions whilst maintaining the objectivity of their reporting.

In 2007, 39% of all articles contained quotes from scientists, rising to 55% in 2013. The percentage of articles containing quotes from politicians also rose from 36% to 41%. Most quoted politicians in each case were the Environment Secretary David Miliband (2007) and the Secretary of State for Energy and Climate Change Ed Davey (2013), both stressing the importance of climate change mitigation.

The largest change can be seen in the percentage of articles including quotes from climate change sceptics, which increased from 6% in 2007 to 27% in 2013.

Table3

What has changed?

Overall, the coverage of both IPCC reports was factual, detailed and accurate across all newspapers studied. The 5th Assessment Report saw less coverage than AR 4, suggesting a general dip in public interest in climate change. One interesting point was the discrepancy between the articles’ content and their titles in tabloid papers. Although the articles themselves were generally quite neutral, their titles voiced a much more pronounced scepticism. Given that most people would first and foremost read and remember an article’s title, their wording can have an important impact on public opinion.

The tone of the 2013 coverage was both less sensationalist (e.g. minimal use of words such as stark and terrifying) and more likely to include mentions of- and quotes by climate change sceptics.

In terms of scientific content, the main difference was the inclusion of the concept of climate models and their limitations and strengths in the 2013 press coverage (in 45% of articles against only 9% in 2007). This is possibly also in response to the ‘warming hiatus’, rather than because climate models have been a larger part of AR 5.

The political nature of the climate change debate was seen in the coverage of both IPCC reports, with over one third of the articles quoting politicians in both years.

The biggest difference was the much larger place given to climate change sceptics in the news coverage, nearly doubling from 30% in 2007 to 59% in 2013. Despite the increased certainty of the IPCC results from AR 4 to AR 5 (moving from 90% to 95% certainty that humans are influencing climate), it is clear that there is more room in the media today for uncertainty and climate change scepticism.

Marion

1This study covered the release of the Working Group 1 reports. News articles were selected from the News sections only, by searching for the terms climate change and either IPCC or Intergovernmental Panel on Climate Change.

Snacking on climate

ClimateSnack is a new initiative for early-career climate scientists around the world to improve their writing and communication skills. Snackers get to write tasty climate blogs and discuss them in a friendly and interactive environment. Marion talked to three members of the Imperial College London group for the latest issue of GeoQ!

UnderwoodKeyboardGood written and oral communication skills are quickly becoming a pre-requisite for early career scientists. Writing, presenting, interacting and collaborating are important for making contacts, developing research proposals, applying for fellowships and communicating one’s work. This is particularly true in a very publicised field such as climate change research, where inter-disciplinarity reigns, and the ability to convey ideas to wide ranging audiences is crucial.

But gaining these skills is not always straightforward. Writing and publishing online can be daunting, so can interacting with researchers outside of one’s field.

Born in January 2013 at the University of Bergen, ClimateSnack brings together postdoctoral and PhD scientists across climate change disciplines, and helps them improve the way they communicate their work in a friendly, interactive environment. In July, Imperial College London became the second institution to join what has now become a global network of hungry climate snackers.

Panorama of Bergen - Source: Sindre, Wikimedia Commons.

Panorama of Bergen – Source: Sindre, Wikimedia Commons.

I joined ClimateSnack back in August and have really enjoyed chatting about climate change research with so many PhD and postdoctoral students across the college departments and climate disciplines. When thinking of what to write for the Young Scientists section of the GeoQ issue on climate change, I decided that it would be great to discuss this  initiative that has taught me very  much about communicating climate change research. So I interviewed three core members of the London snacking team and asked them to tell me more about what ClimateSnack is all about. Here is what came out of our interview!

IMG_3971

“ClimateSnack is essentially designed to help early-career researchers develop their writing skills and their communication skills in general”, says Dr Will Ball, a postdoctoral researcher in the department of Physics and the founder of the ClimateSnack group at Imperial College London.

“At each institute that we have set up a ClimateSnack group, we physically bring together people in different areas of climate research. They will write thousand-word blogs about their work, keeping it very simple. In fact you want to keep it at the level that any other climate scientist in a different area of climate research would be able to understand. So as a solar physicist, I should be able to communicate my work to somebody working on, say, atmospheric dust”.

These blog pieces are the climate “snacks” that eventually get published online:

“Then we have a centralised hub that all the institutes publish through, which is the website”, Will continues. “Through that, people will be able to interact, get to know each other and give feedback on the actual writing. So they get better at writing, and also learn about the science that’s going on around them. That’s the concept”.

Sian Williams, a PhD student in atmospheric physics looking at dust plumes and land-atmosphere interactions, runs the day-to-day climate snacking affairs in London:

“We have a meeting once a month where people from different departments across Imperial College come together”.

London snackers Rachel White, Will Ball and Sian Williams.

London snackers Rachel White, Will Ball and Sian Williams.

“Every time, we have a few snacks. I try to encourage people to write them and then send them out to anyone who is coming to the meeting in advance, so that people get a chance to read what has been written and give feedback”.

Writing a snack can be a daunting but rewarding experience. Each author reads out his or her piece and the floor is then open to discussion. I remember that reading my own piece out loud was really quite scary! But it helped very much with improving the post, because one instantly picks up on sentences or expressions that don’t quite fit or contain too much jargon.

“People who have come together from different institutions say what they like about the articles, how they think they can be improved. Normally when you write something, be it for a journal or a website, you never really get that direct feedback, so I think it’s a really great opportunity”, Sian continues.

Dr Rachel White, a postdoctoral researcher in regional climate modelling, has recently published her very first snack, writing about the difficulties of simulating global rainfall patterns: “I actually found that it was easier to write than I thought it would be”.

Detail of the portrait of a young woman with writing pen and wax tablets, Museo Archeologico Nazionale di Napoli - Source: Wikimedia Commons.

Detail of the portrait of a young woman with writing pen and wax tablets, Museo Archeologico Nazionale di Napoli – Source: Wikimedia Commons.

But putting pen to paper is just the first step: “Trying to check that you have really written what you wanted to write, and that people are going to understand what you meant, is the really interesting process”, Rachel adds. “That’s where the ClimateSnack meetings come in. Different people will have got different things from your article. You have to be quite careful so that everybody understands what you meant. That is a really interesting concept to learn and try and get you head around”.

Will is now an experienced snacker: “Publishing online was nerve-racking, but I developed a better sense of confidence in what I’m doing and in my writing”.

These meetings are not just useful for improving one’s writing, but also for placing early-career researchers in a safe, productive environment where they can hone their discussion and personal engagement skills.

“It’s not just writing. At these meetings you have to communicate, debate, argue, discuss, and you get better at that. And it’s in a safe environment. That’s where you build the confidence and then start moving out”, Will explains.

“Important, imaginative work comes out of collaborating with people who aren’t in your field”, Rachel adds. “Being able to discuss your research and describe it clearly to someone who is in a different field is incredibly important, at conferences, over the internet, everywhere.”

For Will, these communication skills are valuable even within one’s own field: “How many abstracts, how many summary papers have you read that are difficult to understand, even in your own field? [ClimateSnack] makes you more aware of the phrases and the words you use. I’ve noticed that in the way I write. I’m just a little bit more aware of what might confuse somebody.”

Source: Daniel Schwen, Wikimedia Commons.

Source: Daniel Schwen, Wikimedia Commons.

ClimateSnack has grown at an incredible pace since January. “We are setting up at many other institutes in the UK, and have interest from several others in Europe and in the United States”, Will tells me. “So it’s going to expand very quickly in the next coming months”.

The success and uniqueness of ClimateSnack lies, I think, in its open and constructive environment, and in the opportunities it creates for early-career researchers to forge international collaborations with other climate scientists.

Concluding our interview, Sian adds: “There are opportunities for climate snackers to go on residential courses across Europe, which is really exciting because it’s not only building skills but again building collaborations with different people. And I think the main exciting thing is more people from different universities getting involved”.

Source: ISS Expedition 34 crew, Wikimedia Commons.

Source: ISS Expedition 34 crew, Wikimedia Commons.

I have certainly loved being part of this exciting group and have learned so much about other branches of climate research. It has been fantastic to meet so many climate scientists from different departments and universities and I look forward to hearing about upcoming snacks at the next meeting!

Marion

Climate and Policy Roundup – November 2013

From London to Warsaw and Tokyo: Flo Bullough and Marion Ferrat discuss some of last month’s hot topics in the climate and policy world.

News

UN Warsaw Climate Talks

COP19_opening_(22)

United Nations Climate Change COP19 Conference. Source – Wikimedia Commons

The UN’s Climate Change Conference in Warsaw concluded this week at the end of a 30-hour deadlock in decision making over the wording of the final deal. After a series of controversies including hunger strikes, walkouts and standoffs the meeting ended with the a deal  hammered out. Countries have until early 2015 to publish their plans on curbing greenhouse gas emissions. There was also much discussion over the ‘Loss and Damage’ framework: delegates agreed to set up a compensation mechanism. Under the agreement, countries will receive some aid if hit by natural disasters but developed countries won’t be considered liable, and the fund won’t start functioning until 2020, the Guardian reported. See the link for more information.

Carbon Brief: Warsaw climate negotiations achieve nuggets of progress but defer major decisions: http://www.carbonbrief.org/blog/2013/11/warsaw-climate-negotiations-achieve-nuggets-of-progress,-but-defer-major-decisions/

On the back of the conference, Nature published an editorial reviewing the state of the world’s climate targets. Despite certain drawbacks and the general gloomy feeling about political action on climate change,  they concluded: “there is reason for hope”.

House of Lords report on Scientific Infrastructure

220px-House_of_Lords_chamber_-_toward_throne

House of Lords Chamber. Source – UK Parliament, Wikimedia Commons.

Earlier in the summer, the House of Lords Science and Technology Committee launched an inquiry into Scientific Infrastructure. The inquiry was launched to collect evidence on large and medium-sized scientific infrastructure currently available in the UK. It aimed to consider the future needs and strategic planning, funding and governance arrangements, international partnerships and partnerships with industry. The final report for this inquiry has now been launched and highlights the following geo-relevant areas.

 – The significant investment and the success of the Diamond Light Source Synchrotron facility

 – The varied and sophisticated nature of work done by the following important NERC funded institutions

  • British Antarctic Survey, British Geological Survey, Centre for Ecology and Hydrology, National Centre for Atmospheric Science, National Centre for Earth Observation and the National Oceanography Centre

House of Lords Publication on Scientific Infrastructure: http://www.publications.parliament.uk/pa/ld201314/ldselect/ldsctech/76/76.pdf

20 things policy makers need to know about science and 20 things scientists need to know about policy-makers!

800px-Upper_Fairfield_Township_gas_well_2a

Science and policy have collided on contentious issues such as shale gas, these tips attempt to help both sides of the process! Source – Ruhrfisch, Wikimedia Commons.

British and Australian scientists put together a list of tips that could help policy-makers and politicians which was published in Nature. These include the importance of bias sample size, randomization and data dredging. By way of response, there was also a ‘Top 20’ of things scientists need to know about policy making written by Chris Tyler at the Guardian.

Nature: Twenty tips for interpreting scientific claims: http://www.nature.com/news/policy-twenty-tips-for-interpreting-scientific-claims-1.14183

The Guardian: Top 20 things politicians need to know about science: http://www.theguardian.com/science/2013/nov/20/top-20-things-politicians-need-to-know-about-science

The Guardian: Top 20 things scientists need to know about policy-making:  http://www.theguardian.com/science/2013/dec/02/scientists-policy-governments-science

Japan scales back on climate change emissions targets

The Japanese government has scaled back its emissions targets after deciding the 25% reduction was too unrealistic. The shift back to coal, oil and gas for power following the Fukishima disaster has hindered recent progress in reductions.

Phys Org: Japan dials back climate change emissions target: http://phys.org/news/2013-11-japan-dials-climate-emissions.html

USGS to monitor water usage in thermoelectric power generation

In line with the ongoing interdependence between water and energy, the United States Geological Survey announced they are to start reporting water usage during thermoelectric power generation in order to quantify the contribution of this energy source to the overall use of water.

USGS Newsroom: Water watch for electric energy production: http://www.usgs.gov/newsroom/article.asp?ID=3735&from=rss

Typhoon Haiyan

Haiyan_Nov_7_2013_1345Z

Satellite image of Typhoon Haiyan. Source – NASA, Wikimedia Commons.

Typhoon Haiyan hit Southeast Asia in early November: an exceptionally powerful tropical cyclone that devastated portions of Southeast Asia, particularly the Philippines, It is the deadliest Philippine typhoon on record,killing at least 5,632 people in that country alone. There has been much discussion about the sometime assumed contribution of climate change to the disaster although this is rejeteced by many scientists.

Nature: Did climate change cause Typhoon Haiyan? http://www.nature.com/news/did-climate-change-cause-typhoon-haiyan-1.14139

Budget hits keeling curve 

The Scripps Institution of Oceanography in California is seeking donations to maintain the historic ‘Keeling Curve’; a 55-year record of rising CO2 levels following years of lack of funding.

The Keeling Curve: Atmospheric CO2 concentrations as measured at Mauna Loa Observatory. Source - Narayanese, Wikimedia Commons

The Keeling Curve: Atmospheric CO2 concentrations as measured at Mauna Loa Observatory. Source – Narayanese, Wikimedia Commons

Nature: Budget crunch hits keeling curve: http://www.nature.com/news/budget-crunch-hits-keeling-s-curves-1.14206

Impacts of U.S. Shutdown on Earth and Space Science

The effect of the US Government shutdown for 16 days in October had

Amundsen-Scott South Pole Station. Source - U.S. Antarctic Program, National Science Foundation.

Amundsen-Scott South Pole Station. Source – U.S. Antarctic Program, National Science Foundation.

far reaching consequences; not least for research institutes and programs. Amongst the research funding casualties was the Antarctic research program. US research programs such as the NOAA, NASA and USGS were all impacted. Eos magazine produced by AGU assessed the impact on the Earth Science Community

Eos: Impact on Earth and Space Science: http://sites.agu.org/wp-content/uploads/2013/10/pdf-of-Govt-Shutdown-story.pdf

Washington Post: Impact on Antarctic Research program: http://www.washingtonpost.com/national/health-science/us-government-shutdown-stalls-antarctic-research/2013/11/17/7f7e9af4-4e2b-11e3-be6b-d3d28122e6d4_story.html

Research Highlights

Crusty algae unravel history of Arctic sea ice

The first high-resolution proxy for Arctic sea ice cover has been discovered.

Demosponges and coralline algae - Photograph: K. Rasmussen, Wikimedia Commons.

Demosponges and coralline algae – Source: K. Rasmussen, Wikimedia Commons.

Long-lived algae living on the Arctic seafloor and build up as tree-ring-like structures on calcified rocks and record centuries of sea-ice history. Their sensitivity to both water temperature and sunlight is reflected in the algae’s growth rates and Mg/Ca ratio. The 646-year record discovered shows that sea-ice cover has seen the steepest decline in the past 150 years, with the 20th century characterised by the lowest area of sea-ice since the 14th century.

High-resolution palaeo-records of Arctic sea-ice are crucial to assess pre-anthropogenic changes in ice cover and complement the satellite observation data available for the last few decades only.

Proc. Natl Acad. Sci. USA http://doi.org/p6g (2013).

20th century warming driven by humans

Human activities are responsible for temperature changes in the 20th century, a new study has shown.

Francesco Estrada and his team used state-of-the art statistical methods to assess the link between temperature, radiative forcing and CO2 emissions over the past century. They showed that temperature changes have been largely driven by atmospheric CO2 concentrations, with a pronounced increase around 1960.

The results also revealed that human activities have driven periods of global warming slowdown, such as the warming ‘hiatus’ observed since the 1990s.

Their study shows that reducing greenhouse gas emissions is an effective way to curb short-term climate warming.

Nature Geosci. doi:10.1038/ngeo1999 (2013).

Natural aerosols matter for climate models

A good understanding of natural aerosol emissions is necessary to better quantify the effects of human activities

Sea spray on Broadstairs Pier - Photograph: Rose and Trev Clough, WIkimedia Commons.

Sea spray on Broadstairs Pier – Source: Rose and Trev Clough, Wikimedia Commons.

on cloud radiative forcing, and therefore climate change.

A study published in Nature showed that uncertainties in the emissions of natural aerosols such as volcanic sulphur dioxide, biogenic volatile organic carbon and sea spray account for almost half of the variability of modelled aerosol radiative forcing.

The results demonstrate the importance of understanding the effects of aerosols on climate in pre-industrial environments, where the impacts of natural aerosols can be studied in detail. This will be important to subsequently reduce model uncertainties of radiative effects in present-day polluted environments.

Nature doi:10.1038/nature12674 (2013).

Around EGU

Radioactive waters, Four Degrees – Marion writes on how radioactive elements make their way to the world’s oceans – and how scientists can use them to study important processes that go on in our waters.

Raising the dead sea, Four Degrees – Flo writes on what can be done to replenish the Dead Sea and

800px-DeadSeaIsrael

Dead Sea, Ein Boqeq. Source – xta11, Wikimedia Commons.

how it fits in with the region’s complex geopolitics.

Geo-Talk on GeoLog – Flo talks about policy and science communication on GeoLog.

Geology for Global Development –  GfGD posted a piece on the role that both science and academia have in successfully bringing together stakeholders in areas where co-operation is essential, but challenging in areas such as Afghanistan, Pakistan and Iran.

Events

Grantham Institute Annual Lecture: Professor Thomas Stocker

Professor Thomas Stocker at the Grantham Institute Annual Lecture, Imperial College London - Photograph: Marion Ferrat.

Professor Thomas Stocker at the Grantham Institute Annual Lecture, Imperial College London – Source: Marion Ferrat.

  • Four Degrees went down to the Grantham Institute for Climate Change Annual Lecture at Imperial College London last week,  given by Professor Thomas Stocker, co-chair of the IPCC working group 1. He gave a very thorough and clear talk about the latest IPCC report and the importance of climate targets with a clear message that we need to act now to tackle climate change.

Imperial College news: Act now to limit climate change says climate expert at Grantham Annual Lecture: 1http://www3.imperial.ac.uk/newsandeventspggrp/imperialcollege/naturalsciences/climatechange/newssummary/news_28-11-2013-11-8-22. Professor Stocker also talks about the public perception of climate change and many aspects of the IPCC report in this Nature Climate Change interview.

Rational Parliament Debate: Fracking and Shale Gas

ESA Launch Swarm

Flo and Marion

Climate change: it’s just a matter of time!

Natural or man-made: what factors are responsible for the climate changes we are seeing today? Ahead of the release of the latest IPCC report next week, Marion Ferrat discusses the different factors affecting climate change and shows that who takes the blame all depends on timing…

Over the past century, our planet’s climate system has been changing. Changes in the composition of the atmosphere, holes in the ozone layer, warming temperatures and sea level rise are only some of the factors that have been observed worldwide.

BlueMarble

Earth taken by the crew of the Apollo 17 spacecraft – Source: NASA, Wikimedia Commons.

A fixed observer looking at our planet for the past few billion years would have seen patterns of warming and cooling of its surface, ice sheets growing to the tropics or shrinking to the tips of the poles, deserts forming, seas drying, oceans overturning and vegetation changing. So who is to blame for our current changing climate? Is climate change natural or man-made?

What factor is most important in driving climate change really depends on the timescale you consider. So let’s take a short journey through climate space and time to shed more light on who is to blame for climate change.

The million-year climate change: blame the continents
The hundred thousand-year climate change: blame the Sun
The thousand-year climate change: blame the climate!
The 21st century climate change: blame ourselves

The million-year climate change: blame the continents

The Earth’s climate history is divided into primary climate periods, millions of years long, of increase or decrease in the temperature of the Earth’s surface and atmosphere. These periods are referred to as Greenhouse Earth and Icehouse Earth (or Ice Age), respectively.

Fictional representation of a 'Snowball Earth'. Source: Neethis, Wikimedia Commons.

Fictional representation of a ‘Snowball Earth’ – Source: Neethis, Wikimedia Commons.

The main characteristic of an Ice Age or Icehouse world is that permanent ice sheets are present at the surface of the Earth. The thick ice sheets covering Greenland and Antarctica today mean that we are currently living in an ice age, which began 2.6 millions of years ago.

In a Greenhouse world, on the contrary, ice sheets and glaciers are absent from the surface of the Earth. At the height of these times, carbon dioxide levels in the atmosphere can vary between a few to a few hundred times their present level.

The exact causes behind shifts between greenhouse and icehouse worlds are still debated but scientists agree that two factors play an important role: the position of continents at the surface of the Earth and the concentrations of greenhouse gases (mainly CO2 and methane) in the atmosphere.

Animation of the breakup of Pangea. Source: USGS, WIkimedia Commons.

Animation of the breakup of Pangea – Source: USGS, Wikimedia Commons.

The position of the continents and oceans is important in driving the million-year-long climate cycles as it has a huge influence on atmospheric composition and oceanic flows (see this cool animation showing the movement of the British Isles over geological time!). For example, the grouping of continents in particular places can stop the flow of warm water from the equator to the poles and cool down polar water, until ice sheets begin to form.

Eruption column rising from the east Ukinrek Maar crater in Alaska - Credit: R. Russell/USGS, Wikimedia Commons.

Eruption column rising from the east Ukinrek Maar crater in Alaska – Source: R. Russell/USGS, Wikimedia Commons.

Plate tectonics can also drive climate change by influencing the concentration of CO2 in the atmosphere. The presence of large volcanoes can play an important role in driving long-term shifts from an icehouse to a greenhouse world because extensive volcanism can release large quantities of greenhouse gases into the atmosphere. Once enough CO2 builds up, the greenhouse effect kicks in and acts to warm the planet, pulling it out of its million-year ice age.

Once an initial change is triggered, the climate system will act to amplify it internally until the switch between ice and greenhouse world is complete.


The hundred thousand-year climate change: blame the Sun

Overlain on top of the huge greenhouse or icehouse periods are shorter, regular periods of climate change.

Over timescales of tens to hundreds of thousands of years, the Earth undergoes cycles of cooling and warming, driven primarily by small changes in the amount of energy received from the Sun. These periods are known as glacial and interglacial cycles, i.e. times within an ice age when the Earth is colder or warmer than average. We are currently living in an interglacial period called the Holocene, which began roughly 11,000 years ago.

An example of changes in eccentricity.

An example of changes in eccentricity.

Glacials and interglacials are driven by what we call orbital changes: small changes in the Earth’s orbit, which alter the amount of solar energy received at the Earth’s surface. These changes are cyclical and known as Milankovitch cycles, after the Serbian astronomer who first recognised them during the First World War.

AxialTiltObliquity

Obliquity or axial tilt – Source: Dna-webmaster, Wikimedia Commons.

There are three types Milankovitch cycles. The first, called eccentricity, is linked to the shape of the Earth’s orbit around the sun. The orbit changes from the shape of a circle to that of an ellipse over average timescales of roughly 100,000 years. When the orbit is more elliptical, the Earth is either closer or further away from the Sun than when the orbit is circular, driving changes in the amount of solar energy received at the surface. Climate data for the past 800,000 years show that ice sheets have grown and shrunk roughly every 100,000 years, likely driven by changes in eccentricity.

1000px-Earth_precession.svg

Precession of Earth’s rotational axis due to the tidal force raised on Earth by the gravity of the Moon and Sun – Source: NASA/Mysid, Wikimedia Commons.

The second type is linked to changes in the Earth’s axis. The Earth rotation axis is tilted; this tilt is largely what drives our seasons. The amount of tilt (or obliquity) also varies with time, over periods of roughly 41,000 years.

Finally, if one could watch the Earth from a fixed star in the universe, they would see its axis rotating slightly, a little bit like the wobble of a spinning top as it slows down. This is called precession and changes over periods of roughly 23,000 years.

The 100,000, 41,000 and 23,000-year Milankovitch cycles alter the amount of sunshine received on Earth and drive many changes in the Earth’s climate on these timescales, as has been observed in temperature and CO2 records.

The thousand-year climate change: blame the climate!

X-ray photo of surface sediment (0-25 cm) from the Southern Ocean with scattered gravel as ice rafted debris - Source: Hannes Grobe/AWI, Wikimedia Commons.

X-ray photo of surface sediment (0-25 cm) from the Southern Ocean with scattered gravel as ice rafted debris – Source: Hannes Grobe/AWI, Wikimedia Commons.

In the last decades of the 20th century, scientists began to find clues in the geological records of the North Atlantic Ocean and Greenland ice sheet that climate change was also occurring at higher frequencies than those linked to orbital and tectonic cycles.

Icebergs contain plenty of eroded rock and sediment. When they break-off into the ocean and melt, much of this material falls to the seafloor and can be seen as anomalies in the geological record called ice-rafted debris. Ocean cores revealed that thousand-year pulses of such debris could be found regularly throughout the past 100,000 years, suggesting rapid periods of iceberg break-off and discharge of cold water to the North Atlantic Ocean.

The Greenland ice cores also revealed that periods of rapid warming followed by slow cooling were occurring every few thousand years. These events seem to occur roughly every 1,500 years, though precise dating on these timescales can be difficult.

Such events are known as millennial cycles and are what scientists refer to as ‘abrupt’ climate change.

Similar changes have since been recognised in many locations, including the north Pacific Ocean and the tropics, suggesting that changes can be rapidly transferred between different regions of the globe by the climate system itself. One possible mechanism is that large bursts of cold water in the North Atlantic Ocean could alter the global circulation of ocean currents, which is largely driven by density changes in the North Atlantic region.

The global circulation of the oceans, known as the 'conveyor belt' - Source: Thomas Splettstoesser, Wikimedia Commons.

The global circulation of the oceans, known as the ‘conveyor belt’ – Source: Thomas Splettstoesser, Wikimedia Commons.

The 21st century climate change: blame ourselves

So Earth’s climate has changed drastically throughout the course of its history, driven by external factors such as changes in the Earth’s orbit and internal factors such as tectonics and physical connections between different parts of the climate system. Yes, these climate changes are natural and, yes, temperatures and CO2 have at multiple times been higher than they are today.

However, there are a few points worth making:

Smog over Beijing, China - Source: Marion Ferrat.

Smog over Beijing, China.

#1 – The most drastic changes have occurred very slowly, on timescales of hundreds of thousands to millions of years. These are thousands of orders of magnitude larger than that of a human life;

#2 – At all scales, atmospheric CO2 concentrations have played a huge role in climate change, contributing largely to the greenhouse effect, affecting ocean composition and acidity and being a crucial component of plant and animal life cycles;
#3 – Until the start of the industrial revolution, humans in our modern societies have evolved and lived through relatively stable climate conditions , with stable CO2 concentrations between 260-280 parts per million (ppm) for the past 10,000 years;
#4 – CO2 levels have constantly increased since the industrial revolution due to human emissions. A record global atmospheric CO2 concentration of 400 ppm was observed in May 2013 at the Hawaiian Mauna Loa observatory. This is the highest CO2 level in over 800,000 years, higher than any other interglacial period during this time.

Atmospheric CO2 during the past 417,000 years (417 kyr). Blue: CO2 records from ice cores drilled at the Vostok station in Antarctica; Red: CO2 increase to 380 ppm between 1800 and today due to anthropogenic emissions from fossil fuels-  Source: Hanno, Wikimedia Commons.

Atmospheric CO2 during the past 417,000 years (417 kya). Blue: Records from ice cores drilled at the Vostok station in Antarctica; Red: CO2 increase since 1800 due to anthropogenic emissions from fossil fuels – Source: Hanno, Wikimedia Commons.

The speed at which this human-induced rise in CO2 has occurred is worrying, increasing by nearly a third in just over 150 years.

The climate system will adjust to these changes over the next centuries as it has in the past. But the real issue is that these adjustments will not be in line with our modern inhabited world. As millennial cycles have shown, polar changes can be transferred between different regions of the Earth in ways that we still do not fully understand. Humans as a whole will likely adapt to future climate repercussions but particular vulnerable regions and communities will not.

Atmospheric CO2 concentrations measured at Mauna Loa, Hawaii - Source:  Robert A. Rohde, Wikimedia Commons.

Atmospheric CO2 concentrations measured at Mauna Loa, Hawaii, since 1960 – Source: Robert A. Rohde, Wikimedia Commons.

Modern climate change is not a case of the end of the world but more of the end of the world as some people know it. Small islands and low-lying regions will suffer, so will areas affected by unpredictable droughts or floods.

By contributing in such an excessive way to concentrations of atmospheric CO2, humans are to blame for the climate changes we will continue to see in coming decades and even centuries; and not all of us will be able to adapt to it.