EGU Blogs

Four Degrees

What’s geology got to do with it? 4 – Tennis!

What’s geology got to do with it? 4 – Tennis!

 As part of the ‘What’s geology got to do with it?’ series, Flo takes us on a tour of the links between geology and tennis! Warning: You may not want to read this if you have no interest in Geology OR tennis…. 

Now the disclaimer’s out of the way, I thought it was about time I married two of my greatest loves in life, Geology and Tennis. These two interests may seem completely at odds in terms of relevance, but as is the beauty with geology, it relates to just about everything!

So, summer in the northern hemisphere and therefore the two biggest Grand Slams in tennis are upon us!  The French Open, the king of the clay-court season is currently underway and Wimbledon, the jewel (and one of the few remaning…) grass court tennis tournaments is just around the corner.

But for a sport containing so few tangible objects: a court, a racket, a person and a tennis ball, how does it relate to Geology? Well….

Tennis Courts

491px-ND_DN_2006FO

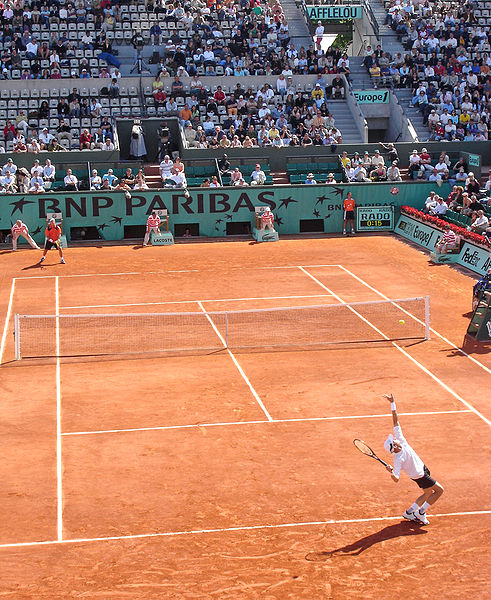
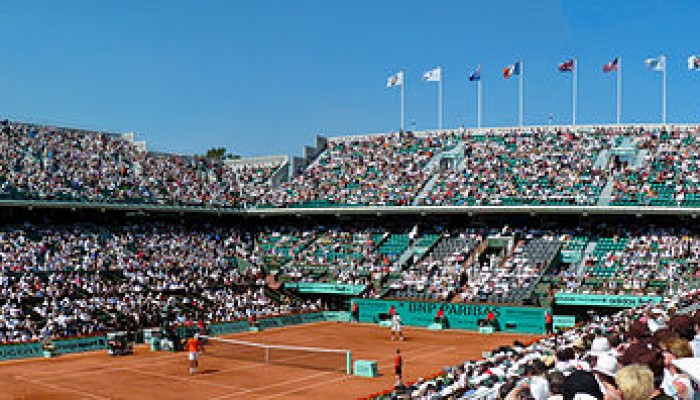
Court Philippe Chatrier Court at the French Open, the only Grand Slam played on red clay. Source – Wikimedia Commons

Professional tennis is  played on 3 types of court surface, each with its own season during the tennis calendar.  You have the hard court season, which dominates most of the year between July and February, beloved by Djokovic, then you have the European and North and South American clay court season from February to May, favourite of clay-court extroadinaire Rafa Nadal and then the shortest season of all, the grass court season, occupying all of 4 weeks in the summer, from June-July, once dominated by Federer and recently by Murray! The most obvious link to geology here is the clay courts, so how do you go about building a clay court and what materials do you need?

Red Clay Courts

Well first of all, very few clay courts are actually made of natural clay. This is because they can take a very long time to dry out (which you’ll know if you’ve ever done any pottery….). For this reason, the red clay courts as seen at the French Open and numerous other clay court tournaments are actually made from crushed brick or shale. Bricks are used because they absorb water less easily than natural clay and are produced from a mix made from Alumina (clay), sand, lime and iron oxide before being fired until dry.


guga-kuerten-trophy-frenchopen08

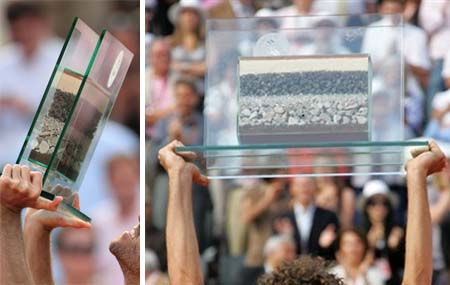
Guga Kuerten being awarded a cross-section of the court in his last match at the French Open in 2008. Source – Tennis Served Fresh Blog

So if you want to build a clay court like the famous red-clay courts of the French Open, first of all you need to lay a base layer, this is covered with a layer of crushed stones, this is then overlain by a layer of clinker. This is then followed by a layer of crushed limestone and finally, the crushed brick forms the thinnest layer at the top. A cross section of the layering under the court surface formed the trophy that former French Open champion Guga Kuerten received when he played his last match at the tournament in 2008!

800px-Drying_mud_with_120_degree_cracks,_Sicily

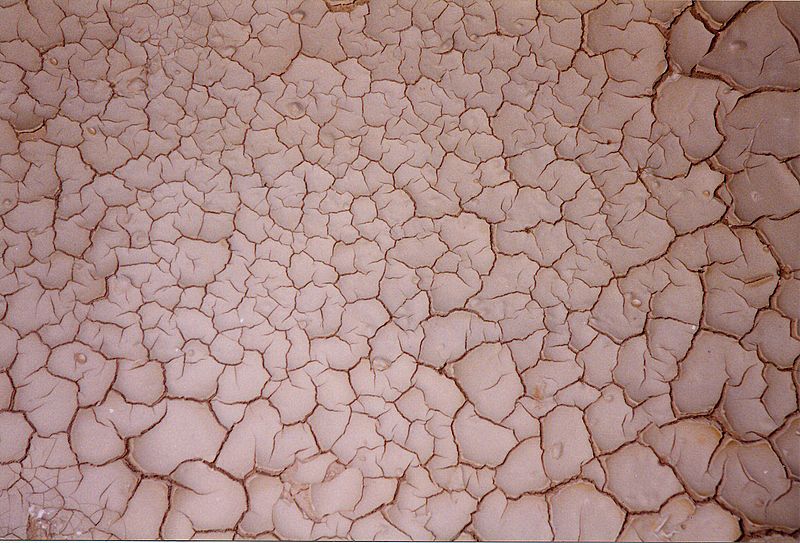
You wouldn’t want the Philippe Chatrier court looking like this after a few hours of sunshine! Source – Wikimedia Commons.

Maintenance of the court after completion is a bit tricky as the clay needs to be constantly smoothed and watered in order to prevent dewatering cracks, a feature that many geologists are very familiar with!

Green Clay Courts
800px-Maria_Sharapova,_2008_Family_Circle_Cup

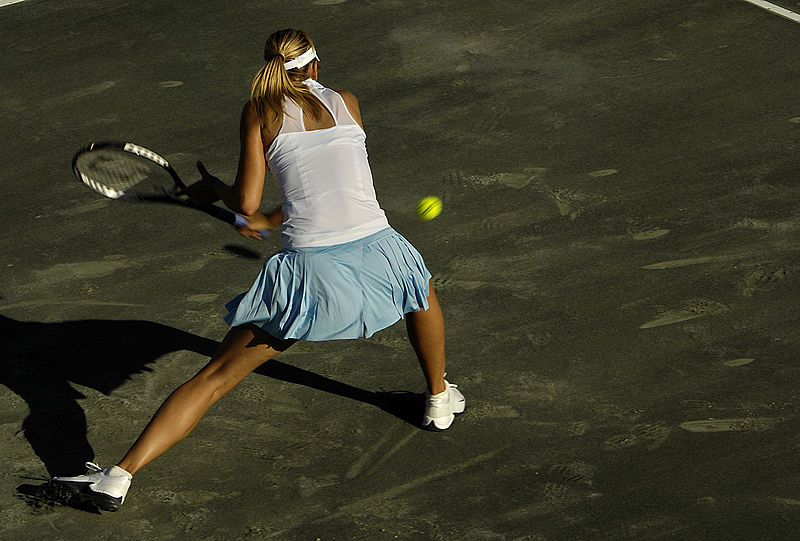
Maria Sharapova playing on the ‘green clay’ at the Family Circle Cup. Source – Wikimedia Commons

Not all tournaments use red clay, so called ‘green’ clay’ or ‘Har-Tru’ has become very popular in the United States. Har-Tru courts are similar in construction but are made from crushed basalt rather than brick meaning they are slightly harder and faster. According to their website, Har-Tru courts are made from ‘billion-year old Pre-Cambrian metabasalt found in the Blue Ridge Mountains of Virginia‘. This rock has two important properties, which is that it is hard and angular which allows it to ‘lock together to form a stable playing surface’ and the hardness provides ‘exceptional durability’.

Tennis rackets

800px-Tennis_Racket_and_Balls

A modern tennis racket with a carbon fiber-reinforced polymer frame. Source – Wikipedia Commons

As with many manufactured items, the raw materials required to make them eventually leads us back to our natural resources in the ground. Earlier tennis rackets were always made from wood, with strings made from gut, but these days, advancements in materials technology means that the majority of professional frames are made from ‘high modulus graphite and/or carbon fibre while titanium and tungsten are often added to give the frame more stiffness and the strings are made from nylon (although Federer and Sampras are famous for using natural gut strings).

Supplies of pure titanium are rare although titanium ores such as ilmenite and rutile are much more common. Titanium is largely mined in the titanium-rich sands of Florida and Virginia as well as Russia, Japan, Kazakhstan and other nations. Much more rare is Tungsten, which has seen a rapid rise in price in recent years as supplies dwindle. Tungsten has recently emerged as a ‘critical’ metal with the majority of the world’s tungsten supply located in China. However Hemerdon mine  in Devon which has been closed since 1944, is thought to host one of the largest tungsten and tin deposits in the world, and is set to reopen under control of an Australian firm in the near future with permit plans progressing this year.

For more on how a tennis racket is made: http://www.madehow.com/Volume-3/Tennis-Racket.html
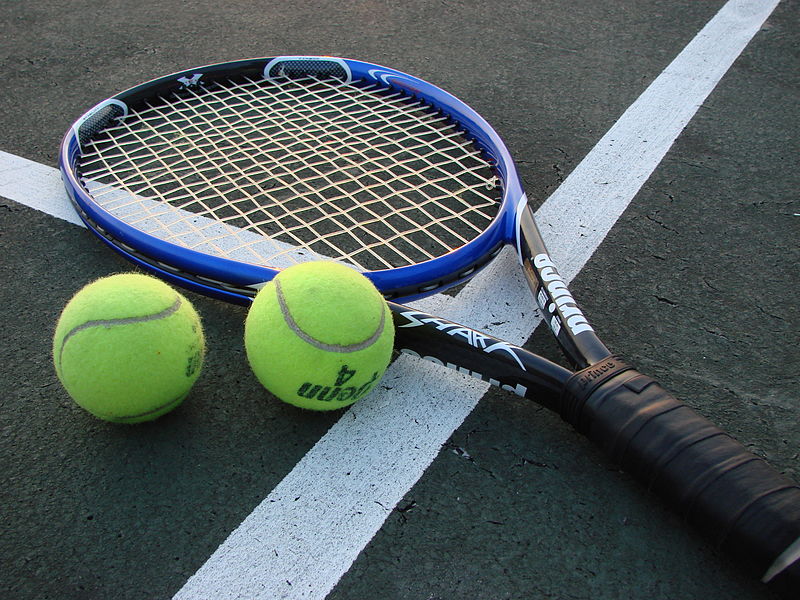
Tennis Balls

427px-Tennis_balls,_advertisement,_19th_century

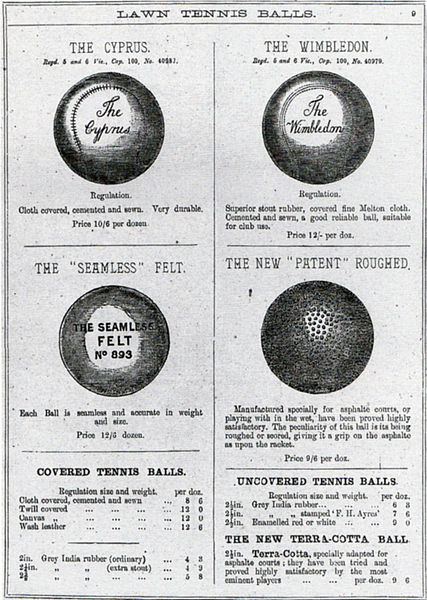
Tennis ball advertisment, 19th century. Source – Wikimedia Commons

According to an article in the guardian published in 2013, manufacture of Slazenger tennis balls now has a 50,000 mile production journey before they end up in Centre Court at Wimbledon. Part of this journey includes the transport of various mineral resources. These include the transport of clay from the United States,  Petroleum Napthalene (derived from coal tar) from China, Sulphur from South Korea, Magnesium Carbonate from Japan, Silica from Greece and Zinc Oxide from Thailand. This exemplifies not just the truly global nature of the manufacturing markets but also the complex importing and exporting of many natural resources for something as simple as a tennis ball.

For more on how tennis balls are made, see the ITF website: http://www.itftennis.com/technical/balls/other/manufacture.aspx


Tennis Net

courtmaster-net

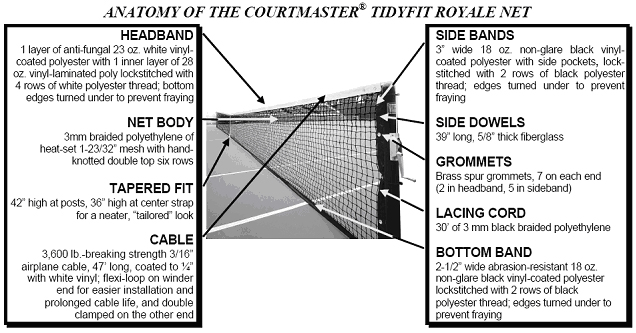
Anatomy of a tennis net. Source – Do it tennis website.

The majority of the different parts of a tennis net are made up from either polyester or polyethylene, both formed synthetically. However, the raw materials required to synthesise both materials  started off as extracted hydrocarbons. Polyester synthesis requires the polymerisation of ethylene which is derived from petroleum.

60 million tonnes of polyethylene is manufactured each year and is the world’s most important plastic. It is made by several methods by addition polymerisation of ethene, which is principally produced by the cracking of ethane and propane, naptha and gas oil, all hydrocarbon fractions. In Brazil, a plant is being constructed to make polyethylene from sugar cane via bioethanol.


And that’s how geology underpins everything we know and love about tennis!


For more information on the link between sports and geology, see the United States Geological Survey’s article on ‘Minerals in Sports: Tennis’: http://minerals.usgs.gov/minerals/pubs/general_interest/sport_mins/tennis.pdf

Untangling EU Research Funding and Science Policy

In this week’s post, Flo talks us through the basic workings of the European Commission and how EU policy relates to science and research. 

While the great and the good of academia are reaping the benefits of international research collaboration at EGU this week, and with the upcoming European elections in May I thought it was worth trying to write something on the EC and science policy. Especially as today’s theme at EGU was the role of geoscientists in public policy. Now I realise that I say ‘untangling EU science policy’ in the title but this is no mean feat! 

6148133110_4e93d205fe_z

The EC and its regulations can seem like an impenetrable fortress but it has a significant impact on UK policy and research funding. Senate House, inspiration for Orwell’s ‘Ministry of Truth. Source – Onona on Flickr.

Even for someone who works in policy, the EC and all its complex committees, processes and regulation can seem like taking a trip to an Orwellian-style ministry of information. Trying to understand and make sense of the EU regulation behemoth can feel like being lost in a bureaucratic miasma. Having said that it has a significant influence on the research and policy-making that goes on in the UK in terms of providing funding and regulation and I thought it would be worth highlighting what impacts membership of the EU has on science and funding.

The Basics

When it comes to decision making within the EU there are three important areas

  1. The European Commission – this is made up of 28 commissions, it has the ‘right of initiative’ and it implements EU policy and decides on the budget.
  2. The European Parliament – this has 766 members representing European Citizens (which we get to vote on) and is responsible for adoption of legislation and the budget as well as for democratic supervision.
  3. The European Council – this is made up of 28 ministers representing member states, is also responsible for adoption of legislation and and budget and in concluding international agreements.

The EC is then split into Directorate-Generals for which research falls into ‘Research and Innovations’. It also has other science-relevant remits such as energy, environment and climate action.

Research and Funding

Following the signing of the Lisbon treaty in 2007 the EU and its member states have a shared competency in the field of research and space which is largely exercised through funding. The EU decision makers, when it comes to research and innovation, are the Directorates of Research and Innovation and Education and Culture and in the Parliament, the Committees on Industry Research and Energy, and Culture and Education.

So how does this work in practice? Well, in terms of the science and funding elements of the system, it starts with the EU 2020 strategy and feeds down into implementation and funding.

The EU2020 strategy – one of the flagship initiatives is to to develop Europe as the most competitive and dynamic knowledge based economy in the world.

Down-arrow-smaller

This feeds into the Innovation Union Flagship Initiative – this includes a series of ‘grand challenges’ such as Climate Change.

Down-arrow-smaller

There is also the European Research Area (ERA) – this is an Europe wide single market for research, innovation and knowledge.

Down-arrow-smaller

This then feeds into Horizon 2020, an EU funding programme for research and innovation.

The ERA is a ‘unified research area in which researchers, scientific knowledge and technology circulate freely’ and has an agenda with five main priorities:

  1. To create more effective national research systems, the UK already has a competitive research sector and the aim is to make other EU countries more competitive.
  2. Optimal transnational cooperation and competition – common research agenda on grand-challenges.
  3. An open labour market for researchers.
  4. Gender equality and gender mainstreaming in research to end the waste of talent not progressing into academia.
  5. Optimal circulation and access to and transfer of science knowledge including the development and implementation of open access to research results from projects funded by the EU Research Framework Programmes.

This all boils down into the Horizon 2020 – the EU framework programme for research and innovation which launched in January this year. Horizon 2020 is the biggest EU research and innovation programme ever with nearly €80 billion of funding available over 7 years, between now and 2020. It is the financial instrument implementing the Innovation Union initiative, which was a ‘Europe 2020 flagship initiative aimed at securing Europe’s global competitiveness’. Horizon 2020 has a greater focus on innovation compared to previous frameworks and is made up of a ‘3 Pillar Structure’ (see below image).

EC Science Policy

The three pillars of Horizon 2020 funding. Source – the EC website.

On the first pillar, where research money is delivered on the basis of excellent science only with no georaphical quota, the UK does very well (See this interesting article on the success of UK funding proposals) and was by far the most successful EU nation in winning grants from the European Research Council in the last round. As an example, the new National Graphene Institute at Manchester University was funded by the European Regional Development Fund who paid £23m of the £61m overall cost.

Horizon 2020 is open to everyone, and is designed with a simpler structure that reduces red tape. One of the many frequent complaints about securing research funding is the long application process which can be an institutional headache (not surprising really trying to harmonise processes in 28 member states!) and so the new funding round is due to deliver simpler application processes. It aims to develop the European Research Area to create a single market for knowledge, research and innovation. Horizon 2020 is the principal funding tool to realise the ERA, it funds all kinds of research.

In the case of countries that are not part of the EU, there are some collaborative projects and coordination between countries such as Iceland, Switzerland (although the situation with Switzerland has been up in the air for some time since their recent referendum on immigration quotas and how this interacts with the EUs freedom of movement directive) and Israel and the EU. These collaborative projects usually run for up to 5 years.

Examples of ERC funded projects in geoscience include: A century of climate change in South Asia, Marine Algae and the link between CO2 and past climate, World Water Week ERC projects, Corals and Climate Change,  Evolutionary Biology, Developing marine-based sesimic-wave sensors, coring for CO2 in the Antarctic, how micro-fossils can help us understand climate change and many other topics.

Policy

When it comes to EU legislation, the EU can only do this where it has been empowered to do so by treaties. These are primarily in areas of trade. There are 3 types of EU legislation: (more on this here)

  1. Regulations – directly applicable to all member states and are binding.
  2. Directives – binding on member states but they decide how they should be implemented in order to achieve the required aim.
  3. Decisions – these are binding on whom they are directed to.

Like in the UK, the EC currently also has a top Chief Scientific Advisor, Scottish biologist Professor Annie Glover who was appointed in 2011 although there is a question mark as to whether that role will remain under the next President.

Important scientific areas that are regulated by the EU include Environmental and Climate Change Policy. In the Directorate-General of the Environment, there are policies on Air, Chemicals, Land Use, Marine and Coast, Soil, Waste and Water (including the water framework directive which the UK has adopted) and in Climate Change policy the important policy being the EU 2030 decarbonisation targets.

The EC holds extensive stakeholder engagement as part of its policy implementation through its public consultations, the themes of which are related to upcoming policy initiatives. Upcoming topics that are geo-relevant include Renewable Energy, Extractive Industries and Land as a Resource.

This is just an introduction to EU science policy, well done on making it to the bottom of the article: i’ll leave you with this, which popped into my head when thinking about this post!

Click here to display content from YouTube.
Learn more in YouTube’s privacy policy.


Further Reading

Science Council Consultation Response: Government’s review of the balance of competencies between the United
Kingdom and the European Union – Research and Development

European Commission: Practical Guide to EU funding opportunities 

BBC News: Horizon 2020 UK launch for EU’s £67bn research budget

European Commission: Open Consultations 

NB: Some of the information in this post is taken from a presentation given by Lisa Bungeroth, Policy Officer at the UK HE International Unit.

Citizen science: how can we all contribute to the climate discussion?

Until the turn of the 20th century, science was an activity practiced by amateur naturalists and philosophers with enough money and time on their hands to devote their lives to the pursuit of knowledge and the understanding of the natural world.

Hand-colored lithograph of Malaclemys terrapin, in John Edwards Holbrook's North American herpetology. Source - WIkimedia Commons.

Hand-colored lithograph of Malaclemys terrapin, in John Edwards Holbrook’s North American herpetology. Source – Wikimedia Commons.

Today, scientific research is an industry of its own, carried out by highly trained and specialised professionals in academic institutions and research laboratories. From the outside, the world of science can sometimes seem like a mysterious one. A world that conveys wonder yet can feel impenetrable and somewhat detached from the reality of our daily lives.

But science is not that far removed from us, and anyone with an interest in anything from astrophysics to ecology and climate change can get involved and become a citizen scientist.

Citizen science is the engagement of amateur or nonprofessional scientists in scientific research, either through observations in nature, data analysis, or loaning of tools and resources such as computer power. Though the concept has picked up in recent years, citizen science is nothing new: Charles Darwin relied on the observations of amateur naturalists around the world to develop his theory of evolution.

1837 sketch by Charles Darwin of an evolutionary tree. Source - Wikimedia Commons.

1837 sketch by Charles Darwin of an evolutionary tree. Source – Wikimedia Commons.

From bird watching to galaxies

Citizen scientists can get involved in a number of projects, depending on their interest, how much time they would like to spend, and what facilities they are prepared to loan.

The spiral galaxy NGC 1345. Source - ESA/Hubble/NASA.

The spiral galaxy NGC 1345. Source – ESA/Hubble/NASA.

Astronomy lovers can participate in the Galaxy Zoo project, where members of the public are asked to help classify galaxies. Humans are much better at pattern recognition than computers, and scientists simply to not have the time and resources to analyse the thousands of images of galaxies captured by telescopes. Amateur astronomers participating in Galaxy Zoo lend their eyes to carry out this task and millions of classifications have been carried out through the project.

Citizen science doesn’t just happen on people’s computers. In the spirit of Darwin, many ecology and wildlife scientific projects make use of thousands of amateur observations. Since the launch of the Garden Birdwatch in 1994, bird lovers help the British Trust for Ornithology understand how birds use our gardens through weekly observations of what species fly into their back yards. For the BioBlitz project, professional and amateur naturalists get together for an intensive 24-hour classification of all species of mammal, bird, insect, plant and fungus found in a particular space.

Great tit in a garden in Broadstone, UK. Source: Ian Kirk, Wikimedia Commons.

Great tit in a garden in Broadstone, UK. Source: Ian Kirk, Wikimedia Commons.

Many people have the desire, ability and tools to contribute to research activities. By facilitating the communication between research, policy and the public, citizen science is another instrument for public engagement, with potential mutual benefits for all.

How can citizen science help with climate change research?

In the wake of devastating events such as storm Sandy, typhoon Haiyan, Australian bushfires or the recent floods in the UK, the big question on everyone’s lips is this: Is climate change to blame for more frequent and powerful extreme weather events?

Typhoon Haiyan captured MODIS on NASA's Aqua satellite. Source: NASA, Wikimedia Commons.

Typhoon Haiyan captured MODIS on NASA’s Aqua satellite. Source: NASA, Wikimedia Commons.

The process of linking specific extreme weather patterns to global climate change, what scientists call attribution, can be tricky. In order to define a causal relationship (did A cause B? Did climate change cause the UK storms?), climate scientists need strong statistical proof. This requires thousands and thousands of simulations of a particular set of conditions, so that any interesting climate trend can be established enough times to be “statistically significant”. But extreme weather events are, by definition, a result of rare and unusual weather conditions and so a great number of simulations have to be run to produce statistically relevant data.

Such a large number of simulations takes time and produces terabyte after terabyte of data that must then be analysed. This requires huge computing resources and universities and research centres often do not have the physical resources to carry out all these simulations rapidly.

 UK Floods, Staines-upon-Thames. Source: Marcin Cajzer, Wikimedia Commons.

UK Floods, Staines-upon-Thames. Source: Marcin Cajzer, Wikimedia Commons.

The new weather@home project, set up by a team of Oxford climate scientists, asks interested members of the public to loan their spare computer time to help climate scientists run more numerous and faster climate simulations. It specifically aims to determine whether the UK’s wet winter and unusually strong storms were triggered by rising atmospheric CO2 concentrations and associated climate change.

How does it work?

For climate simulations to work, scientists have to tell the model where to start. For a chosen period of time to be modelled, they enter the set of particular conditions (“initial conditions”), such as atmospheric temperature, humidity, wind speed and greenhouse gas levels, that was observed at the start of the chosen period. They might decide to start their model one particular month and will use relevant data for that month as the model’s starting point.

Using these initial conditions, the model will then calculate how weather conditions evolve over time. Looking at the specific period of time when an extreme weather event occurred, scientists can model that same period thousands of times over in their climate model to see how often the model predicts the extreme event, and how often weather patterns unfold as normal, with no extreme event.

To determine whether this winter’s storms are linked to human-induced climate change, the weather@home team is running their model with two different sets of initial conditions.

– Real conditions that were actually measured (with high levels of greenhouse gases).

– ‘Natural’ atmosphere and ocean conditions that would have existed without the influence of human emissions.

By running thousands and thousands of these simulations, the Oxford team can then compare how frequently the extreme events occur in both sets of simulations and see whether the impact of human emissions have made these events more likely and/or stronger.

The weather@home project is on going, and the more simulations are carried out, the more robust the conclusions will be.

The first results are in!

The scientists are analysing the model results as they come in from citizen scientists’ homes, and anyone can monitor how the data evolves as more results are published on the website.  Their first four batches of results are online here and it is possible to observe first hand how the plots are slowly building up as more and more data comes in. Thousands and thousands of simulations are still needed in order to acquire statistically significant results, and it is still time to join the project. The more the merrier. And the better scientists’ understanding of last winter’s extreme weather.


The wet with the dry: The geology of Siwa Oasis

The wet with the dry: The geology of Siwa Oasis

Flo takes us on a photoblog-trip to Siwa Oasis in Egypt where epic sand seas meet freshwater springs, saline lakes and sulphurous hot pools! 

Siwa Oasis, adapted from Google Earth.

Siwa Oasis, adapted from Google Earth.

The blog’s going on holiday this week! I spent a week in Egypt on holiday last month and braved the 10 hour overnight bus journey from the capital city Cairo to visit the breathaking beauty of the Siwa Oasis in the Egyptian sand sea of the Libyan desert. I have to say that the shift from big-city Cairo to Siwa via a 10 hour bus drive added a real sense of remoteness when we pulled into the town, bleary-eyed the following morning.

Map

Map of Egypt with the route from Cairo-Siwa, adapted from Google Maps.

I really didn’t know anything about Siwa at all before arriving there apart from noticing the numerous and ubiquitous boxes of Siwan bottled water around Cairo, not an industry I had associated with a small town in the middle of the desert. I’ve always thought of oases as being on a small scale and having a fabled quality and so suffice to say I wasn’t ready for the numerous lakes, springs and hot pools that abound in Siwa.

Siwa is an area of contrasts, the epic sand dunes visible to the west of town are juxtaposed with over a 1000 fizzing natural springs, sulphurous hot pools, and hypersaline lakes. It’s this unique collection of features that brought people to settle here over 12,000 years ago and continues to attract tourists, despite its remote location! And it is certainly bizarre to be in the middle of a desert and find that almost all the things to visit are water related.

History

Aside from the mind boggling landscape and geology, Siwa has an unusual and diverse history.  It is one of Egypt’s most isolated settlements, both geographically and culturally with a population predominantly made up of ethnic Siwans who speak Siwi, a distinct language of the Berber family with a smaller proportion of Arabic-speaking Egyptians. Historically, Siwa is famous as the home of the Oracle of Amun and the ruins of this temple can still be visited today.

View of Siwa Landscape from the Temple of Amun - Authors own image.

View of Siwa Landscape from the Temple of Amun – Authors own image.

It was here that Alexander the Great travelled (as well as founding Alexandria), during his campaign to conquer the Persian empire in 332 BC to consult the Oracle of Amun. There it is alleged the Oracle confirmed Alexander the Great as both a divine personage and the legitimate Pharoah of Egypt! The remoteness of the oasis meant that contact with the outside world was rare. The first record of a European visiting since roman times was the English traveler William George Browne who arrived in 1792 to see the ancient temple of the oracle. The oasis wasn’t even officially added to Egypt until 1819 and the first asphalt road to Siwa wasn’t built until the 1980’s! This isolation has served to preserve the delicate environmental and cultural balance of the Oasis. A small town of around ~23,000 people, Siwa’s economy is based on agriculture, largely olives and dates, some tourism and the water bottling plants dotted around the Oasis. But how did all this water come to be here? As with all things, we need to start with the geology!

Regional geology and geography

The area around Siwa is described as a ‘slightly undulating limestone plateau’ of Miocene age as the 1910 geological map of Egypt shows below and the vast areas of the map marked ‘Unexplored’ give you some insight as to how remote and difficult some of this terrain is.

Geological map

1910 Geological Map of Egypt by the Survey Department of Egypt. Image out of Copyright.

Siwa sits in the Qattara depression which spans the north west of Egypt. Much of the depression sits below sea level: at its deepest it sits at 133m below sea level making it the second lowest point in Africa. It is bounded by steep slopes to the North side and to the south and west it grades into the Great Sand Sea.

240px-Egypt_relief_location_map

Map of Egypt showing the location of the Qattara depression in blue – Source – Eric Gaba, Wikimedia Commons.

The depression is thought to be formed by the processes of salt weathering and wind erosion working together. The intense aelioan weathering causes the salt to crumble the depression floor and then the wind blows away the resulting sands.

Salt lamps

Souvenirs made from salt-rock for sale in Siwa. Image Author’s own.

Salt is an issue in Siwa (although it makes for a modest market in selling bottled salt and also salt-rock souvenirs such as lamps). A number of fresh water springs that occur naturally in the Oasis run into salt water lakes making a lot of the water useless. Often even the spring water has an elevated level of salt and so not good for agriculture. This limits agricultural production in the area to mostly hardy crops such as dates and olives.

Cleopatra

Just one of the 1000’s of springs in the Siwa area, this is ‘Cleopatra’s Pool’. The spring water here bubbles up from depth at pressure. Image Author’s own.

The main Oasis lakes Birket al-Maraqi and Birket Siwa are saline and no marine life survives. Indeed some of the water is so salty that you can see crystals growing in the water. The salty soil of the oasis continues to be used to build the traditional mudbrick houses which creates a problem. While the salt helps to strengthen the walls of the house, it also melts in the rain. And it doesn’t take much to destroy the houses, in 1928, a major storm resulted in the local inhabitants abandoning their ancient town including the ancient Shali Fort found in the centre of the town. These days new houses are prefabricated to remove the risk of rain melting the building materials!

IMAG2175

Shali Fort in the centre of Siwa made from salty mud sourced from the oasis. You can see the damage sustained y the 1928 storm in the collapsing walls. Image Author’s own.

The Wet with the Dry

The Wet

With a mean annual precipitation of 8mm and many rainless years, the vast lakes in the region have something other than the weather to thank for their existence. The wide spanning Qattara depression contains a number of small basins on the floor which hold lakes. It is thought that these lakes were much larger during the Pleistocene Ice Age.  It is at the fossil shorelines of these lakes that you can find the bounty of fossils we saw on our trip. These days the levels of the lakes fluctuate seasonally with some lakes drying up completely during the summer seasons.

The numerous springs supply that supply water to the lakes is thought to have been underground for 30,000-50,000 years in the Nubian Sandstone Aquifer System which is considered to be a non-renewable source of water in the North Africa area. It covers parts of Libya, Egypt, Sudan and Chad having  a huge storage capacity of ~200,000 bcm of fresh water.

Hot sulphurous springs at Bir Wahed. Image Author's own.

Hot sulphurous springs at Bir Wahed. Image Author’s own.

Whilst the features of Siwa Oasis are broadly natural phenomena there are some other beautiful water-related sites in the area which had a bit of a helping hand in their formation. Around 15km South-West of Siwa you come to the hot and cold springs of Bir Wahed. Both public bathing spots, the first is a sulphurous hot pool where you can relax under the desert sun, and the second is a large cold spring water lake. These two formed when a Russian or American ( depending on who you speak to) oil company came to do some prospective drilling in the 80’s. They didn’t find any oil but they did find water and their activity created the two mini-oases found there today. Now they serve as blissful tourist stops amid the dunes of the Great Sand Sea.

Bir Wahed

The cold spring lake at Bir Wahed, formed during prospective drilling for oil in the 80’s. Image Author’s own.

The Dry

Sand dunes in the Great Sand Sea. Image Author's Own.

Sand dunes in the Great Sand Sea. Image Author’s Own.

The Great Sand Sea seen to the West of Siwa Oasis is a 72,000 sq km behemoth of a desert (about the size of Ireland) and is made up predominantly of parallel seif dunes some over 100m high and over 150km long. The area has a rather morbid and adventurous past dating back 2,500 years ago when a 50,000 strong Persian army led by the Persian King Cambyses II  is thought to have drowned in the sands of the western Egypt desert during a sandstorm.   It was reported in 2012 that the remains of the army may have finally been found and thus solving one of archaeology’s biggest outstanding mysteries. Having spent the afternoon in the dunes, it’s wasn’t hard to see how you could lose your bearings without the aid of modern technology.

IMAG2281

Great Sand Sea, Egypt. Image Author’s Own.

The landscape of the areas is mainly shaped by aeolian processes causing deflation hollows (where the force of the wind is concentrated on a particular spot in the landscape), erosion can carve out a pit knowns as a deflation hollow. They can range in size from a few metres to a hundred metres in diameter.  Much larger, shallower depressions called pans can also form which cover thousands of square kilomeres.  The Qattara depression is one of the largest pans in the world, while Siwa is a smaller pan. The Great Sand Sea wasn’t always a desert and large areas are thought to have been submerged underwater as attested to by the presense of rich fossil-bearing sediments outcropping in the desert. The fossil finds in this area include a whale skeleton, a human footprint, oysters and echinoids up to Miocene in age.

Fossils found exposed in the Great Sand Sea. Imasge Author's Own.

Fossils found exposed in the Great Sand Sea. Imasge Author’s Own.

Finding sea-living fossils in the desert reminded me of just how powerful geological understanding is. Standing looking out over the wind shaped dunes, it’s hard to imagine a thriving shallow sea existing here, but that it did and the deposits and fossils help us to observe and understand past environments, however different they may have been! Water Management

Well

Groundwater Well in Siwa. Image Author’s Own.

Groundwater is the only source of water in Siwa which is used for home use as well as for agriculture and the local economy including the four companies that now bottle water in Siwa. For 1000’s of years the natural system was sustainably preserved but emerging pressures from development, tourism and climate change could put this  delicate water system and the ecosystems it  supports at risk.

Since the 1960s the Oasis has experienced significant changes in activity patterns which have had an impact on land use and water management. These days in drier parts of the year the Oasis lake is often dry leaving only mud flats behind due to local government irrigation practices siphoning water away from the lake.

The large size of the Qattara depression and the fact that it’s at a very low altitude has led to several proposals to create a massive hydroelectric project in northern Egypt rivalling the Aswan high dam. Interest in this has waned slightly in recent years but future stability in the country could create the climate for development and this would have significant impacts on the Siwa region.